Faculty Profile prashantha K EEE dept Sri Sairam college of Engineering
Exponential growth and decay
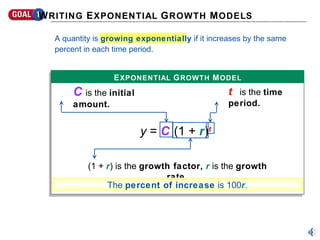
1. C is the initial amount. t is the time period. (1 + r ) is the growth factor, r is the growth rate. The percent of increase is 100 r . y = C (1 + r ) t E XPONENTIAL G ROWTH M ODEL W RITING E XPONENTIAL G ROWTH M ODELS A quantity is growing exponentially if it increases by the same percent in each time period.
2. C OMPOUND I NTEREST You deposit $500 in an account that pays 8% annual interest compounded yearly. What is the account balance after 6 years? S OLUTION M ETHOD 1 S OLVE A S IMPLER P ROBLEM Find the account balance A 1 after 1 year and multiply by the growth factor to find the balance for each of the following years. The growth rate is 0.08 , so the growth factor is 1 + 0.08 = 1.08 . A 1 = 500 ( 1.08 ) = 540 Balance after one year A 2 = 500 ( 1.08 )( 1.08 ) = 583.20 Balance after two years A 3 = 500 ( 1.08 )( 1.08 )( 1.08 ) = 629.856 A 6 = 500 ( 1.08 ) 6 793.437 Balance after three years Balance after six years Finding the Balance in an Account • • • • • •
3. S OLUTION M ETHOD 2 U SE A F ORMULA C OMPOUND I NTEREST You deposit $500 in an account that pays 8% annual interest compounded yearly. What is the account balance after 6 years? Use the exponential growth model to find the account balance A . The growth rate is 0.08 . The initial value is 500 . E XPONENTIAL G ROWTH M ODEL C is the initial amount. t is the time period. (1 + r ) is the growth factor, r is the growth rate. The percent of increase is 100 r . y = C (1 + r ) t E XPONENTIAL G ROWTH M ODEL 500 is the initial amount. 6 is the time period. (1 + 0.08 ) is the growth factor, 0.08 is the growth rate. A 6 = 500 ( 1.08 ) 6 793.437 Balance after 6 years A 6 = 500 (1 + 0.08 ) 6 Finding the Balance in an Account
4. A population of 20 rabbits is released into a wildlife region. The population triples each year for 5 years. Writing an Exponential Growth Model
5. So, the growth rate r is 2 and the percent of increase each year is 200%. 1 + r = 3 A population of 20 rabbits is released into a wildlife region. The population triples each year for 5 years. a. What is the percent of increase each year? S OLUTION The population triples each year, so the growth factor is 3. 1 + r = 3 Reminder: percent increase is 100 r . So, the growth rate r is 2 and the percent of increase each year is 200%. So, the growth rate r is 2 and the percent of increase each year is 200% . 1 + r = 3 Writing an Exponential Growth Model The population triples each year, so the growth factor is 3.
6. A population of 20 rabbits is released into a wildlife region. The population triples each year for 5 years. b. What is the population after 5 years? S OLUTION After 5 years, the population is P = C (1 + r ) t Exponential growth model = 20 (1 + 2 ) 5 = 20 • 3 5 = 4860 Help Substitute C , r , and t . Simplify. Evaluate. There will be about 4860 rabbits after 5 years. Writing an Exponential Growth Model
7. G RAPHING E XPONENTIAL G ROWTH M ODELS Graph the growth of the rabbit population. S OLUTION Make a table of values, plot the points in a coordinate plane, and draw a smooth curve through the points. P = 20 ( 3 ) t Here, the large growth factor of 3 corresponds to a rapid increase A Model with a Large Growth Factor t P 4860 60 180 540 1620 20 5 1 2 3 4 0 0 1000 2000 3000 4000 5000 6000 1 7 2 3 4 5 6 Time (years) Population
8. A quantity is decreasing exponentially if it decreases by the same percent in each time period. C is the initial amount. t is the time period. (1 – r ) is the decay factor, r is the decay rate. The percent of decrease is 100 r . y = C (1 – r ) t W RITING E XPONENTIAL D ECAY M ODELS E XPONENTIAL D ECAY M ODEL
9. C OMPOUND I NTEREST From 1982 through 1997, the purchasing power of a dollar decreased by about 3.5% per year. Using 1982 as the base for comparison, what was the purchasing power of a dollar in 1997? S OLUTION Let y represent the purchasing power and let t = 0 represent the year 1982. The initial amount is $1. Use an exponential decay model. = ( 1 )(1 – 0.035 ) t = 0.965 t y = C (1 – r ) t y = 0.965 15 Exponential decay model Substitute 1 for C , 0.035 for r . Simplify. Because 1997 is 15 years after 1982, substitute 15 for t . Substitute 15 for t . The purchasing power of a dollar in 1997 compared to 1982 was $0.59. 0.59 Writing an Exponential Decay Model
10. G RAPHING E XPONENTIAL D ECAY M ODELS Graph the exponential decay model in the previous example. Use the graph to estimate the value of a dollar in ten years. S OLUTION Make a table of values, plot the points in a coordinate plane, and draw a smooth curve through the points. Your dollar of today will be worth about 70 cents in ten years. y = 0.965 t Help Graphing the Decay of Purchasing Power 0 0.2 0.4 0.6 0.8 1.0 1 12 3 5 7 9 11 Years From Now Purchasing Power (dollars) 2 4 6 8 10 t y 0.837 0.965 0.931 0.899 0.867 1.00 5 1 2 3 4 0 0.7 0.808 0.779 0.752 0.726 10 6 7 8 9
11. G RAPHING E XPONENTIAL D ECAY M ODELS y = C (1 – r ) t y = C (1 + r ) t E XPONENTIAL G ROWTH M ODEL E XPONENTIAL D ECAY M ODEL 1 + r > 1 0 < 1 – r < 1 An exponential model y = a • b t represents exponential growth if b > 1 and exponential decay if 0 < b < 1 . C is the initial amount. t is the time period. E XPONENTIAL G ROWTH AND D ECAY M ODELS C ONCEPT S UMMARY (1 – r ) is the decay factor, r is the decay rate. (1 + r ) is the growth factor, r is the growth rate. (0, C) (0, C)
20. E XPONENTIAL G ROWTH M ODEL C is the initial amount. t is the time period. (1 + r ) is the growth factor, r is the growth rate. The percent of increase is 100 r . y = C (1 + r ) t
21. E XPONENTIAL D ECAY M ODEL C is the initial amount. t is the time period. (1 – r ) is the decay factor, r is the decay rate. The percent of decrease is 100 r . y = C (1 – r ) t