
Recomendados
Mais conteúdo relacionado
Mais procurados
Mais procurados (20)
Semelhante a Ecology of nutrients
Semelhante a Ecology of nutrients (20)
Mais de jbgruver
Mais de jbgruver (20)
Último
Último (20)
Ecology of nutrients
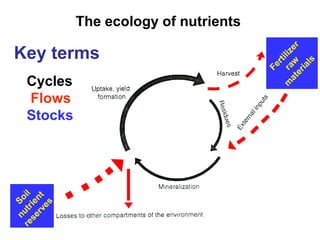
- 1. The ecology of nutrients Key terms Cycles Flows Stocks
- 2. Internal cycling is most important in natural ecosystems Nutrient inputs • Chemical weathering of rocks • Biological fixation of atmospheric N • Deposition of elements from atmosphere Ecosystem • Transfer of nutrients Between plants and soil Between organic and inorganic forms Internal cycling • Changes in ionic forms • Biological uptake • Interactions with mineral surfaces • Leaching • Gaseous emissions • Wind and water erosion • Fire • Harvest Nutrient losses
- 3. Nutrient budget for Hubbard Brook Forest Source of plant nutrient (% of total) Nutrient Deposition/fixation Weathering Recycling Nitrogen 7 0 93 Phosphorus 1 < 10 > 89 Potassium 2 10 88 Calcium 4 31 65 Data from (Whittaker et al. 1979)
- 4. Elemental concentrations in soil vs. earth’s crust 0.001% 0.01% 0.1% 1% 10% 100% crust soil Adapted from Essington (2003)
- 5. Which forms of nutrients are bioavailable? All participate in biogeochemical cycles “active” OM but rates of “flow” vary widely. humus exchangeable ions ions in solution weatherable minerals
- 6. Nutrient ecology in agroecosystems What’s missing?
- 7. Unfortunately environmental losses are sometimes larger than How big should this arrow be? nutrient removal in harvest Dissipation into the surrounding environment via erosion, leaching, volatilization…
- 8. N budget for Rothamsted wheat experiment From the To the atmosphere atmosphere Crop 50 10-50 Fertilizer uptake 200 200 SOM - N 4000 160 80 NO3- + NH4+ Microbial Biomass N #s = kg/ha (0.89*kg/ha = lbs/ac) Loss by leaching 20-100 The total N stocks in soil normally greatly exceed annual flows
- 9. Without fertilization, N is often a limiting nutrient (i.e., N mineralization is often much slower than potential crop uptake) Peak uptake ~ 3 lbs of N/ac/day Potential N uptake by wheat pasture Mineralized soil N Jenkinson
- 10. "The most effective management strategy will be one that recognizes the pattern of nitrogen demand by the crop and the nitrogen release characteristics of all important nitrogen sources to provide adequate, but not excessive levels of soil nitrogen throughout the growing season." Peak uptake = 5-10 lbs (Doerge, 1991) of N/ac/day
- 11. Timing of availability has a big impact on uptake vs. losses (Dinnes et al., 2001)
- 12. Weathering, deposition and recycling often supply trace elements at rates which are not limiting Total stocks in prairie soil A horizons low high average element (mg/kg) (mg/kg) (mg/kg) lbs/ac- pl* B 11 92 45 90 Cu 65 140 24 48 Mn 100 3907 480 960 Mo 0.4 6.9 2 4 Zn 20 770 65 130 * assumes 1 acre- plow layer = 2 million lbs w/ average conc.
- 13. Acre-plow layer stocks of trace elements expressed as years of removal by corn, soybeans and alfalfa lbs removed lbs removed lbs removed Total by 150 bu by 60 bu by 6 ton element lbs/ ac-pl corn yrs soybeans yrs alfalfa yrs B 90 0.16 563 0.1 900 0.3 300 Cu 48 0.1 480 0.1 480 0.06 800 Mn 960 0.3 3200 0.6 1600 0.6 1600 Mo 4 0.008 500 0.01 400 0.02 200 Zn 130 0.27 481 0.2 650 0.24 542
- 14. Average annual deposition of Saharan dust in the Amazon basin exceeds 10 million tons or > 150 lbs/ac Dust leaving Swap et al. (1992) concluded that the Sahara the productivity of the Amazon rain forest is dependent upon trace elements contained in dust originating in the Sahara. “As soils develop in humid environments, rock-derived elements are gradually lost, and under constant conditions it seems that ecosystems should reach a state of profound and irreversible nutrient depletion. We show here that inputs of elements from the atmosphere can sustain the productivity of Hawaiian rainforests on highly weathered soils. Cations are supplied in marine aerosols and phosphorus is deposited in dust from central Asia, which is over mg dust/m2/yr 6,000km away.” ( Chadwick et al, 1999)
- 15. Total Ammonia Emissions by County (1995) Where is all this ammonia coming from ??
- 17. Deposition of biological available N 1990s 50 lbs N/acre
- 19. N inputs to IL soils (alfalfa and other forage legumes) Mg = 1 x 10⁶ g = 1000 kg = 1 metric ton 1 metric ton = 2204.6 pounds 1 metric ton = 1.1023 US tons M.David
- 20. N outputs from IL soils M.David
- 21. Crop specific harvests of N M.David
- 22. Net N inputs Net input = Gross inputs - outputs 1993 M.David
- 23. Mining Prairie N Anthropogenic N inputs M.David
- 24. -523,000 tons of N/yr ! Units are 1000 metric tons N / yr M.David
- 25. +1 ton of N/yr ! Units are 1000 metric tons N / yr M.David
- 26. Why does so much N get into Illinois’ rivers ???
- 27. Approximately 40% of IL fields have artificial drainage
- 28. Yield maps have made drainage problems more obvious ↓ more artificial drainage ↓ more nutrient pollution
- 29. Photo: MARGARET BOURKE-WHITE So where do the nutrients in IL grain end up? Aerial view of Cargill grain elevator w. barges lined up on the bank of the Chicago River in 1951
- 30. Redistribution of nutrients in the Mid-Atlantic region excess Counties with large excesses have the most livestock
- 31. Surplus P and N State P N --Million of lbs in excess-- DE 7.3 14.6 Why don’t we MD 10.4 19.6 send the NJ 0.9 1.8 surplus nutrients NY 3.3 4.2 back? PA 23.7 33.8 VA 24.8 42.3 (Source: USDA, 2001)
- 33. Keith Bowers of Multiform Harvest in Seattle has developed a system to remove phosphates from swine and dairy manure. It involves changing the chemistry of the liquid manure to form struvite, a phosphate compound that is precipitated out of the slurry. Struvite, magnesium ammonium phosphate, is sometimes deposited naturally as scale on wastewater pipes and in the human body as kidney stones. It’s in demand as a slow release fertilizer and magnesium source.
- 34. Nutrient depletion in Africa http://www.fao.org/docrep/006/y5066e/y5066e02.jpg
- 35. Nutrient budgets on organic farms a review of published data N Most organic farms in developed countries do not have nutrient deficits even though they don’t use conventional fertilizers. P K http://www.organic.aber.ac.uk/library/Nutrient%20budgets%20on%20organic%20farms.pdf
- 37. Daily inputs and outputs of dry matter, P and N http://edis.ifas.ufl.edu/DS096
- 38. N P K 20% maintenance 13% maintenance 12% maintenance 20% 27% 13% 60% 60% 75% urine feces N 50% 50% P 10% 90% K 90% 10% http://extension.oregonstate.edu/catalog/html/em/em8586/
- 39. Nitrogen budget for a dairy in Florida (lbs of N/acre) http://edis.ifas.ufl.edu/DS096
- 40. Annual manure production and nutrient value for a 100 cow dairy Manure constituent Lbs/year/100 cows Probable $ value Raw manure (feces + urine) 5,045,000 Water in fresh manure 4,458,990 Total solids 586,000 Total N (lb) 23,400 $3,5101 Total P (lb) 4,800 $2,8801 Total K (lb) 15,100 $2,2651 TOTAL VALUE of N, P, and K $8,655 1Based on assumed values of $.30/lb N, $.60/lb P, and $.15/lb K; N recovered was 50% of excretion, thus, 50% volatilized.
- 42. Concentrated Animal Feeding Operations (CAFOs) in IL There are ~ 500 “large" CAFOs and ~ 2,700 "Medium" CAFOs in IL. These CAFOs are required to: Apply for a National Pollutant Discharge Elimination System (NPDES) Permit Submit an Annual Report Develop and implement a manure and wastewater handling plan (Nutrient Management Plan).
- 43. In Illinois, there are actually 3 different types of manure management plans that livestock facilities may be required to have (NRCS, IL DOA, and IL EPA). U of I Extension has worked with NRCS, IL DOA, IL EPA to develop one workbook of forms and instructions that when completed by a producer, will comply with the requirements of all 3 agencies.
- 46. Overview of Hislop farm 1500 sow farrow-to-wean operation 32,000 piglets (with an average weight of 10 lbs) are sold off the farm each. 1500 acres of crops - 750 acres of corn - 50 % sold off the farm, 750 acres of soybeans – 100% sold off the farm. ~ 1300 tons of feed purchased each year. Manure from the sow operation is applied exclusively to corn ground. Fertilizer is also applied to corn ground.
- 47. Nutrient inputs Purchased feed Purchased fertilizer Biological N fixation
- 48. Nutrient inputs How many tons of N, P and K are in 1300 tons of purchased feed ? Feed analysis? N 2% of 1300 tons = ? of N P 0.8% of 1300 tons = ? tons of P K 0.4% of 1300 tons = ? tons of K
- 49. Nutrient inputs How many tons of N, P and K are in the purchased fertilizer ? Fertilizer program? Acres? Fertilizer receipts? N 750 acres*100 lbs/acre*1 ton/2000 lbs = ? tons N P 750 acres*25 lbs/acre*1 ton/2000 lbs = ? tons P K 750 acres*50 lbs/acre*1 ton/2000 lbs = ? tons K
- 50. Nutrient inputs Biological N fixation ~ 3 lbs of N fixation per bushel of beans 750 acres of soybeans*50 bu/acre*3 lbs of N fixation/bu
- 51. Total nutrient inputs ∑ Feed Fertilizer Biological N fixation
- 52. Nutrient outputs ∑ Marketed grain Marketed piglets Environmental losses
- 53. Nutrient cycling on-farm Nutrients in manure Nutrients in crop residues Nutrients in 50% of corn grain
- 54. You are welcome to analyze your family’s farm or any other farm with which you are affiliated.