UiPath Community: Communication Mining from Zero to Hero
Infographic
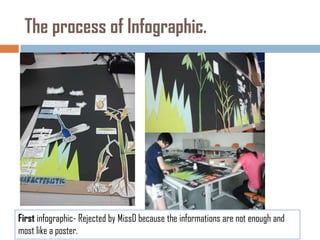
1. The process of Infographic.
First infographic- Rejected by MissD because the informations are not enough and
most like a poster.
2. Final Infographic – We have changed the whole design into four A1 cardboards with the
‘Biostatistic’ theme. Other than that, we research the information again and use
computer to type.
5. We analysis the creature’s
histories,habitats and
reproductions.
Besides that, we also do
researches about their
specific details,
Example: Ant able to lift
weight as 20 times of its
own body weight.
6. We analysis the plant’s
histories,habitats , soil pH
level and reproductions.
Besides that, we also do
researches about their
specific details,
Example: Rubber tree
produce latex at 6 years of
age.
7. Infographic above:
This is our side with the creatures
and plants that we explore. There is
a diagram show the conclusion of
the relationship between the size
of animal and the population.
Infographic below:
The analysis about the soil type
of our site. Different type of soils
suitable for different plants.
8. Due to our theme
‘Biostatistic’, so these boards
are totally about the statistics
that we done for the
population.
The infographic contains pie
chart, bar charts, pyramid
chart and diagrams to show
the numbers that we collected.