IRJET- Role of Compaction Energy on Dry density and CBR
•
0 likes•22 views

https://www.irjet.net/archives/V5/i3/IRJET-V5I3417.pdf

Recommended
Recommended
More Related Content
What's hot
What's hot (19)
Similar to IRJET- Role of Compaction Energy on Dry density and CBR
Similar to IRJET- Role of Compaction Energy on Dry density and CBR (20)
More from IRJET Journal
More from IRJET Journal (20)
Recently uploaded
Recently uploaded (20)
IRJET- Role of Compaction Energy on Dry density and CBR
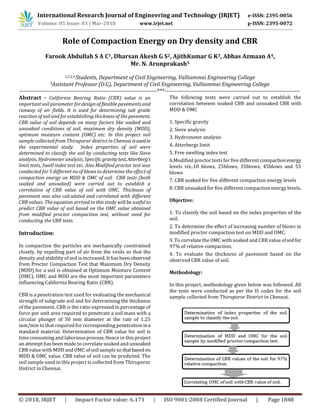
- 1. International Research Journal of Engineering and Technology (IRJET) e-ISSN: 2395-0056 Volume: 05 Issue: 03 | Mar-2018 www.irjet.net p-ISSN: 2395-0072 © 2018, IRJET | Impact Factor value: 6.171 | ISO 9001:2008 Certified Journal | Page 1848 Role of Compaction Energy on Dry density and CBR Farook Abdullah S A C1, Dharsan Akesh G S2, AjithKumar G K3, Abbas Azmaan A4, Mr. N. Arunprakash5 1,2,3,4 Students, Department of Civil Engineering, Valliammai Engineering College 5Assistant Professor (O.G), Department of Civil Engineering, Valliammai Engineering College ------------------------------------------------------------------------***----------------------------------------------------------------------- Abstract - California Bearing Ratio (CBR) value is an important soil parameter for design of flexible pavements and runway of air fields. It is used for determining sub grade reaction of soil and for establishing thickness of the pavement. CBR value of soil depends on many factors like soaked and unsoaked conditions of soil, maximum dry density (MDD), optimum moisture content (OMC) etc. In this project soil sample collected from Thiruporur district in Chennai isusedin the experimental study. Index properties of soil were determined to classify the soil by conducting tests like Sieve analysis, Hydrometer analysis, Specific gravitytest,Atterberg’s limit tests, Swell index test etc. Also Modified proctor test was conducted for 5 different no of blows to determine the effect of compaction energy on MDD & OMC of soil. CBR tests (both soaked and unsoaked) were carried out to establish a correlation of CBR value of soil with OMC. Thickness of pavement was also calculated and correlated with different CBR values. The equation arrived in this study will be useful to predict CBR value of soil based on the OMC value obtained from modified proctor compaction test, without need for conducting the CBR tests. Introduction: In compaction the particles are mechanically constrained closely, by expelling part of air from the voids so that the density and stability of soil is increased. It hasbeenobserved from Proctor Compaction Test that Maximum Dry Density (MDD) for a soil is obtained at Optimum Moisture Content (OMC). OMC and MDD are the most important parameters influencing California Bearing Ratio (CBR). CBR is a penetration test used for evaluating the mechanical strength of subgrade soil and for determining the thickness of the pavement. CBR is the ratio expressed in percentage of force per unit area required to penetrate a soil mass with a circular plunger of 50 mm diameter at the rate of 1.25 mm/min to that required for corresponding penetrationina standard material. Determination of CBR value for soil is time consuming and laboriousprocess. Hence in this project an attempt has been made to correlate soaked and unsoaked CBR value with MDD and OMC of soil sample sothatbasedon MDD & OMC value, CBR value of soil can be predicted. The soil sample used in this project is collected from Thiruporur District in Chennai. The following tests were carried out to establish the correlation between soaked CBR and unsoaked CBR with MDD & OMC 1. Specific gravity 2. Sieve analysis 3. Hydrometer analysis 4. Atterbergs limit 5. Free swelling index test 6.Modified proctor tests for five different compactionenergy levels viz..10 blows, 25blows, 35blows, 45blows and 55 blows 7. CBR soaked for five different compaction energy levels 8. CBR unsoaked for five different compaction energy levels. Objective: 1. To classify the soil based on the index properties of the soil. 2. To determine the effect of increasing number of blows in modified proctor compaction test on MDD and OMC. 3. To correlate the OMC with soaked and CBR value ofsoilfor 97% of relative compaction. 4. To evaluate the thickness of pavement based on the observed CBR value of soil. Methodology: In this project, methodology given below was followed. All the tests were conducted as per the IS codes for the soil sample collected from Thiruporur District in Chennai.
- 2. International Research Journal of Engineering and Technology (IRJET) e-ISSN: 2395-0056 Volume: 05 Issue: 03 | Mar-2018 www.irjet.net p-ISSN: 2395-0072 Experimental Results and Discussions: The collected soil has been classified based on the values of index properties such as Liquid Limit, Plastic Limit, Shrinkage Limit, particle size distribution, Specific gravity, Free swelling index. Values obtained from Modified Proctor Compaction Test and Soaked and Unsoaked CBR Test were tabulated and graphs were plotted in order to correlate CBR value of soil with OMC. Results of Specific Gravity (Is 2720 Part-3) Table 1-Results of specific gravity Figure 1-Graph between water content and number of blows Weight of bottle =W1 (g) Weight of bottle+soil =W 2 (g) Weight of dry soil=Ws =W2 - W1 (g) Weight of bottle+soil+water = W 3 (g) Weight of bottle+water = W 4 (g) Weight of equivalent volume of water WW = Ws +W4 -W3(g) Average specific gravity of the soil =2.053 Results of Atterbg Limit (Is: 2720Part:5) From the graph the liquid limit was found to be 27%. Table 2-Results of shrinkage limit Trial no. 1 2 3 Wt. of container(g) 66 69 62 Wt. of wet sample + container(g) 111 108 114 Wt. of dry sample+container(g) 97 99 106 Wt. of water(g) 14 9 8 Wt. of dry soil pat(wd) 31 30 44 Water content in (%) 45.16 30 18.18 Wt. of mercury container(g) 45 45 45 Wt. of mercury displaced(g) 296 301 297 Volume of mercury displaced=volume of dry soil pat(Vd) 21.79 22.16 21.87 Volume of wet soil pat(v) 23.86 26.06 26.50 Shrinkage limit (Ws) (%) 38.48 17 7.66 Therefore Shrinkage limit = 38.48% SIEVE ANALYSIS (IS: 2720 Part 4) Figure 2-Graph between %finer and IS sieve sizes From graph, % Gravel=3%, %Sand=52.5%, %silt and clay=44.5% FREE SWELLING INDEX (IS:2720 PART:40) Table 3-Results of free swelling index Percentage of swell = 22.22 INFERENCES FROM INDEX PROPERTIES EXPERIMENTS 1.From specific gravity tests the specific gravity of soil was found to be 2.053 2. From Atterbergs limit test, © 2018, IRJET | Impact Factor value: 6.171 | ISO 9001:2008 Certified Journal | Page 1849
- 3. International Research Journal of Engineering and Technology (IRJET) e-ISSN: 2395-0056 Volume: 05 Issue: 03 | Mar-2018 www.irjet.net p-ISSN: 2395-0072 Liquid limit of the soil = 26.99% Plastic limit of the soil = 13.04% Shrinkage limit of the soil =38.48% Plasticity index of the soil = 14.2 Since plasticity index lies between 7&17 the soil is classified as silty clay 3. From free swell index test,% of swell was found to be 22.22 4. From Sieve Analysis, %Gravel=3 %Sand=52.5 %Silt and Clay=44.5. MODIFIED COMPACTION TESTS (IS: 2720 PART-8) For 25 blows Figure 3- Graph between moisture content and dry density for 25 blows From graph, max. dry density =1.762 g/c optimum moisture content= 7.5% FOR 10 BLOWS Figure 4-Graph between moisture content and dry density for 10 blows From graph, the max. dry density =1.723 g/cc optimum moisture content=9.4% FOR 35 BLOWS: Figure 5- Graph between moisture content and dry density for 35 blows From graph, Max. dry density=1.784g/cc optimum moisture content = 7.1% FOR 45 BLOWS: Figure 6-Graph between moisture content and dry Density for 45 blows From graph , max. dry density = 1.81 g/cc optimum moisture content= 6.6% FOR 55 BLOWS: Figure 7-Graph between moisture content and dry density for 55 blows © 2018, IRJET | Impact Factor value: 6.171 | ISO 9001:2008 Certified Journal | Page 1850
- 4. International Research Journal of Engineering and Technology (IRJET) e-ISSN: 2395-0056 Volume: 05 Issue: 03 | Mar-2018 www.irjet.net p-ISSN: 2395-0072 From graph, max. dry density = 2.11g/cc optimum moisture content= 6.4% Figure 8 Combined graphs of modified proctor tests for 5 different no of blows from modified compaction tests, for increasing no. of blows mdd was found to increase and omc was found to decrease which is in accordance with the statement in the journel “optimum water content and maximum dry unit weight of clayey gravels at different compactive efforts” by mehrab jesmani, a. nasiri manesh,volume13/1-14 Table 4 - Number of blows and % decrease in Optimum moisture content w.r.t. 10 blows. Number of blows % Decrease in OMC w.r.t . 10 blows 10 0 25 1.9 35 2.3 45 2.8 55 3 Figure 9-Graph between no. of blows and % decrease in OMC w.r.t 10 blows Table 5 - Number of blows and % increase in maximum dry density w.r.t. 10 blows. Figure 10- Graph between no. of blows and % increase in MDD w.r.t 10 blows RELATIONSHIP BETWEEN CBR VALUE WITH OMC Table 6- CBR value and optimum moisture content OMC (%) Unsoaked CBR value (%) 9.4 3.130 7.5 11.429 7.1 14.92 6.6 18.2 6.4 20.4 Figure 11-Graph correlating CBR value with OMC © 2018, IRJET | Impact Factor value: 6.171 | ISO 9001:2008 Certified Journal | Page 1851
- 5. International Research Journal of Engineering and Technology (IRJET) e-ISSN: 2395-0056 Volume: 05 Issue: 03 | Mar-2018 www.irjet.net p-ISSN: 2395-0072 CONCLUSION 1. Based on the index properties, soil is classified as silty clay 2. OMC was found to decrease and MDD was found to increase with increase in no. of blows as observed in Modified compaction test. 3. A new correlation has been proposed relating soaked and unsoaked CBR values with OMC of soil sample. 4. CBR= 5. Thus based on the above correlation,soaked andunsoaked CBR values can be predicted from the OMC value of soil thus saving the valuable time. 6. With increasing compaction energy soaked and unsoaked CBR values were found to increase thus decreasing the thickness of pavement required IS Codes Refered: 1. IS: 2720 (Part 4) -Grain size analysis 2. IS: 2720 (Part 3)-Determination of specific gravity 3. IS: 2720 (Part 5)-Determination of liquid limit and plastic limit 4. IS: 2720(Part 6)-Determination of shrinkage factors 5. IS: 2720(Part 40)-Determination of free swell index 6. IS: 2720(Part 8) - Determination of water content –dry density relation 7. IS: 2720(Part 16)-Laboratory determination of CBR. REFERENCES: 1. Ramasubbarao. G.V and SivaSankar. G (2013). “Predicting Soaked CBR Value of Fine Grained using index and Compaction Characteristics” Jordan Journal of Civil Engineering, Volume 7/354-360. 2. Anderes. M. Arvelo and Guerrero(2001). “Effects of soil properties on maximum dry density obtainedfromstandard proctor tests”. 3. Dr. Dilip Kumar and Talukdar (2014)“A Study of Correlation Between California Bearing ratio value with other properties of soil” International journal of emerging technology and advanced Engineering, volume 4/559-562. 4. Venkatasubramanian (2011)“ANN model for predicting CBR from index properties of soils” International journel of civil and structural Engineering , volume 2/605-611 5. Naveen B Shirur and Santosh G Hiremath (2014). “Establishing relationship between CBR value and physical properties of soil” IOSR Journal of Mechanical and civil Engineeering,Volume 11/26-30. 6. Mehrab Jesmani and A. Nasiri Manesh(2013) “Optimum Water Content and Maximum Dry Unit weight of clayey gravels at different compactive efforts” EJGE, volume 13/1- 14. 7. Deepak Yadav, P.K. Jain and Rakesh Kumar (2014)“Prediction of soaked CBR of fine grained soils from classification and compaction parameters” International journal on advanced Engineering research and studies.(Pg:119-121). © 2018, IRJET | Impact Factor value: 6.171 | ISO 9001:2008 Certified Journal | Page 1852