SlideShare uma empresa Scribd logo
1 de 58
STATE OF COMPETITION IN


THE INDIAN PETROLEUM INDUSTRY


      Final Report: January 20, 2009


                    By

         Indicus Analytics Pvt. Ltd
                New Delhi

                   For

     Competition Commission of India
                New Delhi


             Indicus Analytics
CONTENTS

I   INTRODUCTION.....................................................................................................................................1
II REFINERY TECHNOLOGY AND PRODUCTS................................................................................3
III GLOBAL OIL INDUSTRY...................................................................................................................5
IV INDIAN OIL INDUSTRY......................................................................................................................9
V     COMPETITION IN EXPLORATION................................................................................................14
VI COMPETITION IN USER INDUSTRIES.........................................................................................18
VII COMPETITION IN REFINING INDUSTRY.................................................................................20
VIII       COMPETITION IN GAS INDUSTRY..........................................................................................21
IX CONCLUSION......................................................................................................................................22
DATA APPENDIX.......................................................................................................................................25
    PETROLEUM STATISTICS..................................................................................................................................25


                                                                             i
Team Members

Ashok Desai
Laveesh Bhandari
Ramrao Mundhe

Maj. General Bhupindra Yadav


Special Thanks to
Experts at the Competition Commission of India
Payal Malik


                                      ii
I   Introduction
This paper is about the Indian petroleum refining industry. But this industry is extremely open;
trade flows are large compared to production. And there is considerable overlap between oil
production and refining internationally, and to some extent in India. So we begin with a brief
discussion of the international petroleum industry and its components – refining being one of
them.
Petroleum is extracted from underground reserves; then it is cracked or “refined” into end
products for various uses. The petroleum industry thus has two parts: an oil exploration and
production industry upstream and a refinery industry downstream. Most oil producers also own
refineries. But the reverse is not true; a high proportion of oil is sold to refinery companies that do
not produce crude oil.
Sedimentary rocks in which hydrocarbons are trapped often hold gas, sometimes in association
with crude oil and sometimes alone. It consists mostly of methane, which is lighter than air and
toxic. It therefore requires airtight tanks for storage and similarly leak-proof pipes or trucks for
transport, which raise its capital costs. Associated gas was flared in early years of the industry; it
is still flared at remote or minor wells where the cost of its collection and transport would be high,
or often reinjected into the oilfield to maintain pressure which forces oil up to the surface. But
where the quantities are large enough, natural gas is mined and traded. It is mainly used as an
industrial, domestic and vehicular fuel.
Motor vehicles run almost exclusively on petrol and high-speed diesel oil, both fuels derived from
mineral oil – although they can be modified to run on certain biofuels. Vehicles are so widely
dispersed that they require an extensive distribution system for these two refinery products. As
motor vehicle use has spread across the world, it has brought along with it petrol pumps,
logistics, storage and supply of fuels. There is thus a third part of the petroleum industry
downstream from refineries which distributes the products. It is owned by refineries in most
countries. But this is not inevitable. Some countries have distribution chains that are independent
of producers and refiners; and in countries which do not have refineries, distribution is undertaken
by either local or foreign oil companies.
Oil has collected in pools and seeps for thousands of years. The Chinese are recorded as having
extracted oil from wells 800 feet deep through bamboo pipes in 347; they used it to evaporate
brine and make salt. American Indians used to put it to medicinal uses. Persians, Macedonians
and Egyptians used tars to waterproof ships. Babylonians used asphalt in the eighth century to
construct the city’s walls, towers and roads. But the easily available oil was not put to any mass
use because the crude itself was not a good fuel; it gave out much soot and smoke. A distillation
process using a retort was invented by Rhazes (Muhammad ibn Zakariya Razi) in Persia in the 9 th
century; liquid heated in it vapourized, passed through a curved spout and condensed in another
container. The process could be used to make kerosene; but it was more often used to make
alcohol and essence of flowers for perfume. It was a batch process, its fuel consumption was
high, and it was not equally efficient at distilling kerosene from all crudes.
A more efficient and reliable distillation process came out of a series of inventions after 1846. The
last invention was the invention of oil fractionation in 1854 by Benjamin Silliman, a professor of
science in Yale. It used a vertical column which separated components more efficiently, and
which could be used continuously.
  Oil was first produced in Titusville, Pennsylvania (USA) in 1859 by one Edwin L Drake, who
refined it into kerosene, which was then used as an illuminant. Electricity did not emerge as an
illuminant till the Edison Electric Light Company was founded in 1878. Well into the 20th century,
kerosene, gas and electricity continued to compete as illuminants. Whilst the use of gas as an
illuminant has virtually disappeared, a large population, especially in India, continues to use
kerosene as illuminant.


                                                  1
The invention of the motor car by Karl Friedrich Benz in 1885 created a market for petrol, a new
refined product (petrol is called Benzin in Germany, but is not named after Karl Benz). In 1898,
Rudolf Diesel invented an engine in which oil was ignited by compression; the diesel engine he
invented came to power larger vehicles, principally trucks and buses. Diesel engines used a
different fuel, which was named diesel oil. After this, the production and use of motor vehicles
spread rapidly in the United States, especially after 1908 when Henry Ford began mass
manufacture of his Model T; and petroleum and diesel oil became the most important refined
products, first in the US and progressively across the world.
However, only a certain proportion of crude oil can be converted into motor fuels. The demand for
kerosene, the original distillate extracted from crude oil, has gone down with the spread of
electricity. So other refined products have been developed, and non-vehicular uses developed for
them. Some of the products differ little from motor fuels; for instance, naphtha, extensively used
to make nitrogenous fertilizers and chemicals, is little different from petrol; and jet fuel is very
similar to kerosene. Thus, refineries find markets for their products in many industries other than
motor transport (Appendix-table C4).
The Industry in India
India imports three-quarters of the crude it refines (Appendix-table D1). It exports refinery
products (Appendix-table E2); its net exports are roughly ten per cent of production. The
government operates an elaborate set of cross-subsidies to insulate domestic from international
prices; such cross-subsidies have serious effects on the finances of the Indian companies
(Appendix-table I2) involved, and influence competition amongst them. The oil companies, both
public and private, are so large a part of the economy that the cross-subsidy regime cannot be
sustained in all circumstances; sooner or later, the government has to bring domestic prices
closer to international prices. Hence the state of competition in the international market and
international prices are important for the domestic market.
In Section II, which follows, we give an introduction to refinery technology, products, and the
markets they serve. In Section III, we briefly describe the global exploration, production and
refining industries. In Section IV, we describe the Indian market structure in terms of the
companies operating in it, their products and markets. In Sections V, VI, VII and VIII, we outline
the market structure in exploration and production, user industries, refining and gas respectively.
In Section IX, we turn to the major barriers to competition and to the steps that need to be taken if
greater competition is to be introduced in the domestic market for refined products.


                                                 2
II Refinery Technology and Products
This section provides a brief overview of the technology and production process. An
understanding of these issues is critical as it helps understand industry structure.
Crude oil is a liquid mixture of hydrocarbons – chemical compounds consisting roughly of six
parts of carbon and one of hydrogen, both of which are fuels; it generally also carries small
quantities of sulphur, salts, metals, oxygen and nitrogen. It was formed from organic remains
accumulated undersea and eventually trapped in sedimentary rocks; these rocks are where crude
oil exploration is concentrated. Generally the oil is compressed, and gushes out if a pipe is
pushed into an oil-bearing trap. But as it is extracted, the pressure diminishes, and it is often
artificially reinforced by injection of air or water into the reservoir to push up the oil.
Crude oil contains hydrocarbons that vary in their boiling point; refining is a process in which
crude oil is heated in a vacuum until it evaporates and then allowed to rise up a column. Different
hydrocarbons liquefy at different temperatures and can be collected at various heights in the
distillation column.
In the basic refinery process, crude is heated to 600ºC by injection of superheated steam and
pumped in at the bottom of a vertical distillation column. As the vapour rises up the column, it
cools. The column has trays at various heights with holes. As the vapour cools, fractions with
different boiling points liquefy, collect in the trays and are drained off; products with high boiling
points rise to the top, while products with low boiling points collect on lower trays. The principal
products, with their approximate boiling points, are petroleum gas (20ºC), naphtha (40ºC), petrol
(70ºC), kerosene and jet fuel (120ºC), diesel (200ºC), lubricant (300ºC), and furnace oil (370ºC);
solid petroleum coke collects at the bottom after the liquid fractions are removed.
The proportions in which these products come out vary to an extent with the crude; crudes are
classified as light or heavy according to the proportion of light products. But the balance of
demand and supply for the products is such that the prices of furnace oil are much lower than
those of light products such as petrol, kerosene and diesel oil. In August 2008, international
prices of residual fuel oil ranged from $2.29 to $2.48 a gallon; the corresponding range was
$2.68-3.05 for petrol, $3.06-$3.29 for diesel oil, and $3.18-$3.38 for jet fuel. So other
technologies are employed to crack, alter or recombine molecules and make lighter hydrocarbons
from residual fuel oil.
The principal products obtained from the primary refining and cracking processes are (see
Appendix - table B5 and C1 for product-wise production and consumption):
Liquefied petroleum gas (LPG), mostly a combination of butane and propane. It is heavier than
air, and liquefies under pressure. It is used as a household cooking fuel, refrigerant, and vehicular
fuel; 4 million vehicles are estimated to be powered by LPG in the world.
Petrol is used to fuel internal combustion engines, mainly vehicular. Its early use as a killer of lice
and their eggs has completely disappeared.
Naphtha is used to make additives for high-octane petrol, and to make polymeric plastics and
urea, a nitrogenous fertilizer.
Aviation turbine fuel (ATF) is the fuel used in propeller planes. It is akin to petrol.
Kerosene, also known as paraffin, is used as an illuminant and cooking fuel in India and other
poor countries, and as a space heating fuel in industrial countries.
Jet fuel, used in jet planes, is closely akin to kerosene.
High-speed diesel oil is used in engines running at 750 revolutions per minute (rpm) or more. It
is mostly used in diesel-powered vehicles
Light diesel oil is used in diesel engines running at lower speed – mainly irrigation pumps and
generation sets.


                                                  3
Furnace oil is made by diluting residual fuel oil from refining with middle distillates such as diesel
oil. It is used in boilers, bunkers, heaters, furnaces, or as fertilizer feedstock. Low-sulphur heavy
stock (LSHS) is a variant of furnace oil.
Lubricating oil consists of greases and viscous oils used to lubricate moving parts in industry,
automobiles, railway engines and carriages and marine engines.
Paraffin wax is used as an electrical insulator, for heat storage and in thermostats.
Asphalt is a black thermoplastic product that is used to make roads and sometimes for
waterproofing. It is similar to tar, which is made from coal. Asphalt is also found in natural form; it
was used to waterproof Egyptian mummies.
Petroleum coke is mostly used as fuel, but is also used to make electrodes and dry cell
batteries.
Some petrochemicals are produced in large enough bulk to take a significant proportion of
refinery products: the world consumed 345 million tons of hydrocarbons in 2004 to make 310
million tons of petrochemicals. Most of the hydrocarbons are first turned into one of three
intermediates - ethylene, propylene and aromatics – before being converted to other products. Of
the latter, plastics accounted for 225 million tons, and fibres for 38 million tons; solvents,
detergents and synthetic rubber accounted for most of the rest.


                                                  4
III Global Oil Industry
In the early years of the industry, oil or gas seeped out of the earth in many places; elsewhere it
was discovered by accident while drilling for water. But such easy discoveries are long gone.
Undiscovered oil is all underground, and oil exploration today uses considerable instrumentation
– gravimeters, magnetometers, seismic reflectors and refractors – and stratigraphy, which is
essentially correlation of available geological data. The data obtained are correlated to guess the
location of rock formations and identify those that are most likely to contain hydrocarbons. Then
rigs are used to drill into those formations. Drilling costs much more than geological tests; so oil
companies invest heavily in geological investigation.
Oil production requires drilling a well into land or seabed. Land usually belongs to someone; if it is
not privately owned, it belongs to the government. Similarly, maritime countries claim ownership
of the continental shelves along their coastlines. If someone wants to explore for oil, he has to get
permission to drill. If he finds oil, he will normally want first right of exploitation. So it is normal for
explorers to make an agreement with the owner, called a concession, which lays down the rights
of the concessionaire and the payments he would make for them. In the early years, when oil
developments were small, it was generally enough to get a concession from a private owner or a
number of neighbours. In the US, there were large unoccupied areas where companies could drill
without anybody’s permission.
But as oil is came to be extracted from deeper formations, investment went up, and exploration
passed into the hands of companies which could raise capital. Also, a large area of concession
became necessary to avoid disputes with neighbouring concessionaires. Such large areas
required the intervention of governments. In the early concessions, governments played the role
of landlords, and generally levied a royalty per barrel of oil extracted. For instance, the Shah of
Persia gave a concession in 1901 to William D’Arcy, a rich Englishman, to prospect for oil in most
of Iran for 60 years, for which he was promised £20,000 in cash, £20,000 in shares of the oil
company and 16 per cent of profits. Standard Oil of California negotiated a concession with the
King of Saudi Arabia in 1933.


                                                     5
Table 1: Top twenty countries by oil consumption, 2007

                                                                                 Refining
                        GDP PPP     Consn     Output      Exports      Imports              Reserves           Energy intensity
Country                                                                          capacity
                        $trn2005                       Million barrels per day              Trillion barrels   Mbd/$trn
USA                       13.8        20.7     7.6       1             13.2      17         22                 1.5
China                     7           6.5      3.6       0.4           3.2       5.8        16                 0.9
Japan                     4.2         5.6      0.1       0.1           5.4       4.5                           1.3
Germany                   2.8         2.7      0.2                     2.1       2.3                           1.0
Russia                    2.1         2.5      9.4       7             0.1       5.4        74                 1.2
India                     3.1         2.3      0.8       0.4           2.1       2.5        6                  0.7
Canada                    1.2         2.1      3.1       1.6           1         2          179                1.8
South Korea               1.2         2.1                0.6           2.3       2.6                           1.8
Brazil                    1.8         2        1.6       0.3           0.4       1.9        12                 1.1
France                    2           2        0.7       0.5           1.9       2                             1.0
Mexico                    1.3         1.9      3.4       1.8           0.2       1.5        12                 1.5
Italy                     1.8         1.8      0.1       0.5           2.2       2.3                           1.0
Saudi Arabia              0.6         1.8      9.5       7.9                     2.1        263                3.0
United Kingdom            2.1         1.8      2.1       1.5           1.1       1.8        5                  0.9
Spain                     1.4         1.6      0.3       0.1           1.6       1.4                           1.1
Iran                      0.8         1.5      4         2.5                     1.6        133                1.9
Indonesia                 0.8         1.2      1.1       0.5           0.4       1.1        5                  1.5
Netherlands               0.6         0.9      0.1       1.4           2.3       1.2                           1.5
Thailand                  0.5         0.9      0.2                               0.9                           1.8
Australia                 0.7         0.9      0.5       0.1           0.5       0.7                           1.3
The rest                  15.4        19.4     32.1      20.3          7.7       8.3                           1.3
World                     65.2        82.2     80.5      48.5          47.7      68.9                          1.3
Std deviation/Mean        1.32        1.42     1.80      1.89          1.23      1.12       1.33               0.36
         Sources: Oil: NationMaster.com. GDP PPP: World Bank


          These concession agreements gave a relatively small share of the profits to the governments of
          oil-producing countries. But over the years, they either took shares in the concessionaire
          companies or nationalized them. By 2007, 77 per cent of oil production was in governments’
          hands; their share of reserves would be even higher, since the industries of countries with the
          largest reserves are all nationalized.
          Table 1 gives production, consumption, trade and reserves of the top 20 consumers of oil. The
          figures are not entirely accurate, but they are good enough for the broad conclusions we seek.
          The 20 countries account for three-quarters of global consumption; the remaining 186 countries
          account for only a quarter. The US accounts for a quarter and the next five countries for the next
          quarter.
          These twenty countries also account for three-quarters of the world’s GDP (at purchasing power
          parity; that is, calculated at the same prices for all countries). It would thus seem that income is a
          major determinant of oil consumption. It is, but oil intensity is equally important. The last column
          shows oil consumption per unit of GDP. It tends to be high in oil-producing countries, especially if
          they have extreme climates like Saudi Arabia, Iran and Canada. It is low in developing countries
          like India and China. Amongst industrial countries, some like Britain, France and Germany have
          brought down oil intensity considerably. Many countries tried to increase energy efficiency after
          the first oil crisis of 1973; some did so more effectively than others.
          The top 20 countries produce three-fifths of the world’s oil. This is because the biggest
          consumers include most of the biggest producers – Saudi Arabia, Russia, the US, Canada,
          Mexico, Iran and Indonesia: oil producers tend to consume relatively more oil. Naturally, they are
          oil exporters as well. That is why the top 20 consumers account for three-fifths of the world’s oil
          exports.


                                                                 6
But being the largest consumers, they account for five-sixths of the world’s oil imports. And they
account for seven-eighths of the world’s refining capacity. Oil refineries are more often sited close
to consumption centres; so consuming countries have a larger share of refining capacity than of
oil production. The ratio of standard deviation to mean confirms these conclusions. Production
and exports vary most across the 20 countries. Consumption varies much less, and variability of
imports is even less; the variability of both is comparable to the variability of GDP at purchasing
power parity. Refining capacity has the least variability, and is most evenly spread across the
countries. (Variability of reserves is also low; but this is because nine of the 20 countries have
reserves close to zero.)
                Table 2: Top twenty countries by natural gas consumption, 2006
               World Natural Gas Production, Most Recent Annual Estimates, 2006 (Trillion cubic feet)
 Country              Output     Wasted      Reinjected    Marketed     Dry gas     Imports      Exports   Consn

 United States             23.5         0.1          3.3         19.4        18.5        4.2         0.7    21.7
 Russia                    23.2         0.0          0.0         23.2        23.2        1.8         8.4    16.6
 Iran                       6.0         0.4          1.1          4.4         3.8        0.2         0.2     3.8
 Germany                    0.7         0.0          0.0          0.7         0.7        3.3         0.4     3.5
 Canada                     7.8         0.1          0.5          7.2         6.5        0.3         3.6     3.3
 Japan                      0.2         0.0          0.0          0.2         0.2        3.1         0.0     3.2
 United Kingdom             3.0         0.1          0.0          3.0         2.8        0.7         0.4     3.2
 Italy                      0.4         0.0          0.0          0.4         0.4        2.7         0.0     3.0
 Saudi Arabia               3.0         0.0          0.0          3.0         2.6        0.0         0.0     2.6
 Ukraine                    0.7         0.0          0.0          0.7         0.7        1.9         0.0     2.6
 Mexico                     1.8         0.1          0.0          1.7         1.7        0.4         0.0     2.2
 China                      2.1         0.0          0.0          2.1         2.1        0.0         0.1     2.0
 Uzbekistan                 2.2         0.0          0.0          2.2         2.2        0.0         0.4     1.8
 France                     0.1         0.0          0.0          0.1         0.0        1.8         0.0     1.8
 Netherlands                2.7         0.0          0.0          2.7         2.7        0.9         1.9     1.7
 UAE                        2.6         0.0          0.6          1.9         1.7        0.0         0.3     1.5
 Argentina                  1.8         0.0          0.0          1.8         1.6        0.1         0.2     1.5
 India                      1.1         0.0          0.0          1.1         1.1        0.3         0.0     1.4
 Thailand                   0.9         0.0          0.0          0.9         0.9        0.3         0.0     1.2
 Spain                      0.0         0.0          0.0          0.0         0.0        1.2         0.0     1.2
 All others                44.0         2.5          8.7         32.8        30.5        9.3        14.9    24.8
 World Total             127.8          3.4         14.3        109.3       104.0       32.6        31.6   104.4
Source: US Energy Information Administration


Table 2 summarizes production, consumption and trade in natural gas for 2006. Incidentally, a
barrel of oil has the energy equivalent of 6000 cubic feet of gas; so the 2006 global gas
consumption of 104.4 trillion cft of gas comes is equivalent to 47.7 million barrels per day of oil –
more than half the oil consumption given in Table 1. As will be seen, 2.7 per cent of the gas was
flared or vented, and 11.1 per cent was reinjected into oilfields. The remaining 109.3 tcft
contained other gases besides methane, liquid hydrocarbons and water; its methane equivalent
was 104 tcft. Gas production and consumption show similar concentration to oil. One major
difference is that Russia is the foremost producer, consumer and exporter of gas. West European
countries are large importers; they import gas from Norway and the Netherlands, which extract
North Sea gas offshore, as well as from Russia.
World gas reserves on 1 January 2005 were 180 trillion cubic meters or 6300 trillion cubic feet; 70
trcm or 39 per cent of them were offshore. Two-thirds of them belonged to three countries –
Russia (26 per cent), Iran (15 per cent) and Qatar (14 per cent). Apart from natural gas, there are
estimated to be 100-260 trcm of coal-bed methane, 402-442 trcm of tight gas (gas trapped in


                                                      7
dense sands), 42-45 trcm of shale gas and 13,000-24,000 trcm of hydrates (methane trapped in
frozen water molecules)1 .
These, in brief, are the production and market structures with which the Indian oil industry is
necessarily connected because of its dependence on imports of crude as well as refined
products. Oil production is extremely unequally distributed. Oil importing countries have to get oil
from producers since the international wholesale market is not large enough to supply large
consumers. Oil production is extremely unequally distributed, and oil exports even more so. The
only countries with sizeable surpluses of oil are those in the Middle East – Saudi Arabia, Iran,
Kuwait, Bahrain, and when its oil production facilities are restored, Iraq – and Russia. North Sea
Oil, extracted by Norway, Britain and Netherlands, is mostly consumed within Western Europe;
and Canadian and Mexican oil goes to the US.
There is no single market in oil. There are three types of oil distribution arrangements.
First, there are oil markets in the US and Western Europe where common crudes of those
regions are traded. Here the pricing is competitive, although some of the suppliers’ market share
is large. Next, considerable quantities of oil are sold through contracts of varying lengths. Prices
would normally not vary in the life of these contracts, but they would in the long run take market
prices as the benchmark. Many contracts provide for revision of prices depending on a change in
international market conditions. Finally, a certain proportion of oil is allocated by governments at
prices of their choice; these prices may or may not be aligned to international market prices.
India, like all big oil consumers, has enough refining capacity (Appendix-table B4). But since the
output pattern of refineries seldom matches domestic consumption patterns, there have to be
some exports and imports of refined products. As will be explained later, policy-induced
distortions force export of some refined products for which there is a market in India – even some
that are imported (Appendix- tables D2 & E2). And India has the choice of importing refined
products instead of crude. So there are both imports and exports of refined products.


1
 Armelle Saniere (2006): Gas reserves, discoveries and production. Panorama 2006. Institut Francaise du
Petrole, Reuil-Malmaison, France.
www.ifp.com/content/download/56056/1266306/version/3/file/IFP-Panorama06_05-
ReservesDecouvProd-VA.pdf


                                                   8
IV Indian Oil Industry
As in the US, China and Iran, oil seeped out of the soil in India as well; British travelers in Assam
reported such pools from 1825 onwards. Once fractionation technology was proved in the US,
industrial refining of oil became feasible. Assam Railways & Trading Company Limited was
registered in London in 1881 to exploit Assam’s natural resources. It struck oil in exploitable
volume near Digboi in 1889; at that point it transferred its oil interests to a separate company,
Assam Oil Company. AOC built a refinery in Digboi in 1901. AOC was taken over in 1917 by
Burmah Oil Company, which later became Burmah Shell and then Shell. Expanded and
modernized a number of times, the Digboi refinery continues to function till today.
In 1938, AOC took a prospecting licence for 6,290 square miles in Assam. it ceded the
concession after the War started in 1939, and resumed it in 1947. AOC struck oil in Naharkotia in
1953. By that time, however, the government of India had become paranoid about foreign
ownership of business; there was a long standoff between it and AOC over the exploitation of the
new oilfield. Finally in 1959, AOC and the government set up Oil India Limited, a 67:33 joint
venture, to exploit the Naharkotiya oilfield; in 1961 it became a 50:50 joint venture.
Apart from the small refinery in Digboi, India did not produce refinery products when it became
independent in 1947; it depended almost entirely on imports, mostly from Anglo-Iranian Oil
Company’s refinery in Abadan. Three companies sold the products through their distribution
networks – Burmah Shell, Standard Vacuum and Caltex (now merged into Shell, Exxon and
Chevron respectively). Burmah Shell was the largest, with an almost 50 per cent share of the
market.
In December 1953, the Indian government entered a 25:75 joint venture with Standard Vacuum
for survey of 10,000 square miles in West Bengal. The company did some gravimetric and
seismic surveys, and drilled seven holes. It found some gas in some which it considered non-
commercial; it did not find any oil. The general impression was that Standard Vacuum put little
effort into prospecting in West Bengal. This could have been due to the incentive structure.
Standard Vacuum had access to cheap crude from the Gulf; if it found oil in India, the government
would force it to exploit it. Its cost was likely to be higher, and the company would either have
earned lower profit margins or the government would have had to protect domestic refining;
Standard Vacuum would have had to negotiate the level of protection.
The negotiations between Standard Vacuum and the government on the refinery threw up a large
number of issues, many of which are relevant to the policy context today. 2 The following are
important.
    1.       The company wanted a guarantee against nationalization for 30 years, later reduced
             to 25.
    2.       It wanted freedom to import crude. The implication was that it did not want to be
             forced to use domestic oil or oil that the government negotiated access to.
    3.       It wanted freedom to distribute its refinery products. It wanted to use its own
             distribution network to sell the products, and did not want to be forced to distribute
             through other networks, government’s or otherwise. Price fixing is anterior to
             distribution; the company also did not want price control. It would price its refined
             products at landed cost of imports (including duty). Import parity would be with
             Mexican oil and products, not Middle Eastern. Import parity was understood to place
             a ceiling on prices.


2
 A detailed if rather partisan summary of the negotiations between the government and the oil companies –
principally Standard Vacuum – is given in H N Kaul , K D Malviya and the Evolution of Indian Oil, Allied
Publishers, Delhi.


                                                   9
4.       It wanted free access to foreign exchange for all practical purposes – crude, freight,
            equipment, services, dividend remittance, including crude and services bought from
            its foreign operations – to be valued at international prices.
   5.       It wanted no import duty to be charged on crude and on equipment not produced in
            India. There was an import duty on diesel oil; wharfage rates too were such as to give
            some protection. The company wanted that these levels of protection would not be
            reduced. It wanted an import duty on petrol equal to the excise duty plus 12 Paise per
            imperial gallon. Import duties applicable to the company should be no lower than
            those applicable to its competitors.
   6.       The tankers that brought in crude should be allowed to be used for coastal
            distribution of refinery products.
   7.       There should be no restrictions on local borrowings for equipment, construction and
            inventories.
   8.       Its capital investment would be given 10 per cent straight-line depreciation in the
            calculation of income tax.
   9.       The company wanted exemption of the Industrial Development and Regulation Act of
            1951, which gave the government the authority to control industrial production,
            expansion and diversification. The government agreed; but Shell and Caltex did not
            get this assurance.
The government also wanted a number of things.
   1. It wanted Standard Vacuum to set up a local subsidiary to build and run the refiner.
        Standard Vacuum was against it for three reasons: (1) The subsidiary would be subject to
        income tax; (2) it would have to pay sales tax on whatever refined products it sold to the
        distribution company; and (3) if the government placed controls on dividend payments,
        the subsidiary would be subjected to them. But eventually it did agree to set up a
        subsidiary. The government wanted the local subsidiary to issue shares to local
        shareholders; it issued a quarter of its capital of $6 million to them in preference shares.
        The other two companies issued non-voting shares to local shareholders.
   2. Should India discover oil, the government wanted the Company to promise to use it in
      preference to imports. The company agreed; price was unspecified.
   3. The government reserved the right to impose and vary excise duties, but promised to
      maintain the existing differentials between excise and import duties. In other words, if it
      imposed or increased an excise duty, it would increase import duty by at least that much.
   4. The government wanted the company to train and employ Indians.
   5. The government had agreed at independence to continue pooling dollars with the
        Commonwealth; at the same time, the British government owed it a large debt, termed
        sterling reserves, for supplies during the War. So it wanted Standard Vacuum to buy
        crude and other importables from the Sterling Area as far as possible. The company
        agreed, since AIOC, the company that produced oil in Iran and Kuwait, was British and
        would accept Pounds.
   6. In the event of the government acquiring tankers, it wanted the company to use them in
        preference to other tankers. The company agreed, subject to the use of its own tankers
        and prior contractual commitments.
   7. The government wanted the company to give priority to local purchases over imports; the
      company agreed.
The negotiations continued for three years, but no agreement emerged. The oil companies
prevaricated. The government suspected that the oil companies were happy with the import of


                                                10
refined products from Abadan refinery, which they sold in India at certain and high profits. But
after Iran nationalized the Abadan refinery in May 1951, India looked a safer country to operate
in. In November, Standard Vacuum signed an agreement with the government to set up a
refinery. Burmah Shell and Caltex followed in the next two years. Esso’s 25,000 bpd refinery was
inaugurated in Bombay in 1954, Burmah Oil Company’s 30,000 bpd refinery went onstream in
Bombay in 1955, and Caltex’s 10,000 bpd refinery went up in Vizagapatam in 1957.
The government was frustrated with the experience of negotiations with the three oil companies.
In the 1950s, the government took a number of steps to reduce dependence on foreign oil
companies. In 1956, it set up Oil and Natural Gas Commission to explore for oil, and brought in
Soviet and Rumanian rigs and crews to prospect for oil. The two areas chosen were the Cambay
area in Gujarat and the Jawalapuri-Janaur area in what is now Himachal Pradesh. The Soviet
crew considered Gujarat more promising, and drilled there first. The first well was spudded on 25
July 1958; on 24 September it struck oil under 150 atm pressure at 7000 feet. Further exploratory
drilling led to the discovery of Ankleshwar and Kalol oilfields in 1960, and suggested that the oil-
bearing strata extended offshore to what came to be known as Bombay High. Oil from this area
was the foundation of ONGC’s emergence as an oil producer. Gas too was found in and off
Gujarat, both associated and non-associated.
In 1984, the government separated ONGC’s gas business and gave it to a separate subsidiary,
Gas Authority of India Limited (GAIL). GAIL built a pipeline from Hazira on the Gujarat coast to
Delhi, and supplied gas to government-owned power stations and fertilizer plants on the way. It
also set up joint ventures with government oil companies and state governments to supply gas to
Bombay and Delhi for transport and domestic fuel, and to Andhra Pradesh for transport. In 1987 it
set up Petronet, a joint venture with three other government oil companies, to import LNG from
Qatar. Pricing and distribution of public sector gas are entirely decided by the government; there
is no element of market in this area.3
The Soviet surveys had shown the oil-bearing structures of Gujarat extending into the sea in
1964-67, but the Soviets did not have the technology for offshore exploration or production. In
1974, a Japanese survey ship leased by ONGC discovered the prolific Bombay High offshore
field. It has been the mainstay of ONGC’s business since then.
Once oil was discovered in Gujarat, the government had to think about how to exploit it. In 1958,
it set up Indian Refineries to set up refineries. In 1959, it set up Indian Oil Company to undertake
distribution. The two were later merged into Indian Oil Corporation. IOC was given a monopoly of
imports of refinery products; with that, it soon overtook the three foreign companies in distribution.
Thus the foundations of the government-owned oil industry were in place by 1961.
A 2mtpa refinery to process Gujarat crude was built with Soviet help in Koyali, Gujarat in 1966.
But Gujarat crude could not meet the growing national demand. So in the 1960s, the government
took to building coastal refineries in joint ventures with foreign companies. The 2.5 mtpa Cochin
refinery came up in 1966 with investment from Phillips Petroleum, the 2.5 mtpa Madras refinery
went on-stream in 1969 with participation from AMOCO and National Iranian Oil Company, and
the lubricants plant of Lubrizol India came up in Bombay in 1969 with participation of Esso.4
In 1960, US President Dwight Eisenhower introduced oil import quotas favouring Mexico and
Canada and discriminating against Middle Eastern producers and Venezuela. This upset the
latter. In September 1960, Iraq, Iran, Saudi Arabia, Kuwait and Venezuela got together to
“coordinate” policies and formed the Organization of Petroleum Exporting Countries. The
organization was just a talking club for ten years. But in 1970, OPEC resolved to raise its
members’ share of oil revenue to 55 per cent, and began negotiations with oil companies to effect
the increase. There followed a spate of measures by which Middle Eastern oil producing
countries nationalized or imposed revenue shares on oil producing companies, or cancelled
concessions. Oil concessions were nationalized by Algeria in 1971, Iraq in 1972 and Kuwait in

3
  Cf Mike Jackson (2005): Natural gas sector reform in India: case study of a hybrid market design.
Stanford Program on Energy and Sustainable Development. Working Paper 43, July.
4
  C S Venkataratnam and Anil Verma, Challenge of Change, Allied Publishers, Delhi 1997.


                                                 11
1976-77. Libya nationalized a number of oilfields held by foreign companies between 1971 and
1976, and took an 85 per cent share onshore and an 81 per cent share in the oilfields of others.
(Iran had nationalized the British-owned Anglo-Iranian Oil Company in March 1951.) The Saudi
King threatened Arabian American Oil Company (Aramco) with nationalization with 1950 and got
a half-share in profits. He acquired a 25 per cent share in Aramco in 1973, increased it to 60 per
cent in 1974, and took full ownership of the company in 1980. Kuwait nationalized its oil industry
in 1975, Bahrain took a majority share in its concessionaire oil company in 1980.
After the 1967 war between Israel and Palestine, Arab members of OPEC formed Organization of
Arab Petroleum Exporting Countries. Israel defeated Egypt and Syria in the Yom Kippur war in
1973. Enraged, OPEC raised the price of its crude from $3 to $12 a barrel, and made it effective
by cutting supply. After this, oil producing countries realized that they could raise their revenue
by raising the price of their crude. So they started increasing prices without coordination.
While the nationalizations of the 1970s did not immediately disrupt the relationships between oil
producing countries and their licensee foreign companies, they introduced extreme uncertainty in
the companies’ business environment. Their attempts to cope with this uncertainty changed the
world oil industry in three major ways.
    1.   The companies began to explore for oil in more difficult environments such as the North
         Sea, Gulf of Mexico, and the Caspian Sea. Exploration in these fields was more
         expensive. So smaller companies failed or were bought up; the industry got more
         concentrated.
    2.   The governments of the US and Britain did not control oil produced in their jurisdictions
         in the way the Middle Eastern oil producers did. So oil produced in Texas, Gulf of
         Mexico and the North Sea began to be traded on commodity markets. For the first time,
         an open market in crude emerged. Quotations for crude such as Brent
    3.   Till the 1970s, refineries were tailored to a single crude source, and generally produced
         a limited set of products. The uncertainty of crude supply led refiners to design or modify
         refineries to take a broader variety of crudes and make a greater range of products. Not
         all refineries did; refineries are quite durable, and many refineries remained unchanged.
         Many closed down. But catalytic cracking technology developed to make refining more
         flexible.5
As oil producing countries increased their share of profits and oil at the expense of foreign oil
companies, the oil supplies they controlled went up and those of oil companies went down. In the
circumstances, the main reason for having foreign oil companies operate refineries in India –
namely, their access to crude – disappeared. In 1976, India nationalized the three refineries
owned by Shell, Caltex and Esso. In 1981, the government bought out Burmah Oil’s 50 per cent
stake in Assam Oil Company. With the nationalizations, the entire Indian oil industry passed into
government hands, and came to be run as a part of the government.
 In 1977, the government introduced an Administered Price Mechanism, to be operated by an Oil
Coordinating Committee. The ministry of petroleum fixed so-called retention prices designed to
give oil producers 15 per cent and refiners 12 per cent on their net worth. And it set administered
prices at which products were sold to consumers. The difference between the revenue and dues
of an oil company went its account with OCC. So overall, the price level was cost-plus; but the
government could cross-subsidize individual products at will.
It was the oil companies’ practice to construct their own petrol pumps and give them to dealers to
run. Under the private companies, dealerships were given to trusted associates, and they
became a part of the companies. After nationalization, the government decided to set up a fairer
system. In 1983 it set up four Oil Selection Boards; each board had a retired judge and one other
member. An SC/ST member was added in 1993. Oil pumps made good profits with little
investment on the part of the dealer and at low risk. So many more people wanted pumps than
5
 Jerome Davis, The Changing World of Oil: An Analysis of Corporate Change and Adaptation. Ashgate,
London, pp 1-10.


                                                12
could get them, and recommendations and corruption were rampant in their allocation. In January
1996, a PIL led to a court enquiry, which revealed that the personal assistant of Satish Sharma,
the petroleum minister, got oil companies to give pumps to relatives and friends of politicians, and
charged others money. The same scandal continued under the ensuing BJP government, and
blew up in 2002; Prime Minister Vajpayee cancelled all the 3850 allotments made in the previous
two years. There has been no public scandal since then, but that does not necessarily mean that
the system works any better now.


                                                13
V     Competition in Exploration
From 1979 onwards, the ministry of Petroleum began to invite international bids for exploration
and development from time to time. Nine rounds of bidding were held till 1997; 32 blocks were
awarded for exploration and 30 for development. In 1997 they produced 3 mtpa of crude and 7
mcmd of gas. But since refining and distribution were government monopolies (Appendix-table
B1), the licensees had to sell their oil and gas to the government. Negotiations with the
government were protracted and involved each time. So the rounds attracted little international
interest. In the meanwhile, the government monopolies could not increase production and refining
capacity to keep up with demand (Appendix-table A2). Between 1985-86 and 1995-96, the
import ratio went up from 31 to 44 per cent for crude and from 7 to 27 per cent for refined
products.
The policy of government ownership and control of oil was a part of a socialist approach which
applied to all economic policies. These policies became discredited when a serious balance of
payments problem arose in 1989-91; a new government elected in 1991 overhauled many of the
policies. It appointed two committees in 1994-95: one under the chairmanship of U Sunderarajan
was asked to examine replacing administered by market-determined prices, and a strategic
planning group on restructuring of the oil industry (R Group) was asked to look at the structure
and organization of the industry. The story of which of their recommendations influenced policy
and how far is convoluted; but the government made the following major policy changes.


                                                   Fig 1 Oil output and imports

                        180

                        160

                        140

                        120
         Million tons


                        100
                         80

                         60

                         40

                         20

                          0
                         1972-73 1976-77 1980-81 1984-85 1988-89 1992-93 1996-97 2000-01 2004-05

                                    Crude output    Crude imports   Product output   Product imports


The government announced a New Exploration Licensing Policy in 1997, which differed from the
old one in the following respects.6
                        1     Bidders were to compete on cost recovery – they could ask for up to 100 per
                              cent – and on their share of profit petroleum.
                        2     They were free to sell their share of the oil to anyone within the country.


6
  R K Narang, Ardhendu Sen and Leela Srivastava, Background paper: Issues in deregulation of oil and
gas. In Leela Srivastava and S K Sarkar, Transition to a Liberalized Environment: Experiences and issues
in Liberalization, Teri Press 1999, pp 411-426.


                                                               14
3      Conditions regarding minimum expenditure, required partnership with
                   government oil companies, and signature, discovery and production bonuses
                   were scrapped.
            4      Tax provisions were defined, and their stability promised. There would be a 7-
                   year income tax holiday, exemption from customs duty on exploration and
                   drilling equipment, royalty was fixed at 10 per cent except for onshore crude
                   which would pay 12.5 per cent, 5 per cent royalty on discoveries in water
                   deeper than 400 meters, and development expenditure could be amortized
                   over 10 years.
            5      The licence could be assigned to third parties under conditions.
            6      A Conciliation and Arbitration Act passed in 1996, based on the model set by
                   United Nations Commission on International Trade Law, would apply to
                   disputes.
            7      Bidders were required to give the Directorate of Hydrocarbons, which was set
                   up in 1993, the results of their surveys; in case they abandoned the
                   concession, the results would become available to subsequent bidders.
Under the New Exploration Licensing Policy, six rounds were held and 162 production-sharing
licences were given till 1 April 2007, against 28 before the introduction of NELP. Of the licences,
77 per cent were offshore, and 53 per cent were to government companies. The sedimentary
area explored went up from 50 per cent in 1995-96 to 85 per cent in 2006-07 of the total 3.14
square kilometers (1.79 million onshore and up to 400 meters offshore, 1.35 million deep-water
beyond 400 meters). Well explored area went up from 15 to 20 per cent, poorly explored area
from 17 to 21 per cent, and area being explored from 18 to 44 per cent. These figures suggest
that many licensees were sitting on concessions because they did not see a satisfactory path to
profitable exploitation of discoveries, or were negotiating such a path.
A seventh round of NELP was opened on 1 April 2008. In July, six multinational companies
(Chevron and Conoco-Philips of the US, Britain's BG (British Gas) and BP (British Petroleum),
Canada's Niko and Anglo-Dutch Shell) wrote to the government to say that they would not bid if
the regulatory framework remained uncertain and the government did not adhere to contractual
arrangements. Instances of such were (1) the Enron affair, in which Maharashtra government
reneged on a contractual obligation to buy electricity at a fixed price (it was saved from litigation
by Enron’s liquidation on account of fraud committed by the company in its home country, US),
(2) the government’s taking away the contractual right of the owners of the Panna-Mukta fields –
Reliance, British Gas and ONGC – to sell gas, and forcing them to sell it to GAIL at a price of its
choosing to GAIL (the exploration contracts embodied freedom of sale and pricing), and (3)
DGH’s renegotiation of conditions embodied in the model production sharing contracts issued at
the time of announcement of earlier rounds after bidders had invested money and found oil or
gas. The companies were also of the view that DGH, which was supposed to be a regulator,
acted more like an arm of the government. The government did not respond to the six companies’
concerns; consequently, they did not take part in the bids.
In the event, of the 57 blocks on offer, 12 received no bids, and 19 received only one bid. Of the
45 winning bids, one was rejected by Cabinet Committee on Economic Affairs, resulting in 44
production sharing contracts. ONGC and its associates got 20 concessions. Thus, the round
confirmed a decline in interest amongst international companies, especially experienced ones.
There is a more general disincentive to bidding in the fact that the bidders have to sell their
production in India, which remains a market dominated by government companies; it is thus
impossible to be sure that the concessionaire would get an internationally comparable price for
his output. This is particularly obvious in the case of Cairn Energy, which bought a block in
Rajasthan from Shell in 2002 and soon struck oil. The find in Barmer was far from the sea. It
could be sold to Indian Oil Coorporation, but negotiations have not borne fruit till now. The crude


                                                 15
is waxy, and difficult to transport. Cairn has been drilling more exploration wells and raising its
estimate of reserves. Now it is planning to lay a heated pipeline to Salaya and export the crude.

                        Table 2: Oil and Gas Reserves on 1st April 2007
                                                                              (Mtoe)
                                                ONGC      OIL    Others       Total
                 Oil                             4603      815       629       6047
                 Gas                             1820      290       838       2948
                 Oil in place                    6423     1105      1467       8995
                 Oil                             1313      243       172       1727
                 Gas                              982      151       511       1645
                 Ultimate reserves               2295      394       683       3372
                   Source: Directorate of Hydrocarbons


It is also probably true of Reliance, which first struck oil in Krishna-Godavari basin offshore, and
later gas as well. In 2006, Niko Resources whom Reliance had called in as consultant estimated
gas reserves at 1 trillion cbm. Reliance tried to sell the gas to power utilities on the south and east
coast, but failed to reach agreement over the price. The power utilities are owned by state
governments and make heavy losses. So their ability to pay is in doubt.
Thus, private entry was allowed in oil exploration and production in the 1980s, and private firms
have discovered substantial oil and gas resources. But none has used them to enter domestic
refining and distribution. This is because deregulation of the downstream industries has not kept
pace with that of exploration.
Exploration and production costs vary enormously according to the location and depth of
hydrocarbons and the size of reserves. There is a suggestion that the absence of competition
makes it possible for the oil concessionaires to take bribes from suppliers of equipment and
services in return of overpayments and. to overestimate investment costs. The chief safeguard
against this possibility is The Directorate of Hydrocarbons, whose block management committee
approves all field development plans. When it awards E&P contracts, it looks at both costs and at
the technological capacity of the applicant and his ability and willingness to save time, do a
thorough exploration and bring reserves into production. Besides its own expertise, its
comparison of competing bids would help it make a judgment on individual proposals. The
expertise it acquires in evaluating bids should give it capacity to supervise PSUs’ activities also. It
is authorized to hire outside experts and consultants when necessary.
A suspicion that ONGC’s costs had been padded arose in 2006. In April 2007, the allegation that
Reliance Industries padded costs was made by the Communist Party of India (Marxist). ONGC
pointed out that DeGolyer and McNaughton, an outside consultant, did a third-party audit of all its
projects. Reliance got a third-party audit done by Gafney, Cline and Associates when the original
discoveries were made, but was asked to get a new audit done.
There are two other authorities that check the proposed costs of public enterprises. They would
be approved by the parent ministry. It does not have the expertise to make an informed
examination; but that does not prevent it from examining the costs. It is also within its purview to
take the help of international experts. The other is the Comptroller and Auditor General. He only
makes an ex post examination long after the costs are incurred. He reports to Parliament, which
can make the government take action on his report. Parliament committees obtain a reply to
CAG’s findings from the government, but there is no further action. Thus the safeguards within
the government against overstatement of costs are not very effective.
What is crucial here is that there should be multiple competitors for concessions. This requires
expertise in formulating invitations for exploration contracts. From the fact that most exploration
contracts have gone to a handful of Indian companies – mostly government, some private – it can
be inferred that there is little competition for them. The reasons are also clear: that the
government restricts the discoverer’s right to sell any oil or gas he finds in the world market, and


                                                     16
that the dominance of public sector undertakings in the domestic refining industry makes it
impossible for a discoverer to get a fair market price for his oil. Hence if there is padding of costs,
it is due to the restraints on competition placed by the government of India.


                                                  17
VI Competition in user Industries
A major entry barrier into oil refining and gas is lack of competition in major markets for refined
products. Government dominance of user industries and the losses it forces them to make limit
their capacity to pay internationally comparable prices. Some of the user firms also suffer from
endemic liquidity problems on account of their poor profitability, and delay payments for
feedstock. Two such industries are important: electricity, which in other countries is an important
market for gas and furnace oil, and fertilizer, whose preferred feedstocks are gas and naphtha.
Overstatement of costs is not very effective.
The electricity industry is dominated by electricity boards, which are essentially departments of
state governments and have no operational freedom. The prices they charge are decided by the
governments, and are fixed at unremunerative levels. As a result, they depend for investment
funds on state governments, which are themselves in no great financial shape. Owing to their
unprofitability, they are often short of liquidity and delay paying suppliers of fuel. Till 2004, they
had run up enormous debts to coal and oil companies. Then the central government forced state
governments to settle the debts as part of more general financial strengthening. The centre has
the power and influence to force state governments to pay. Private companies would not be able
to do so. Hence the electricity boards remain unpromising customers for gas or furnace oil
produced by private companies.
The centre tried to break this impasse by passing the Regulatory Commissions Act in 1998. It
appointed a Central Electricity Regulatory Commission and persuaded a number of states to set
up then own ERCs. It also passed a new Electricity Act in 2002 which envisaged introduction of
competition from the private sector. Under its persuasion, a number of states corporatized their
electricity boards and separated generation and distribution. But despite all this activity, electricity
pricing practices did not change. Electricity boards continued to be financially weak and hence
poor customers for hydrocarbon products. As long as they remain unable or unwilling to pay,
enterprises of the central government, in gas, oil and electricity, will have an advantage in
collecting their dues from state electricity boards as against any private competitors that may
come up.
The fertilizer industry produces nitrogenous, phosphatic, compound and mixed fertilizers. Of
these, only nitrogenous fertilizers require hydrocarbon feedstocks; the normal feedstocks are gas
and naphtha, which are first converted to ammonia and then into its compounds. Phosphatic and
complex fertilizers were decontrolled in 1992, and nitrogenous fertilizers with low nitrogen content
in 1994. But urea, which constitutes 85 per cent of nitrogenous fertilizer consumption, remains
under control. It is administered by the Fertilizer Industry Coordination Committee, which is
constituted entirely of central government secretaries except for two representatives of private
plants.
FICC operates a retention price scheme. It collects output and cost figures from all plants, adds
12 per cent return on capital, and thereby arrives at the total realization required. It divides the
realization by the nitrogen output to get nitrogen price, which is then used to derive the prices of
various fertilizers. The difference between the prices and the costs is given to plants as subsidy
or taken away as tax. A similar exercise is done to calculate total transport costs to the farmer,
which are then so distributed between plants that farm gate price of urea is the same across the
country.
While input costs rose, the ministry of fertilizers has hesitated to raise prices. The result is that it
is paying an enormous fertilizer subsidy. To keep the subsidy down, it has endeavoured to keep
input prices as low as possible. This is one reason why the government has tried to commandeer
gas supplies from private producers and reneged on the freedom of pricing promised to them.
The domination of the electricity and the fertilizer industries by the central and state governments,
the losses they make and the consequent pressure to keep input prices low make the two
industries unattractive as customers. This is not so material to public enterprises whose losses
are borne by the government, but their ability to bear losses gives them an advantage against


                                                  18
power plants, and discourages private investment in hydrocarbons. Unless electricity and fertilizer
markets are decontrolled, this handicap of private hydrocarbon firms cannot be removed.


                                                19
VII Competition in Refining Industry
Refinery licences were given to the Birla group (jointly with Hindustan Petroleum Corporation, a
subsidiary of IOC) in 1988, the Essar group in 1993, and Reliance Industries in 1996. The Birlas’
Mangalore refinery was ready by 1999; it could not be started because HPC, whom the Birla
group had taken in as partner for its access to market, refused to lift the products. Finally the Birla
group sold off its 37.38 per cent stake to ONGC in 2003. The first phase of the Reliance refinery
in Jamnagar was ready in 1999. Although Reliance got a licence for petrol pumps in 2002, it has
sold only a small proportion of its petrol and diesel output through pumps; it has exported the
bulk. In 2007, it sought and got 100% EOU status. It gave Reliance duty-free access to crude
provided it balanced its total imports and exports. The Ruias’ Vadinar refinery went onstream in
November 2006. The delays were partly due to their legendary lack of finance; but they were also
not in a hurry because they could not work out a feasible marketing strategy. Distribution has
handicapped growth of private refining, and hence emergence of competition.
On 1 April 2002, the government announced the abolition of the Administered Price Mechanism
and of the Oil Coordination Committee which administered the price controls. It introduced direct
subsidies on kerosene and LPG (Appendix-table H1), and raised taxes on petrol and domestic
crude (Appendix-table G7). The petroleum ministry issued retail distribution licences to ONGC,
GAIL, OIL, Reliance Industries, Mangalore Refineries, Essar Oil and Cairn Energy. Of the
licensees, only Reliance and Essar opened a significant number of pumps (Appendix-table F3).
Reliance set up pumps which were shopping centres at the same time. On the highways, they
also offered food, accommodation and baths to truck drivers. They sold 410 kiloliters a month on
the average in 2005-06, against public sector outlets which sold 140 kilolitres. So although they
had only 1432 outlets out of the total 30,000, their share of retail sales was close to 14 per cent
(Appendix-table F1).
Then, on 27 March 2007, Reliance applied for the status of a 100% export-oriented unit; it got
that status in February 2008. In 2007-08, its exports came to 60 per cent of its sales. On 24
March 2008, Reliance announced that it was closing down all its petrol pumps. The reason was
that the government was subsidizing petrol and diesel sold out of its companies’ pumps, but did
not give the subsidies to private competitors. So retail sales were no longer profitable for
Reliance. Essar did not take a public decision to close down pumps; it simply stopped regular
supplies to its pumps. As Table 3 shows, its sales in 2007-08 were insignificant relatively to the
market. Thus as from May 2008, retail sales of petrol and diesel oil are a government monopoly
(Appendix- table F2); there is no competition.
One consequence of this lack of competition was the recurring shortage of diesel oil in Tamil
Nadu between May and August 2008, when Reliance was exporting it at the same time. Reliance
had no petrol pumps any more, so it could not have supplied the market. It could have sold diesel
to public sector oil companies, but then it would have breached the conditions of its EOU status.
The EOU category, introduced into the trade policy in the 1960s, has outlived its usefulness.
While it is reasonable to exempt exports from domestic taxes, there is no reason to make that
exemption conditional on minimum exports. It is not certain whether the segregation of exporters
and domestic producers was useful when it was tried first; it has outlived its usefulness, and in
the Tamil Nadu diesel crisis it proved counterproductive.


                                                  20
VIII     Competition in Gas Industry
Automotive fuels have to be reached to vehicle owners; hence oil refining companies cannot do
without access to a marketing network. Gas, however, requires an expensive transport network in
the form of pipelines; hence gas producers prefer to sell to as few consumers as possible, and
prefer large buyers. Where gas has been available beyond industrial needs, it has been piped to
households; but such domestic networks have been confined to cities. Unless pipelines of
different suppliers get interconnected, there is no competition between them; each has a
monopoly of supply to the customers connected to its pipeline. There is only one common carrier
pipeline network in India. It has been built by Gujarat State Petroleum Corporation through two
subsidiaries – Gujarat State Petronet, whose pipelines connect the cities of Gujarat, and Gujarat
Gas, which lays retail connections within the cities.
It transports supplies from three sources to Bombay and cities of Gujarat: liquefied natural gas
from Qatar that Petronet brings into Dahej, gas supplies from Gujarat Gas, a British Gas
subsidiary, which in turn buys gas from ONGC and sells it across Gujarat, and GAIL’s sales in
Gujarat.
GAIL was incorporated in 1984 to evacuate associated gas from ONGC’s Gujarat oilfields. Its
most important gas pipeline is the Hazira-Vijaypur-Jagdishpur pipeline of GAIL which carries
ONGC’s gas output from Gujarat to a series of power and fertilizer plants from the Gujarat coast
to Punjab. As its gas supply ran short, it also started taking Petronet’s gas imports from Qatar.
Assam Gas Company, which is owned by the government of Assam, supplies gas to a fertilizer
plant, a petrochemical plant, four power stations, 250 tea gardens, 400 industrial establishments
and 20,000 domestic consumers.
Reliance, which found considerable gas offshore in the Krishna-Godavari field starting in 2003,
has not laid pipelines to evacuate the gas because it has not yet finalized customers. As shown in
Chapter VI above, the two industries that are major potential customers, electricity and fertilizers,
are owned by the central and state governments. Most of the enterprises in them make losses
which are financed by governments; it would be impossible for new private plants to compete with
these plants. Since these markets are closed, the only feasible option for Reliance is to sell its
output to GAIL at whatever price it can get, and let the government distribute it to plants of its
choice.


                                                 21
IX Conclusion
In 2007-08, India’s five largest companies in terms of sales were oil companies. Four out
of five were owned by the government. The sales of the sixth – Essar Oil – were
negligible. Reliance’s share of sales was 17 per cent of all the oil companies’ sales, but
60 per cent of its output was exported. So it does not require much analysis to conclude
that the Indian oil industry is an oligopoly, and that it is dominated by government firms
(Appendix-table F1). The retail market for petrol and diesel is almost entirely a
government monopoly. This monopoly also affects exploration and production, for as we
have seen, a number of companies that have struck oil or gas cannot find a domestic
market because of the government’s monopoly of distribution. How can this situation be
changed, and competition be introduced?
                       Table 3: India's oil companies' revenues, 2007-08

                              Company                    Rs billion     Per cent
                  Indian Oil Corporation                       2015            34.7
                  Reliance Industries                          1112            19.2
                  Bharat Petroleum                              972            16.8
                  Hindustan Petroleum                           939            16.2
                  Oil and Natural Gas Corporation               755              13
                  Essar Oil                                       6             0.1
                   Total                                       5799            100
                 Source: Company annual accounts.

The domestic market is close to a monopoly. All hydrocarbon products are tradeable, although
their transport costs vary greatly – highest for gas, lower for crude, and the more valuable a
refined product, the lower proportionally are transport costs. So the most expeditious way of
introducing competition is freeing imports. There cannot be competition in exploration and
production if refining and distribution are concentrated; and there cannot be competition in
refining unless crude is freely importable. Hence the first condition for a more competitive market
is absence of restrictions on foreign trade.
The next condition is tax parity of imports and domestic production. This means that whatever
domestic taxes are levied should be applicable to imports as well. Import duties may be levied;
but unless there is a reason to protect exploration and production beyond the size to which they
would grow without protection, crude imports should be duty-free, so that there is maximum
incentive to invest in refining. There will inevitably be taxation of refined products, since some of
them are considered inputs into luxuries (e g, aviation fuel and petrol), and are in fact sources of
prolific revenue. Duties on domestic production must be matched by equal import duties, so that
there is no discrimination in favour of exports.
Under competitive conditions, refining adds little value to crude. The tonnage of refined products
comes to 90-95 per cent of the crude input; and the throughput of a refinery is so high in
comparison to its capital costs that a low average profit margin gives a high rate of return. In
2007-08, a profit margin before tax of 16.7 per cent translated into a return on assets of 15.5 per
cent for Reliance; for IOC, a margin of 3.9 per cent translated into a return on assets of 12.3 per
cent. IOC was forced by the government to give huge subsidies on sales of petrol, diesel and
kerosene (Appendix-table H1); on the other hand, its refineries are older and their historical cost
per ton is lower. But even for a highly sophisticated refinery like that of Reliance, the capital-
output ratio is close to one; for simpler refineries it would be much lower, and the return on capital
would be higher than the margin. Typically, a refinery’s margin might be 10 per cent, and crude
might account for 80-90 per cent of its costs. Since some refinery products are considered
luxuries and others necessities, taxes on them will be different; and the average tax on refined
product will be high. In the circumstances, the tax system can be simplified and competition in
refining intensified by not taxing crude at all, and concentrating all taxation on refined products.


                                                    22
Finally, we come to entry restrictions. Here, the answer is different for exploration and production,
and for refining. We shall deal first with exploration and production, but it should be borne in mind
that the attractiveness of exploration is closely dependent on the ease of entry in refining and
distribution.
It is difficult to conceive of completely free entry into exploration because it involves access to
land which has to be approved and sometimes organized by the government. So some form of
exploration licensing is unavoidable. The high proportion of concessions granted to ONGC would
suggest otherwise, but there is no overt discrimination against foreign companies or exclusion of
any companies other than on such self-evident criteria as minimum experience and minimum
investment. The government’s insistence that discovered oil and gas must be used in India – its
implicit export ban – reduces the potential value of finds and probably leads to fewer bids and
lower revenue for the government; now that the balance of payments is no longer a policy
problem, this domestic use requirement is outdated. We have argued above for duty-free imports
of crude. In those circumstances, an export ban or insistence on domestic use makes even less
sense.
So the only important variable in exploration and production would be taxation of production
(exploration can obviously not be taxed). The customary form of taxation here is that the
government tax a share of the oil produced – what is called profit oil. If profit oil is zero, the
producing company takes all the oil that is produced, and the government gets nothing. The
government must be very desperate to produce oil domestically before it takes zero profit oil. This
is not the situation in India.
At the other extreme, profit oil can be 100 per cent. No oil company would agree to this unless the
government paid all costs plus some profit. So this case really comes to the government
exploring oil. Exploration does not necessarily imply production; a government may explore
simply to get better knowledge of the country’s oil resources. The knowledge would reduce the
risk in production, and would get the government better terms when it does decide to produce. At
present, the government gives companies exploration licences with the condition that the data the
concessionaires collect in the course of exploration must be given to the government; they are
deposited with Directorate of Hydrocarbons. Given the fact that there is no urgency to produce, it
would be a good idea to separate exploration and production; the government should invest
simply in exploration and data collection. When it decides on production, it will then have ready
data to sell to potential bidders; it will get more bids, and better terms.
So much for exploration. However, it is refining and distribution that require reforms to introduce
competition. There is one precondition that is already satisfied and is therefore likely to be
ignored: that product standards should be defined and enforced. Oil products are extremely
differentiated; different uses require different specifications, some require tight specifications, and
non-standardized products can be dangerous in some uses such as aviation. So standards have
to be defined and enforced by the government.
Such standards will be correlated with the earlier-mentioned commodity taxes. In India, the
extreme variation in tax rates creates powerful incentives to pass off a highly taxed product as a
less taxed one, and more often, to adulterate products; for instance, it is common to mix divert
subsidized kerosene and mix it with high-speed diesel oil. The solution adopted has been to put a
dye in subsidized kerosene. That is an ineffective remedy, for the dye does not make kerosene
less eligible for adulteration. The correct solution would be to have the same tax on close
substitutes, and to subsidize the people intended directly.
There is one other condition that would need to be modified. When allowing private entry, the
government has insisted that new entrants must set up a minimum proportion of pumps in
‘backward’ or ‘rural’ areas. Ideally, there should be no such condition; if the government wants
more petrol pumps in certain areas, it must give them subsidies until they reach a certain
minimum turnover. The government has a service tax; it can be applied to petrol pumps, and a
cut-off point may be set below which there would be no tax.


                                                  23
It is possible to introduce competition in distribution alone, without any changes in refining. The
first condition for it would be to abolish licensing of pumps. There is no argument for licensing
except that captive pumps of oil companies have existed ever since they started selling petrol;
there is a strong argument against licensing in India, that it creates rampant corruption, which
reaches right up to the minister.
Second, there should be free imports of products. There should be no canalization of product
imports, and no quantitative restrictions. But distribution requires considerable investment in
storage, logistics and petrol pumps. If competition is not introduced in refining, the only
competition can come from imports; it will not emerge unless new entrants are assured of
continued access to imports for a long period. To ensure a level playing field, domestic tax rates
and import duties should be identical, so that the tax burden is the same irrespective of the origin
of supplies.
This is an argument that applies to all the policy changes suggested here, and not just to taxation.
The oil production and distribution chain requires large capital investments whose life runs into
decades. If the benefits of competition are to be reaped, the policy regime must be stable for
decades, and must in advance be known to be stable. If the government is serious about
competition, it must accept and announce self-restraint on its freedom to make and change
policies.
Finally, transportation affects competition in an important way. For all hydrocarbons, pipelines are
the cheapest medium of transport. Differentiation of refined products makes dedicated pipelines
for them expensive, but even amongst them, petrol and diesel are consumed in large enough
quantities to make piping economical. Currently, all pipelines in India are owned by gas or oil
companies, and thus insulate them from competition. If all the pipelines were common carriers
and carried oil, gas or products for all customers without discrimination at preannounced prices,
refineries and gas-based plants would spread out more evenly across the country, and there
would be greater competition amongst them. The case is similar to that of electricity, in which
there cannot be competition for the final market unless a transmitter and distributor provides
access from every generator to every consumer. One solution that was tried out was to decree
that all companies that had pipelines would allocate a certain proportion of pipeline capacity for
common carriage. As far as we know, this regulation was a dead letter from the start; there has
been no common carriage in India. The best solution now would be to nationalize all existing
pipelines and give them to a new company to run as a public utility on a cost-plus basis. The next
best solution would be to give all the pipelines of state-owned companies to a common carrier. In
gas in particular, competition cannot emerge in the absence of a common carrier.
The conclusions we have reached have implications for the Competition Commission. The oil
industry has a regulator of sorts in Directorate General of Hydrocarbons. It provides expertise that
the ministry lacks and buys such expertise as it does not have (or makes oil companies buy it).
But it confines itself to technological issues and avoids the economic issues discussed above;
and on policy it keeps close to the government and does not choose to take an independent view.
This is where a role for the Competition Commission is inescapable. It is for the Competition
Commission to decide at what level to frame its interventions. Quite a few of government
obstructions to competition that are found in the oil industry are present in other industries as
well; the Competition Commission would have to take a view on whether to take an industry-
specific approach or to take up more general issues of policy. Either way, there is a role that only
the Competition Commission can play.


                                                ***


                                                24
Data Appendix

Petroleum Statistics

A.      At a Glance

                    Table A1: Growth of Indian Petroleum Industry at a Glance

                                   2000-0   2001-0    2002-0   2003-0    2004-0    2005-0
      Item              Unit         1        2         3        4         5         6       2006-07*
1. Reserves!
(Balance
Recoverable)
(i) Crude Oil        Mn. Tonne        703      732       741      733       739       786        756
                     Bn. Cub.
(ii) Natural Gas     Mtr.             760      763       751      854       923      1101       1090
2.
Consumption
(i) Crude Oil (in
terms of
refinery crude
throughput)          Mn. Tonne     103.44   107.27    112.56    121.84    127.12    130.11     146.55
(ii) Petroleum
Products
(excluding
RBF)                 Mn. Tonne     100.07   100.43    104.13    107.75    111.63    113.21     119.55
3. Production
(i) Crude Oil        Mn. Tonne      32.43     32.03    33.04     33.37     33.98     32.19      33.99
(ii) Petroleum
Products             Mn. Tonne      95.61      100    104.14     113.4    118.23    119.75     135.26
4. Imports &
Exports
(i) Gross
Imports
(a) Qty : Crude
Oil                  Mn. Tonne       74.1     78.71    81.99     90.43     95.86     99.41     110.86
POL Products         Mn. Tonne       9.27      7.01     6.74       7.9      8.87     11.68      16.97
Total (a)            Mn. Tonne      83.37     85.72    88.73     98.33    104.69    111.09     127.83
(b) Value :
Crude Oil            Rs. Billion   659.32   603.97    761.95    835.28   1170.03   1717.02    2199.91
POL Products         Rs. Billion   120.93    72.49     82.06     96.77    148.88    255.75     403.89
Total (b)            Rs. Billion   780.25   676.46    844.01    932.05   1318.91   1972.77     2603.8
Pol. Imports
as per
DGCI&S               Rs. Billion   714.97     667.7   853.67     945.2   1340.94    1946.4    2582.59
(ii) Exports
(a) Qty
POL Products         Mn. Tonne       8.37     10.07    10.29     14.62     18.21     21.51       32.4
(b) Value
POL Products         Rs. Billion    76.72     82.19   108.68    167.81    299.28     467.2     801.72
(iii) Net


                                               25
Imports:
 (a) Qty : Crude
 Oil                  Mn. Tonne            74.1       78.71        81.99        90.43       95.86          99.41    110.86
 POL Products         Mn. Tonne             0.9       -3.06        -3.55        -6.72       -9.83          -9.83    -15.43
 Total (a)            Mn. Tonne              75       75.65        78.44        83.71       86.48          89.58     95.43
 (b) Value :
 Crude Oil            Rs. Billion       659.32       603.97       761.95      835.28     1170.03      1717.02      2199.91
 POL Products         Rs. Billion        44.21         -9.7       -26.62      -71.04      -150.4      -211.45      -397.83
 Total (b)            Rs. Billion       703.53       594.27       735.33      764.24     1019.63      1505.57       1802.8
 (iv) Unit Value
 of Crude Oil
 Imports
 (Gross)              Rs./MT              8898         7673         9293        9237        12206         17272     19844
 5. India's
 Total Exports        Rs. Billion      2035.71     2090.18      2551.37      2933.67     3618.79      4564.18      5716.42
 6. Pol.
 Imports as %
 of India's
 Total Exports
 (i) Gross
 Imports              %                    38.3         32.4         33.1        31.8         36.4          43.2      45.5
 (ii) Net Imports     %                    34.6         28.4         28.8        26.1         28.2            33      31.5
 7.
 Contribution
 of Oil Sector
 to
 Centre/State
 Resources
 (i) Royalty from
 Crude Oil            Rs. Billion         22.72       24.86        30.67        31.74       42.71           50.6      N.A.
 (ii) Royalty
 from Gas             Rs. Billion          6.08         6.59         7.78        8.54         8.29          9.81      N.A.
 (iii) Oil
 Development
 Cess                 Rs. Billion         27.28       28.78        50.91        51.43       52.48          50.07     70.34
 (iv) Excise &
 Custom Duties        Rs. Billion       359.12       361.04       451.27      507.33       563.95         631.43    718.93
 (v) Sales Tax        Rs. Billion       233.75        200.9       297.41      328.49         390            N.A.      N.A.
 (vi) Dividend        Rs. Billion        34.82        32.87        67.94        63.1        94.36           N.A.      N.A.
 8. Natural Gas
 :
 (i) Gross            Bn. Cub.
 Production           Mtr.              29.477       29.714       31.389      31.962       31.763         32.202    31.747
                      Bn. Cub.
 (ii) Utilisation     Mtr.                27.86      28.037       29.963      30.906       30.775         31.325    30.791
Abbr: NA : Not Available.
Note : * : Provisional.
       ! : As on 1st April of Initial year.
Source: Ministry of Petroleum and Natural Gas. Government of India, (downloaded from www.indiastat.com)


                                                        26
Table A2: Company-wise Production, Consumption, Import and Export of Liquefied
                                             Petroleum Gas (LPG) in India

                                                                                Company
                                                                     PSU                                                         PVT             Total
Particular    Year
                                                   Refinery                                       Fractionator                 Refinery
                        IOCL     CPCL      BPCL     HPCL      NRL      BRPL      MRPL     ONGC       GAIL     OIL    RIL        EOL       PVT    (TMT)
              2007-0
              8 (Apr-
             Dec 07)     1198        260      673       453       38       34       211         774      789     36  1992          57     ---     6515
Production    2006-0
                   7     1488        399      826       592       54       48       282       1020    1032       44  2653          17     ---     8454
              2005-0
                   6     1354        407      739       466       47       50       275       1094    1042       48  2193                 ---     7717
              2007-0
              8 (Apr-
             Dec 07)     3976       ---     2192      2105       ---      ---       ---        ---      ---    ---    ---        ---      477     8750
Consumptio
              2006-0                                         ---      ---       ---       ---       ---      ---
    n
                   7     5098       ---     2780      2651                                                                 9      ---     310    10848
              2005-0                                         ---      ---       ---       ---       ---      ---
                   6     4832       ---     2613      2531                                                              47        ---     433    10456
              2007-0                                         ---      ---       ---       ---       ---      ---
              8 (Apr-
             Dec 07)     1226       ---       111       171                                                           ---        ---      477     1985
  Import      2006-0                                         ---      ---       ---       ---       ---      ---
                   7     1558       ---       192       217                                                           ---        ---      310     2278
              2005-0                                         ---      ---       ---       ---       ---      ---
                   6     2233        ---      217      ---                                                            ---         ---     433     2883
              2007-0                                         ---      ---       ---       ---       ---      ---
              8 (Apr-
             Dec 07)        72      ---      ---       ---                                                             ---       ---      ---       72
  Export      2006-0                                         ---      ---       ---       ---       ---      ---
                   7        86     ---       ---       ---                                                              26                 0.1     112
              2005-0                                         ---      ---       ---       ---       ---      ---
                   6        53      ---      ---       ---                                                            ---        ---      ---       53
                Source: Rajya Sabha Unstarred Question No. 575, dated on 04.03.2008. (downloaded from www.indiastat.com)


               B.        Production

                     Table B1: Refinery Crude Throughput and Production of Petroleum Products in India
                                                                                                     (‘000 Tonnes)
                             Year           Crude Throughput                               Production
                                         Public    Private                          Public    Private
                                                            Total                                                Total
                                       Sector/JVC Sector                          Sector/JVC Sector
                            1961-6
                            2                      60         6524         6584              11      6184         6195
                            1965-6
                            6                   1966          8267     10233               1733      7828         9561
                            1970-7
                            1                 10820           7559     18379               9965      7145        17110
                            1975-7
                            6                 17045           5238     22283              15895      4934        20829
                            1980-8
                            1                 25333           503      25836              23646        477       24123
                            1985-8
                            6                 42910              -     42910              39881           -      39881
                            1990-9
                            1                 51772              -     51772              48562           -      48562
                            1991-9
                            2                 51423              -     51423              48349           -      48349


                                                                           27
1992-9
             3                 53482            -      53482              50359          -      50359
             1993-9
             4                 54296            -      54296              51084          -      51084
             1994-9
             5                 56534            -      56534              52927          -      52927
             1995-9
             6                 58741            -      58741              55081          -      55081
             1996-9
             7                 62870            -      62870              59005          -      59005
             1997-9
             8                 65166            -      65166              61308          -      61308
             1998-9
             9                 68538            -      68538              64544          -      64544
             1999-0
             0                 74052        11912      85964              69144      10267      79411
             2000-0
             1                 77411        26033     103444              72059      23555      95614
             2001-0
             2                 77620        29654     107274              72462      27542     100004
             2002-0
             3                 82015        30544     112559              76236      27904     104140
             2003-0
             4                 89495        32345     121840              83397      30066     113463
             2004-0
             5                 92808        34309     127117              86328      31905     118233
             2005-0
             6                 96946        33163     130109              89793      29957     119750
             2006-0
             7*                108173       38378     146551              99714      35546     135260
          Note: * : Provisional.
           Source: Ministry of Petroleum and Natural Gas. Government of India, (downloaded from www.indiastat.com)


Table B2:           Refinery-wise Crude Run and Production of Petroleum Products in India -
                                             Part I
                                                                                                  (in ‘000 tonnes)
                      IOC         BPCL        HPCL              HPCL        IOC        IOC         IOC          IOC           IOC
     Year             AOD        Mumbai       Mumbai            Visakh    Guwahati   Barauni     Gujarat      Haldia        Mathura
1990-91
Total
Production               540         6603           5506           3231        712      2206         8791            2608       7414
Crude Run                566         6957           5766           3464        783      2416         9334            2935       7808
1991-92
Total
Production               524         6630           4496           3676        793      2060         8877            2791       7925
Crude Run                546         6940           4729           3920        856      2262         9379            3021       8231
1992-93
Total
Production               623         6875           5619           4274        749      2097         9258            2810       7430
Crude Run                547         7233           5849           4527        815      2287         9780            3040       7843
1993-94
Total
Production               535         6831           5774           4203        840      2051         8830            2878       8121
Crude Run                554         7203           6018           4448        910      2222         9434            3106       8518
1994-95
Total                    509         7071           4913           4759        833      2039         9148            2998       8018


                                                           28
Competition in the Indian Petroleum Industry

Mais conteúdo relacionado

Mais procurados

India’s balance of payments
India’s balance of payments India’s balance of payments
India’s balance of payments Rishabh Sharma
 
India’s Foreign Trade Policy - Objectives, Aims, Composition and Schemes
India’s Foreign Trade Policy - Objectives, Aims, Composition and SchemesIndia’s Foreign Trade Policy - Objectives, Aims, Composition and Schemes
India’s Foreign Trade Policy - Objectives, Aims, Composition and SchemesSundar B N
 
India’s foreign trade
India’s foreign tradeIndia’s foreign trade
India’s foreign tradeRajalakshmi K
 
Chemicals investor briefing: Re-shaping Shell, to create a world-class class ...
Chemicals investor briefing: Re-shaping Shell, to create a world-class class ...Chemicals investor briefing: Re-shaping Shell, to create a world-class class ...
Chemicals investor briefing: Re-shaping Shell, to create a world-class class ...Shell plc
 
Recent trends in foreign trade in india
Recent trends in foreign trade in india Recent trends in foreign trade in india
Recent trends in foreign trade in india Abhishek Shinde
 
Crude oil analysis
Crude oil analysisCrude oil analysis
Crude oil analysisKarnav Rana
 
Industrial Analysis Presentation Oil & Gas
Industrial Analysis Presentation Oil & GasIndustrial Analysis Presentation Oil & Gas
Industrial Analysis Presentation Oil & GasSaravanan A
 
International economics notes
International economics notesInternational economics notes
International economics notesGanesh Gk
 
Foreign Exchange Management Act (FEMA)
Foreign Exchange Management Act (FEMA)Foreign Exchange Management Act (FEMA)
Foreign Exchange Management Act (FEMA)basiljoe010
 
Export promotion vs import substitution
Export promotion vs import substitutionExport promotion vs import substitution
Export promotion vs import substitutionsushant raghav
 
Cost management and performance evaluation in petroleum upstream industry part b
Cost management and performance evaluation in petroleum upstream industry part bCost management and performance evaluation in petroleum upstream industry part b
Cost management and performance evaluation in petroleum upstream industry part bHamdy Rashed
 
international trade theories
international trade theoriesinternational trade theories
international trade theoriesArushi Verma
 
Why oil prices failing
Why oil prices failingWhy oil prices failing
Why oil prices failingHasnain Baber
 
Reasons for change in crude oil price
Reasons for change in crude oil price Reasons for change in crude oil price
Reasons for change in crude oil price Gurjit Kaur Kaler
 

Mais procurados (20)

India’s balance of payments
India’s balance of payments India’s balance of payments
India’s balance of payments
 
India’s Foreign Trade Policy - Objectives, Aims, Composition and Schemes
India’s Foreign Trade Policy - Objectives, Aims, Composition and SchemesIndia’s Foreign Trade Policy - Objectives, Aims, Composition and Schemes
India’s Foreign Trade Policy - Objectives, Aims, Composition and Schemes
 
India’s foreign trade
India’s foreign tradeIndia’s foreign trade
India’s foreign trade
 
Chemicals investor briefing: Re-shaping Shell, to create a world-class class ...
Chemicals investor briefing: Re-shaping Shell, to create a world-class class ...Chemicals investor briefing: Re-shaping Shell, to create a world-class class ...
Chemicals investor briefing: Re-shaping Shell, to create a world-class class ...
 
International Trade Theory : Absolute Advantage Theory
International Trade Theory : Absolute Advantage Theory International Trade Theory : Absolute Advantage Theory
International Trade Theory : Absolute Advantage Theory
 
Deemed Export and Rupee Convertibility
Deemed Export and Rupee ConvertibilityDeemed Export and Rupee Convertibility
Deemed Export and Rupee Convertibility
 
Recent trends in foreign trade in india
Recent trends in foreign trade in india Recent trends in foreign trade in india
Recent trends in foreign trade in india
 
Crude Oil Price Formation
Crude Oil Price FormationCrude Oil Price Formation
Crude Oil Price Formation
 
New FDI Policy
New FDI PolicyNew FDI Policy
New FDI Policy
 
Fera and fema
Fera and femaFera and fema
Fera and fema
 
Crude oil analysis
Crude oil analysisCrude oil analysis
Crude oil analysis
 
Changes in Oil Price and Economic Impacts
Changes in Oil Price and Economic ImpactsChanges in Oil Price and Economic Impacts
Changes in Oil Price and Economic Impacts
 
Industrial Analysis Presentation Oil & Gas
Industrial Analysis Presentation Oil & GasIndustrial Analysis Presentation Oil & Gas
Industrial Analysis Presentation Oil & Gas
 
International economics notes
International economics notesInternational economics notes
International economics notes
 
Foreign Exchange Management Act (FEMA)
Foreign Exchange Management Act (FEMA)Foreign Exchange Management Act (FEMA)
Foreign Exchange Management Act (FEMA)
 
Export promotion vs import substitution
Export promotion vs import substitutionExport promotion vs import substitution
Export promotion vs import substitution
 
Cost management and performance evaluation in petroleum upstream industry part b
Cost management and performance evaluation in petroleum upstream industry part bCost management and performance evaluation in petroleum upstream industry part b
Cost management and performance evaluation in petroleum upstream industry part b
 
international trade theories
international trade theoriesinternational trade theories
international trade theories
 
Why oil prices failing
Why oil prices failingWhy oil prices failing
Why oil prices failing
 
Reasons for change in crude oil price
Reasons for change in crude oil price Reasons for change in crude oil price
Reasons for change in crude oil price
 

Destaque

Consumer behaviour presentation
Consumer behaviour presentationConsumer behaviour presentation
Consumer behaviour presentationkakshruti
 
Market Research India - Imported Edible Oils Market in India 2009
Market Research India - Imported Edible Oils Market in India 2009Market Research India - Imported Edible Oils Market in India 2009
Market Research India - Imported Edible Oils Market in India 2009Netscribes, Inc.
 
Oil and gas industry
Oil and gas industryOil and gas industry
Oil and gas industrydomsr
 
International Monetary Fund
International Monetary FundInternational Monetary Fund
International Monetary FundAabhas Rastogi
 
International Monetary Fund (IMF)
International Monetary Fund (IMF)International Monetary Fund (IMF)
International Monetary Fund (IMF)Hj Habib
 
International Monetary Fund
International Monetary FundInternational Monetary Fund
International Monetary FundCitibank N.A.
 
Jnd in marketing consumer behavior
Jnd in marketing consumer behavior Jnd in marketing consumer behavior
Jnd in marketing consumer behavior Vivek Rajak
 

Destaque (8)

Consumer behaviour presentation
Consumer behaviour presentationConsumer behaviour presentation
Consumer behaviour presentation
 
Market Research India - Imported Edible Oils Market in India 2009
Market Research India - Imported Edible Oils Market in India 2009Market Research India - Imported Edible Oils Market in India 2009
Market Research India - Imported Edible Oils Market in India 2009
 
Petroleum
PetroleumPetroleum
Petroleum
 
Oil and gas industry
Oil and gas industryOil and gas industry
Oil and gas industry
 
International Monetary Fund
International Monetary FundInternational Monetary Fund
International Monetary Fund
 
International Monetary Fund (IMF)
International Monetary Fund (IMF)International Monetary Fund (IMF)
International Monetary Fund (IMF)
 
International Monetary Fund
International Monetary FundInternational Monetary Fund
International Monetary Fund
 
Jnd in marketing consumer behavior
Jnd in marketing consumer behavior Jnd in marketing consumer behavior
Jnd in marketing consumer behavior
 

Semelhante a Competition in the Indian Petroleum Industry

Petroleum Refining Economic Performance.pdf
Petroleum Refining Economic Performance.pdfPetroleum Refining Economic Performance.pdf
Petroleum Refining Economic Performance.pdfMohamed Elba
 
British Petroleum
British PetroleumBritish Petroleum
British PetroleumAmber Moore
 
RL33359 Oil Shale History
RL33359 Oil Shale HistoryRL33359 Oil Shale History
RL33359 Oil Shale HistoryAnthony Andrews
 
The secondary sector
The secondary sectorThe secondary sector
The secondary sectorTeresa Pérez
 
Canadian Fuels Association - The Economics of Petroleum Refining
Canadian Fuels Association - The Economics of Petroleum RefiningCanadian Fuels Association - The Economics of Petroleum Refining
Canadian Fuels Association - The Economics of Petroleum RefiningCanadian Fuels Association
 
Oil shale history, incentives, and policy
Oil shale  history, incentives, and policyOil shale  history, incentives, and policy
Oil shale history, incentives, and policysugeladi
 
Indian automobile industry
Indian automobile industryIndian automobile industry
Indian automobile industryanil akula
 
A study on effectiveness and efficiency of the existing inventory control sys...
A study on effectiveness and efficiency of the existing inventory control sys...A study on effectiveness and efficiency of the existing inventory control sys...
A study on effectiveness and efficiency of the existing inventory control sys...Bella Meraki
 
Saudi Arabia Industrial Gases Market Is Anticipated To Register A CAGR Of 4.9...
Saudi Arabia Industrial Gases Market Is Anticipated To Register A CAGR Of 4.9...Saudi Arabia Industrial Gases Market Is Anticipated To Register A CAGR Of 4.9...
Saudi Arabia Industrial Gases Market Is Anticipated To Register A CAGR Of 4.9...Vipin Mishra
 
Techshore Inspection Services.pptx
Techshore Inspection Services.pptxTechshore Inspection Services.pptx
Techshore Inspection Services.pptxTechshoreInstitute1
 
Mobile Biofuel Technologies
Mobile Biofuel Technologies Mobile Biofuel Technologies
Mobile Biofuel Technologies Blake Snowden
 

Semelhante a Competition in the Indian Petroleum Industry (20)

Petroleum Refining Economic Performance.pdf
Petroleum Refining Economic Performance.pdfPetroleum Refining Economic Performance.pdf
Petroleum Refining Economic Performance.pdf
 
British Petroleum
British PetroleumBritish Petroleum
British Petroleum
 
RL33359 Oil Shale History
RL33359 Oil Shale HistoryRL33359 Oil Shale History
RL33359 Oil Shale History
 
The secondary sector
The secondary sectorThe secondary sector
The secondary sector
 
Canadian Fuels Association - The Economics of Petroleum Refining
Canadian Fuels Association - The Economics of Petroleum RefiningCanadian Fuels Association - The Economics of Petroleum Refining
Canadian Fuels Association - The Economics of Petroleum Refining
 
Oil shale history, incentives, and policy
Oil shale  history, incentives, and policyOil shale  history, incentives, and policy
Oil shale history, incentives, and policy
 
Indian automobile industry
Indian automobile industryIndian automobile industry
Indian automobile industry
 
Research methodology
Research methodologyResearch methodology
Research methodology
 
Presentation-1.pptx
Presentation-1.pptxPresentation-1.pptx
Presentation-1.pptx
 
PETROLEUM INDUSTRY STRUCTURE
PETROLEUM INDUSTRY STRUCTURE PETROLEUM INDUSTRY STRUCTURE
PETROLEUM INDUSTRY STRUCTURE
 
AUTOMOTIVE ENGINE EXHAUST AND ITS EFFECT ON ATMOSPHERE
AUTOMOTIVE ENGINE EXHAUST AND ITS EFFECT ON ATMOSPHEREAUTOMOTIVE ENGINE EXHAUST AND ITS EFFECT ON ATMOSPHERE
AUTOMOTIVE ENGINE EXHAUST AND ITS EFFECT ON ATMOSPHERE
 
Deliberating Diesel
Deliberating DieselDeliberating Diesel
Deliberating Diesel
 
Automobile 26
Automobile 26Automobile 26
Automobile 26
 
A study on effectiveness and efficiency of the existing inventory control sys...
A study on effectiveness and efficiency of the existing inventory control sys...A study on effectiveness and efficiency of the existing inventory control sys...
A study on effectiveness and efficiency of the existing inventory control sys...
 
Seminar
SeminarSeminar
Seminar
 
Saudi Arabia Industrial Gases Market Is Anticipated To Register A CAGR Of 4.9...
Saudi Arabia Industrial Gases Market Is Anticipated To Register A CAGR Of 4.9...Saudi Arabia Industrial Gases Market Is Anticipated To Register A CAGR Of 4.9...
Saudi Arabia Industrial Gases Market Is Anticipated To Register A CAGR Of 4.9...
 
Techshore Inspection Services.pptx
Techshore Inspection Services.pptxTechshore Inspection Services.pptx
Techshore Inspection Services.pptx
 
Automobile module1
Automobile module1Automobile module1
Automobile module1
 
Oil industry overview
Oil industry overviewOil industry overview
Oil industry overview
 
Mobile Biofuel Technologies
Mobile Biofuel Technologies Mobile Biofuel Technologies
Mobile Biofuel Technologies
 

Mais de Indicus Analytics Private Limited

Contribution of Urban Informal Settlement Dwellers to Urban Economy in India
Contribution of Urban Informal Settlement Dwellers to Urban Economy in IndiaContribution of Urban Informal Settlement Dwellers to Urban Economy in India
Contribution of Urban Informal Settlement Dwellers to Urban Economy in IndiaIndicus Analytics Private Limited
 
Predicting growth of urban agglomerations through fractal analysis of geo spa...
Predicting growth of urban agglomerations through fractal analysis of geo spa...Predicting growth of urban agglomerations through fractal analysis of geo spa...
Predicting growth of urban agglomerations through fractal analysis of geo spa...Indicus Analytics Private Limited
 
POLICY BRIEF ON FINANCIAL INCLUSION IN INDIA: E-money issuers- Risks, Rewards...
POLICY BRIEF ON FINANCIAL INCLUSION IN INDIA: E-money issuers- Risks, Rewards...POLICY BRIEF ON FINANCIAL INCLUSION IN INDIA: E-money issuers- Risks, Rewards...
POLICY BRIEF ON FINANCIAL INCLUSION IN INDIA: E-money issuers- Risks, Rewards...Indicus Analytics Private Limited
 

Mais de Indicus Analytics Private Limited (20)

Indicus Product Portfolio 2013 14
Indicus Product Portfolio 2013 14Indicus Product Portfolio 2013 14
Indicus Product Portfolio 2013 14
 
Economic Freedom Index of the States of India 2013
Economic Freedom Index of the States of India 2013Economic Freedom Index of the States of India 2013
Economic Freedom Index of the States of India 2013
 
Contribution of Urban Informal Settlement Dwellers to Urban Economy in India
Contribution of Urban Informal Settlement Dwellers to Urban Economy in IndiaContribution of Urban Informal Settlement Dwellers to Urban Economy in India
Contribution of Urban Informal Settlement Dwellers to Urban Economy in India
 
Predicting growth of urban agglomerations through fractal analysis of geo spa...
Predicting growth of urban agglomerations through fractal analysis of geo spa...Predicting growth of urban agglomerations through fractal analysis of geo spa...
Predicting growth of urban agglomerations through fractal analysis of geo spa...
 
Exploring the Luxury Clusters of India
Exploring the Luxury Clusters of IndiaExploring the Luxury Clusters of India
Exploring the Luxury Clusters of India
 
Indicus premium products software tour
Indicus premium products software tourIndicus premium products software tour
Indicus premium products software tour
 
A recipe for disaster
A recipe for disasterA recipe for disaster
A recipe for disaster
 
Market Skyline of India 2013-14
Market Skyline of India 2013-14Market Skyline of India 2013-14
Market Skyline of India 2013-14
 
The Case for Increasing FDI Caps in Insurance
The Case for Increasing FDI Caps in InsuranceThe Case for Increasing FDI Caps in Insurance
The Case for Increasing FDI Caps in Insurance
 
Economic freedom of the states of india 2012
Economic freedom of the states of india 2012Economic freedom of the states of india 2012
Economic freedom of the states of india 2012
 
Gujarat - the Social Sectors
Gujarat - the Social SectorsGujarat - the Social Sectors
Gujarat - the Social Sectors
 
Gujarat the growth story
Gujarat the growth storyGujarat the growth story
Gujarat the growth story
 
Indian cement industry a technology perspective
Indian cement industry a technology perspectiveIndian cement industry a technology perspective
Indian cement industry a technology perspective
 
Employment Trends Survey 2012
Employment Trends Survey 2012Employment Trends Survey 2012
Employment Trends Survey 2012
 
eyestate brochure
eyestate brochureeyestate brochure
eyestate brochure
 
eyestate
eyestateeyestate
eyestate
 
The organized sector in India created 346,000 jobs
The organized sector in India created 346,000 jobs The organized sector in India created 346,000 jobs
The organized sector in India created 346,000 jobs
 
Tracking urban households
Tracking urban householdsTracking urban households
Tracking urban households
 
Small durables a grwoing market
Small durables a grwoing marketSmall durables a grwoing market
Small durables a grwoing market
 
POLICY BRIEF ON FINANCIAL INCLUSION IN INDIA: E-money issuers- Risks, Rewards...
POLICY BRIEF ON FINANCIAL INCLUSION IN INDIA: E-money issuers- Risks, Rewards...POLICY BRIEF ON FINANCIAL INCLUSION IN INDIA: E-money issuers- Risks, Rewards...
POLICY BRIEF ON FINANCIAL INCLUSION IN INDIA: E-money issuers- Risks, Rewards...
 

Último

Digital Transformation in the PLM domain - distrib.pdf
Digital Transformation in the PLM domain - distrib.pdfDigital Transformation in the PLM domain - distrib.pdf
Digital Transformation in the PLM domain - distrib.pdfJos Voskuil
 
Kenya Coconut Production Presentation by Dr. Lalith Perera
Kenya Coconut Production Presentation by Dr. Lalith PereraKenya Coconut Production Presentation by Dr. Lalith Perera
Kenya Coconut Production Presentation by Dr. Lalith Pereraictsugar
 
The-Ethical-issues-ghhhhhhhhjof-Byjus.pptx
The-Ethical-issues-ghhhhhhhhjof-Byjus.pptxThe-Ethical-issues-ghhhhhhhhjof-Byjus.pptx
The-Ethical-issues-ghhhhhhhhjof-Byjus.pptxmbikashkanyari
 
Ten Organizational Design Models to align structure and operations to busines...
Ten Organizational Design Models to align structure and operations to busines...Ten Organizational Design Models to align structure and operations to busines...
Ten Organizational Design Models to align structure and operations to busines...Seta Wicaksana
 
FULL ENJOY Call girls in Paharganj Delhi | 8377087607
FULL ENJOY Call girls in Paharganj Delhi | 8377087607FULL ENJOY Call girls in Paharganj Delhi | 8377087607
FULL ENJOY Call girls in Paharganj Delhi | 8377087607dollysharma2066
 
Chapter 9 PPT 4th edition.pdf internal audit
Chapter 9 PPT 4th edition.pdf internal auditChapter 9 PPT 4th edition.pdf internal audit
Chapter 9 PPT 4th edition.pdf internal auditNhtLNguyn9
 
Annual General Meeting Presentation Slides
Annual General Meeting Presentation SlidesAnnual General Meeting Presentation Slides
Annual General Meeting Presentation SlidesKeppelCorporation
 
8447779800, Low rate Call girls in Rohini Delhi NCR
8447779800, Low rate Call girls in Rohini Delhi NCR8447779800, Low rate Call girls in Rohini Delhi NCR
8447779800, Low rate Call girls in Rohini Delhi NCRashishs7044
 
TriStar Gold Corporate Presentation - April 2024
TriStar Gold Corporate Presentation - April 2024TriStar Gold Corporate Presentation - April 2024
TriStar Gold Corporate Presentation - April 2024Adnet Communications
 
Youth Involvement in an Innovative Coconut Value Chain by Mwalimu Menza
Youth Involvement in an Innovative Coconut Value Chain by Mwalimu MenzaYouth Involvement in an Innovative Coconut Value Chain by Mwalimu Menza
Youth Involvement in an Innovative Coconut Value Chain by Mwalimu Menzaictsugar
 
Financial-Statement-Analysis-of-Coca-cola-Company.pptx
Financial-Statement-Analysis-of-Coca-cola-Company.pptxFinancial-Statement-Analysis-of-Coca-cola-Company.pptx
Financial-Statement-Analysis-of-Coca-cola-Company.pptxsaniyaimamuddin
 
Pitch Deck Teardown: Geodesic.Life's $500k Pre-seed deck
Pitch Deck Teardown: Geodesic.Life's $500k Pre-seed deckPitch Deck Teardown: Geodesic.Life's $500k Pre-seed deck
Pitch Deck Teardown: Geodesic.Life's $500k Pre-seed deckHajeJanKamps
 
Cybersecurity Awareness Training Presentation v2024.03
Cybersecurity Awareness Training Presentation v2024.03Cybersecurity Awareness Training Presentation v2024.03
Cybersecurity Awareness Training Presentation v2024.03DallasHaselhorst
 
Market Sizes Sample Report - 2024 Edition
Market Sizes Sample Report - 2024 EditionMarket Sizes Sample Report - 2024 Edition
Market Sizes Sample Report - 2024 EditionMintel Group
 
8447779800, Low rate Call girls in Uttam Nagar Delhi NCR
8447779800, Low rate Call girls in Uttam Nagar Delhi NCR8447779800, Low rate Call girls in Uttam Nagar Delhi NCR
8447779800, Low rate Call girls in Uttam Nagar Delhi NCRashishs7044
 
(Best) ENJOY Call Girls in Faridabad Ex | 8377087607
(Best) ENJOY Call Girls in Faridabad Ex | 8377087607(Best) ENJOY Call Girls in Faridabad Ex | 8377087607
(Best) ENJOY Call Girls in Faridabad Ex | 8377087607dollysharma2066
 
Call Us 📲8800102216📞 Call Girls In DLF City Gurgaon
Call Us 📲8800102216📞 Call Girls In DLF City GurgaonCall Us 📲8800102216📞 Call Girls In DLF City Gurgaon
Call Us 📲8800102216📞 Call Girls In DLF City Gurgaoncallgirls2057
 
Buy gmail accounts.pdf Buy Old Gmail Accounts
Buy gmail accounts.pdf Buy Old Gmail AccountsBuy gmail accounts.pdf Buy Old Gmail Accounts
Buy gmail accounts.pdf Buy Old Gmail AccountsBuy Verified Accounts
 
Call US-88OO1O2216 Call Girls In Mahipalpur Female Escort Service
Call US-88OO1O2216 Call Girls In Mahipalpur Female Escort ServiceCall US-88OO1O2216 Call Girls In Mahipalpur Female Escort Service
Call US-88OO1O2216 Call Girls In Mahipalpur Female Escort Servicecallgirls2057
 

Último (20)

Digital Transformation in the PLM domain - distrib.pdf
Digital Transformation in the PLM domain - distrib.pdfDigital Transformation in the PLM domain - distrib.pdf
Digital Transformation in the PLM domain - distrib.pdf
 
Kenya Coconut Production Presentation by Dr. Lalith Perera
Kenya Coconut Production Presentation by Dr. Lalith PereraKenya Coconut Production Presentation by Dr. Lalith Perera
Kenya Coconut Production Presentation by Dr. Lalith Perera
 
The-Ethical-issues-ghhhhhhhhjof-Byjus.pptx
The-Ethical-issues-ghhhhhhhhjof-Byjus.pptxThe-Ethical-issues-ghhhhhhhhjof-Byjus.pptx
The-Ethical-issues-ghhhhhhhhjof-Byjus.pptx
 
Ten Organizational Design Models to align structure and operations to busines...
Ten Organizational Design Models to align structure and operations to busines...Ten Organizational Design Models to align structure and operations to busines...
Ten Organizational Design Models to align structure and operations to busines...
 
FULL ENJOY Call girls in Paharganj Delhi | 8377087607
FULL ENJOY Call girls in Paharganj Delhi | 8377087607FULL ENJOY Call girls in Paharganj Delhi | 8377087607
FULL ENJOY Call girls in Paharganj Delhi | 8377087607
 
Chapter 9 PPT 4th edition.pdf internal audit
Chapter 9 PPT 4th edition.pdf internal auditChapter 9 PPT 4th edition.pdf internal audit
Chapter 9 PPT 4th edition.pdf internal audit
 
Annual General Meeting Presentation Slides
Annual General Meeting Presentation SlidesAnnual General Meeting Presentation Slides
Annual General Meeting Presentation Slides
 
8447779800, Low rate Call girls in Rohini Delhi NCR
8447779800, Low rate Call girls in Rohini Delhi NCR8447779800, Low rate Call girls in Rohini Delhi NCR
8447779800, Low rate Call girls in Rohini Delhi NCR
 
TriStar Gold Corporate Presentation - April 2024
TriStar Gold Corporate Presentation - April 2024TriStar Gold Corporate Presentation - April 2024
TriStar Gold Corporate Presentation - April 2024
 
Youth Involvement in an Innovative Coconut Value Chain by Mwalimu Menza
Youth Involvement in an Innovative Coconut Value Chain by Mwalimu MenzaYouth Involvement in an Innovative Coconut Value Chain by Mwalimu Menza
Youth Involvement in an Innovative Coconut Value Chain by Mwalimu Menza
 
Financial-Statement-Analysis-of-Coca-cola-Company.pptx
Financial-Statement-Analysis-of-Coca-cola-Company.pptxFinancial-Statement-Analysis-of-Coca-cola-Company.pptx
Financial-Statement-Analysis-of-Coca-cola-Company.pptx
 
Pitch Deck Teardown: Geodesic.Life's $500k Pre-seed deck
Pitch Deck Teardown: Geodesic.Life's $500k Pre-seed deckPitch Deck Teardown: Geodesic.Life's $500k Pre-seed deck
Pitch Deck Teardown: Geodesic.Life's $500k Pre-seed deck
 
Cybersecurity Awareness Training Presentation v2024.03
Cybersecurity Awareness Training Presentation v2024.03Cybersecurity Awareness Training Presentation v2024.03
Cybersecurity Awareness Training Presentation v2024.03
 
Market Sizes Sample Report - 2024 Edition
Market Sizes Sample Report - 2024 EditionMarket Sizes Sample Report - 2024 Edition
Market Sizes Sample Report - 2024 Edition
 
8447779800, Low rate Call girls in Uttam Nagar Delhi NCR
8447779800, Low rate Call girls in Uttam Nagar Delhi NCR8447779800, Low rate Call girls in Uttam Nagar Delhi NCR
8447779800, Low rate Call girls in Uttam Nagar Delhi NCR
 
(Best) ENJOY Call Girls in Faridabad Ex | 8377087607
(Best) ENJOY Call Girls in Faridabad Ex | 8377087607(Best) ENJOY Call Girls in Faridabad Ex | 8377087607
(Best) ENJOY Call Girls in Faridabad Ex | 8377087607
 
Enjoy ➥8448380779▻ Call Girls In Sector 18 Noida Escorts Delhi NCR
Enjoy ➥8448380779▻ Call Girls In Sector 18 Noida Escorts Delhi NCREnjoy ➥8448380779▻ Call Girls In Sector 18 Noida Escorts Delhi NCR
Enjoy ➥8448380779▻ Call Girls In Sector 18 Noida Escorts Delhi NCR
 
Call Us 📲8800102216📞 Call Girls In DLF City Gurgaon
Call Us 📲8800102216📞 Call Girls In DLF City GurgaonCall Us 📲8800102216📞 Call Girls In DLF City Gurgaon
Call Us 📲8800102216📞 Call Girls In DLF City Gurgaon
 
Buy gmail accounts.pdf Buy Old Gmail Accounts
Buy gmail accounts.pdf Buy Old Gmail AccountsBuy gmail accounts.pdf Buy Old Gmail Accounts
Buy gmail accounts.pdf Buy Old Gmail Accounts
 
Call US-88OO1O2216 Call Girls In Mahipalpur Female Escort Service
Call US-88OO1O2216 Call Girls In Mahipalpur Female Escort ServiceCall US-88OO1O2216 Call Girls In Mahipalpur Female Escort Service
Call US-88OO1O2216 Call Girls In Mahipalpur Female Escort Service
 

Competition in the Indian Petroleum Industry

  • 1. STATE OF COMPETITION IN THE INDIAN PETROLEUM INDUSTRY Final Report: January 20, 2009 By Indicus Analytics Pvt. Ltd New Delhi For Competition Commission of India New Delhi Indicus Analytics
  • 2.
  • 3. CONTENTS I INTRODUCTION.....................................................................................................................................1 II REFINERY TECHNOLOGY AND PRODUCTS................................................................................3 III GLOBAL OIL INDUSTRY...................................................................................................................5 IV INDIAN OIL INDUSTRY......................................................................................................................9 V COMPETITION IN EXPLORATION................................................................................................14 VI COMPETITION IN USER INDUSTRIES.........................................................................................18 VII COMPETITION IN REFINING INDUSTRY.................................................................................20 VIII COMPETITION IN GAS INDUSTRY..........................................................................................21 IX CONCLUSION......................................................................................................................................22 DATA APPENDIX.......................................................................................................................................25 PETROLEUM STATISTICS..................................................................................................................................25 i
  • 4. Team Members Ashok Desai Laveesh Bhandari Ramrao Mundhe Maj. General Bhupindra Yadav Special Thanks to Experts at the Competition Commission of India Payal Malik ii
  • 5. I Introduction This paper is about the Indian petroleum refining industry. But this industry is extremely open; trade flows are large compared to production. And there is considerable overlap between oil production and refining internationally, and to some extent in India. So we begin with a brief discussion of the international petroleum industry and its components – refining being one of them. Petroleum is extracted from underground reserves; then it is cracked or “refined” into end products for various uses. The petroleum industry thus has two parts: an oil exploration and production industry upstream and a refinery industry downstream. Most oil producers also own refineries. But the reverse is not true; a high proportion of oil is sold to refinery companies that do not produce crude oil. Sedimentary rocks in which hydrocarbons are trapped often hold gas, sometimes in association with crude oil and sometimes alone. It consists mostly of methane, which is lighter than air and toxic. It therefore requires airtight tanks for storage and similarly leak-proof pipes or trucks for transport, which raise its capital costs. Associated gas was flared in early years of the industry; it is still flared at remote or minor wells where the cost of its collection and transport would be high, or often reinjected into the oilfield to maintain pressure which forces oil up to the surface. But where the quantities are large enough, natural gas is mined and traded. It is mainly used as an industrial, domestic and vehicular fuel. Motor vehicles run almost exclusively on petrol and high-speed diesel oil, both fuels derived from mineral oil – although they can be modified to run on certain biofuels. Vehicles are so widely dispersed that they require an extensive distribution system for these two refinery products. As motor vehicle use has spread across the world, it has brought along with it petrol pumps, logistics, storage and supply of fuels. There is thus a third part of the petroleum industry downstream from refineries which distributes the products. It is owned by refineries in most countries. But this is not inevitable. Some countries have distribution chains that are independent of producers and refiners; and in countries which do not have refineries, distribution is undertaken by either local or foreign oil companies. Oil has collected in pools and seeps for thousands of years. The Chinese are recorded as having extracted oil from wells 800 feet deep through bamboo pipes in 347; they used it to evaporate brine and make salt. American Indians used to put it to medicinal uses. Persians, Macedonians and Egyptians used tars to waterproof ships. Babylonians used asphalt in the eighth century to construct the city’s walls, towers and roads. But the easily available oil was not put to any mass use because the crude itself was not a good fuel; it gave out much soot and smoke. A distillation process using a retort was invented by Rhazes (Muhammad ibn Zakariya Razi) in Persia in the 9 th century; liquid heated in it vapourized, passed through a curved spout and condensed in another container. The process could be used to make kerosene; but it was more often used to make alcohol and essence of flowers for perfume. It was a batch process, its fuel consumption was high, and it was not equally efficient at distilling kerosene from all crudes. A more efficient and reliable distillation process came out of a series of inventions after 1846. The last invention was the invention of oil fractionation in 1854 by Benjamin Silliman, a professor of science in Yale. It used a vertical column which separated components more efficiently, and which could be used continuously. Oil was first produced in Titusville, Pennsylvania (USA) in 1859 by one Edwin L Drake, who refined it into kerosene, which was then used as an illuminant. Electricity did not emerge as an illuminant till the Edison Electric Light Company was founded in 1878. Well into the 20th century, kerosene, gas and electricity continued to compete as illuminants. Whilst the use of gas as an illuminant has virtually disappeared, a large population, especially in India, continues to use kerosene as illuminant. 1
  • 6. The invention of the motor car by Karl Friedrich Benz in 1885 created a market for petrol, a new refined product (petrol is called Benzin in Germany, but is not named after Karl Benz). In 1898, Rudolf Diesel invented an engine in which oil was ignited by compression; the diesel engine he invented came to power larger vehicles, principally trucks and buses. Diesel engines used a different fuel, which was named diesel oil. After this, the production and use of motor vehicles spread rapidly in the United States, especially after 1908 when Henry Ford began mass manufacture of his Model T; and petroleum and diesel oil became the most important refined products, first in the US and progressively across the world. However, only a certain proportion of crude oil can be converted into motor fuels. The demand for kerosene, the original distillate extracted from crude oil, has gone down with the spread of electricity. So other refined products have been developed, and non-vehicular uses developed for them. Some of the products differ little from motor fuels; for instance, naphtha, extensively used to make nitrogenous fertilizers and chemicals, is little different from petrol; and jet fuel is very similar to kerosene. Thus, refineries find markets for their products in many industries other than motor transport (Appendix-table C4). The Industry in India India imports three-quarters of the crude it refines (Appendix-table D1). It exports refinery products (Appendix-table E2); its net exports are roughly ten per cent of production. The government operates an elaborate set of cross-subsidies to insulate domestic from international prices; such cross-subsidies have serious effects on the finances of the Indian companies (Appendix-table I2) involved, and influence competition amongst them. The oil companies, both public and private, are so large a part of the economy that the cross-subsidy regime cannot be sustained in all circumstances; sooner or later, the government has to bring domestic prices closer to international prices. Hence the state of competition in the international market and international prices are important for the domestic market. In Section II, which follows, we give an introduction to refinery technology, products, and the markets they serve. In Section III, we briefly describe the global exploration, production and refining industries. In Section IV, we describe the Indian market structure in terms of the companies operating in it, their products and markets. In Sections V, VI, VII and VIII, we outline the market structure in exploration and production, user industries, refining and gas respectively. In Section IX, we turn to the major barriers to competition and to the steps that need to be taken if greater competition is to be introduced in the domestic market for refined products. 2
  • 7. II Refinery Technology and Products This section provides a brief overview of the technology and production process. An understanding of these issues is critical as it helps understand industry structure. Crude oil is a liquid mixture of hydrocarbons – chemical compounds consisting roughly of six parts of carbon and one of hydrogen, both of which are fuels; it generally also carries small quantities of sulphur, salts, metals, oxygen and nitrogen. It was formed from organic remains accumulated undersea and eventually trapped in sedimentary rocks; these rocks are where crude oil exploration is concentrated. Generally the oil is compressed, and gushes out if a pipe is pushed into an oil-bearing trap. But as it is extracted, the pressure diminishes, and it is often artificially reinforced by injection of air or water into the reservoir to push up the oil. Crude oil contains hydrocarbons that vary in their boiling point; refining is a process in which crude oil is heated in a vacuum until it evaporates and then allowed to rise up a column. Different hydrocarbons liquefy at different temperatures and can be collected at various heights in the distillation column. In the basic refinery process, crude is heated to 600ºC by injection of superheated steam and pumped in at the bottom of a vertical distillation column. As the vapour rises up the column, it cools. The column has trays at various heights with holes. As the vapour cools, fractions with different boiling points liquefy, collect in the trays and are drained off; products with high boiling points rise to the top, while products with low boiling points collect on lower trays. The principal products, with their approximate boiling points, are petroleum gas (20ºC), naphtha (40ºC), petrol (70ºC), kerosene and jet fuel (120ºC), diesel (200ºC), lubricant (300ºC), and furnace oil (370ºC); solid petroleum coke collects at the bottom after the liquid fractions are removed. The proportions in which these products come out vary to an extent with the crude; crudes are classified as light or heavy according to the proportion of light products. But the balance of demand and supply for the products is such that the prices of furnace oil are much lower than those of light products such as petrol, kerosene and diesel oil. In August 2008, international prices of residual fuel oil ranged from $2.29 to $2.48 a gallon; the corresponding range was $2.68-3.05 for petrol, $3.06-$3.29 for diesel oil, and $3.18-$3.38 for jet fuel. So other technologies are employed to crack, alter or recombine molecules and make lighter hydrocarbons from residual fuel oil. The principal products obtained from the primary refining and cracking processes are (see Appendix - table B5 and C1 for product-wise production and consumption): Liquefied petroleum gas (LPG), mostly a combination of butane and propane. It is heavier than air, and liquefies under pressure. It is used as a household cooking fuel, refrigerant, and vehicular fuel; 4 million vehicles are estimated to be powered by LPG in the world. Petrol is used to fuel internal combustion engines, mainly vehicular. Its early use as a killer of lice and their eggs has completely disappeared. Naphtha is used to make additives for high-octane petrol, and to make polymeric plastics and urea, a nitrogenous fertilizer. Aviation turbine fuel (ATF) is the fuel used in propeller planes. It is akin to petrol. Kerosene, also known as paraffin, is used as an illuminant and cooking fuel in India and other poor countries, and as a space heating fuel in industrial countries. Jet fuel, used in jet planes, is closely akin to kerosene. High-speed diesel oil is used in engines running at 750 revolutions per minute (rpm) or more. It is mostly used in diesel-powered vehicles Light diesel oil is used in diesel engines running at lower speed – mainly irrigation pumps and generation sets. 3
  • 8. Furnace oil is made by diluting residual fuel oil from refining with middle distillates such as diesel oil. It is used in boilers, bunkers, heaters, furnaces, or as fertilizer feedstock. Low-sulphur heavy stock (LSHS) is a variant of furnace oil. Lubricating oil consists of greases and viscous oils used to lubricate moving parts in industry, automobiles, railway engines and carriages and marine engines. Paraffin wax is used as an electrical insulator, for heat storage and in thermostats. Asphalt is a black thermoplastic product that is used to make roads and sometimes for waterproofing. It is similar to tar, which is made from coal. Asphalt is also found in natural form; it was used to waterproof Egyptian mummies. Petroleum coke is mostly used as fuel, but is also used to make electrodes and dry cell batteries. Some petrochemicals are produced in large enough bulk to take a significant proportion of refinery products: the world consumed 345 million tons of hydrocarbons in 2004 to make 310 million tons of petrochemicals. Most of the hydrocarbons are first turned into one of three intermediates - ethylene, propylene and aromatics – before being converted to other products. Of the latter, plastics accounted for 225 million tons, and fibres for 38 million tons; solvents, detergents and synthetic rubber accounted for most of the rest. 4
  • 9. III Global Oil Industry In the early years of the industry, oil or gas seeped out of the earth in many places; elsewhere it was discovered by accident while drilling for water. But such easy discoveries are long gone. Undiscovered oil is all underground, and oil exploration today uses considerable instrumentation – gravimeters, magnetometers, seismic reflectors and refractors – and stratigraphy, which is essentially correlation of available geological data. The data obtained are correlated to guess the location of rock formations and identify those that are most likely to contain hydrocarbons. Then rigs are used to drill into those formations. Drilling costs much more than geological tests; so oil companies invest heavily in geological investigation. Oil production requires drilling a well into land or seabed. Land usually belongs to someone; if it is not privately owned, it belongs to the government. Similarly, maritime countries claim ownership of the continental shelves along their coastlines. If someone wants to explore for oil, he has to get permission to drill. If he finds oil, he will normally want first right of exploitation. So it is normal for explorers to make an agreement with the owner, called a concession, which lays down the rights of the concessionaire and the payments he would make for them. In the early years, when oil developments were small, it was generally enough to get a concession from a private owner or a number of neighbours. In the US, there were large unoccupied areas where companies could drill without anybody’s permission. But as oil is came to be extracted from deeper formations, investment went up, and exploration passed into the hands of companies which could raise capital. Also, a large area of concession became necessary to avoid disputes with neighbouring concessionaires. Such large areas required the intervention of governments. In the early concessions, governments played the role of landlords, and generally levied a royalty per barrel of oil extracted. For instance, the Shah of Persia gave a concession in 1901 to William D’Arcy, a rich Englishman, to prospect for oil in most of Iran for 60 years, for which he was promised £20,000 in cash, £20,000 in shares of the oil company and 16 per cent of profits. Standard Oil of California negotiated a concession with the King of Saudi Arabia in 1933. 5
  • 10. Table 1: Top twenty countries by oil consumption, 2007 Refining GDP PPP Consn Output Exports Imports Reserves Energy intensity Country capacity $trn2005 Million barrels per day Trillion barrels Mbd/$trn USA 13.8 20.7 7.6 1 13.2 17 22 1.5 China 7 6.5 3.6 0.4 3.2 5.8 16 0.9 Japan 4.2 5.6 0.1 0.1 5.4 4.5 1.3 Germany 2.8 2.7 0.2 2.1 2.3 1.0 Russia 2.1 2.5 9.4 7 0.1 5.4 74 1.2 India 3.1 2.3 0.8 0.4 2.1 2.5 6 0.7 Canada 1.2 2.1 3.1 1.6 1 2 179 1.8 South Korea 1.2 2.1 0.6 2.3 2.6 1.8 Brazil 1.8 2 1.6 0.3 0.4 1.9 12 1.1 France 2 2 0.7 0.5 1.9 2 1.0 Mexico 1.3 1.9 3.4 1.8 0.2 1.5 12 1.5 Italy 1.8 1.8 0.1 0.5 2.2 2.3 1.0 Saudi Arabia 0.6 1.8 9.5 7.9 2.1 263 3.0 United Kingdom 2.1 1.8 2.1 1.5 1.1 1.8 5 0.9 Spain 1.4 1.6 0.3 0.1 1.6 1.4 1.1 Iran 0.8 1.5 4 2.5 1.6 133 1.9 Indonesia 0.8 1.2 1.1 0.5 0.4 1.1 5 1.5 Netherlands 0.6 0.9 0.1 1.4 2.3 1.2 1.5 Thailand 0.5 0.9 0.2 0.9 1.8 Australia 0.7 0.9 0.5 0.1 0.5 0.7 1.3 The rest 15.4 19.4 32.1 20.3 7.7 8.3 1.3 World 65.2 82.2 80.5 48.5 47.7 68.9 1.3 Std deviation/Mean 1.32 1.42 1.80 1.89 1.23 1.12 1.33 0.36 Sources: Oil: NationMaster.com. GDP PPP: World Bank These concession agreements gave a relatively small share of the profits to the governments of oil-producing countries. But over the years, they either took shares in the concessionaire companies or nationalized them. By 2007, 77 per cent of oil production was in governments’ hands; their share of reserves would be even higher, since the industries of countries with the largest reserves are all nationalized. Table 1 gives production, consumption, trade and reserves of the top 20 consumers of oil. The figures are not entirely accurate, but they are good enough for the broad conclusions we seek. The 20 countries account for three-quarters of global consumption; the remaining 186 countries account for only a quarter. The US accounts for a quarter and the next five countries for the next quarter. These twenty countries also account for three-quarters of the world’s GDP (at purchasing power parity; that is, calculated at the same prices for all countries). It would thus seem that income is a major determinant of oil consumption. It is, but oil intensity is equally important. The last column shows oil consumption per unit of GDP. It tends to be high in oil-producing countries, especially if they have extreme climates like Saudi Arabia, Iran and Canada. It is low in developing countries like India and China. Amongst industrial countries, some like Britain, France and Germany have brought down oil intensity considerably. Many countries tried to increase energy efficiency after the first oil crisis of 1973; some did so more effectively than others. The top 20 countries produce three-fifths of the world’s oil. This is because the biggest consumers include most of the biggest producers – Saudi Arabia, Russia, the US, Canada, Mexico, Iran and Indonesia: oil producers tend to consume relatively more oil. Naturally, they are oil exporters as well. That is why the top 20 consumers account for three-fifths of the world’s oil exports. 6
  • 11. But being the largest consumers, they account for five-sixths of the world’s oil imports. And they account for seven-eighths of the world’s refining capacity. Oil refineries are more often sited close to consumption centres; so consuming countries have a larger share of refining capacity than of oil production. The ratio of standard deviation to mean confirms these conclusions. Production and exports vary most across the 20 countries. Consumption varies much less, and variability of imports is even less; the variability of both is comparable to the variability of GDP at purchasing power parity. Refining capacity has the least variability, and is most evenly spread across the countries. (Variability of reserves is also low; but this is because nine of the 20 countries have reserves close to zero.) Table 2: Top twenty countries by natural gas consumption, 2006 World Natural Gas Production, Most Recent Annual Estimates, 2006 (Trillion cubic feet) Country Output Wasted Reinjected Marketed Dry gas Imports Exports Consn United States 23.5 0.1 3.3 19.4 18.5 4.2 0.7 21.7 Russia 23.2 0.0 0.0 23.2 23.2 1.8 8.4 16.6 Iran 6.0 0.4 1.1 4.4 3.8 0.2 0.2 3.8 Germany 0.7 0.0 0.0 0.7 0.7 3.3 0.4 3.5 Canada 7.8 0.1 0.5 7.2 6.5 0.3 3.6 3.3 Japan 0.2 0.0 0.0 0.2 0.2 3.1 0.0 3.2 United Kingdom 3.0 0.1 0.0 3.0 2.8 0.7 0.4 3.2 Italy 0.4 0.0 0.0 0.4 0.4 2.7 0.0 3.0 Saudi Arabia 3.0 0.0 0.0 3.0 2.6 0.0 0.0 2.6 Ukraine 0.7 0.0 0.0 0.7 0.7 1.9 0.0 2.6 Mexico 1.8 0.1 0.0 1.7 1.7 0.4 0.0 2.2 China 2.1 0.0 0.0 2.1 2.1 0.0 0.1 2.0 Uzbekistan 2.2 0.0 0.0 2.2 2.2 0.0 0.4 1.8 France 0.1 0.0 0.0 0.1 0.0 1.8 0.0 1.8 Netherlands 2.7 0.0 0.0 2.7 2.7 0.9 1.9 1.7 UAE 2.6 0.0 0.6 1.9 1.7 0.0 0.3 1.5 Argentina 1.8 0.0 0.0 1.8 1.6 0.1 0.2 1.5 India 1.1 0.0 0.0 1.1 1.1 0.3 0.0 1.4 Thailand 0.9 0.0 0.0 0.9 0.9 0.3 0.0 1.2 Spain 0.0 0.0 0.0 0.0 0.0 1.2 0.0 1.2 All others 44.0 2.5 8.7 32.8 30.5 9.3 14.9 24.8 World Total 127.8 3.4 14.3 109.3 104.0 32.6 31.6 104.4 Source: US Energy Information Administration Table 2 summarizes production, consumption and trade in natural gas for 2006. Incidentally, a barrel of oil has the energy equivalent of 6000 cubic feet of gas; so the 2006 global gas consumption of 104.4 trillion cft of gas comes is equivalent to 47.7 million barrels per day of oil – more than half the oil consumption given in Table 1. As will be seen, 2.7 per cent of the gas was flared or vented, and 11.1 per cent was reinjected into oilfields. The remaining 109.3 tcft contained other gases besides methane, liquid hydrocarbons and water; its methane equivalent was 104 tcft. Gas production and consumption show similar concentration to oil. One major difference is that Russia is the foremost producer, consumer and exporter of gas. West European countries are large importers; they import gas from Norway and the Netherlands, which extract North Sea gas offshore, as well as from Russia. World gas reserves on 1 January 2005 were 180 trillion cubic meters or 6300 trillion cubic feet; 70 trcm or 39 per cent of them were offshore. Two-thirds of them belonged to three countries – Russia (26 per cent), Iran (15 per cent) and Qatar (14 per cent). Apart from natural gas, there are estimated to be 100-260 trcm of coal-bed methane, 402-442 trcm of tight gas (gas trapped in 7
  • 12. dense sands), 42-45 trcm of shale gas and 13,000-24,000 trcm of hydrates (methane trapped in frozen water molecules)1 . These, in brief, are the production and market structures with which the Indian oil industry is necessarily connected because of its dependence on imports of crude as well as refined products. Oil production is extremely unequally distributed. Oil importing countries have to get oil from producers since the international wholesale market is not large enough to supply large consumers. Oil production is extremely unequally distributed, and oil exports even more so. The only countries with sizeable surpluses of oil are those in the Middle East – Saudi Arabia, Iran, Kuwait, Bahrain, and when its oil production facilities are restored, Iraq – and Russia. North Sea Oil, extracted by Norway, Britain and Netherlands, is mostly consumed within Western Europe; and Canadian and Mexican oil goes to the US. There is no single market in oil. There are three types of oil distribution arrangements. First, there are oil markets in the US and Western Europe where common crudes of those regions are traded. Here the pricing is competitive, although some of the suppliers’ market share is large. Next, considerable quantities of oil are sold through contracts of varying lengths. Prices would normally not vary in the life of these contracts, but they would in the long run take market prices as the benchmark. Many contracts provide for revision of prices depending on a change in international market conditions. Finally, a certain proportion of oil is allocated by governments at prices of their choice; these prices may or may not be aligned to international market prices. India, like all big oil consumers, has enough refining capacity (Appendix-table B4). But since the output pattern of refineries seldom matches domestic consumption patterns, there have to be some exports and imports of refined products. As will be explained later, policy-induced distortions force export of some refined products for which there is a market in India – even some that are imported (Appendix- tables D2 & E2). And India has the choice of importing refined products instead of crude. So there are both imports and exports of refined products. 1 Armelle Saniere (2006): Gas reserves, discoveries and production. Panorama 2006. Institut Francaise du Petrole, Reuil-Malmaison, France. www.ifp.com/content/download/56056/1266306/version/3/file/IFP-Panorama06_05- ReservesDecouvProd-VA.pdf 8
  • 13. IV Indian Oil Industry As in the US, China and Iran, oil seeped out of the soil in India as well; British travelers in Assam reported such pools from 1825 onwards. Once fractionation technology was proved in the US, industrial refining of oil became feasible. Assam Railways & Trading Company Limited was registered in London in 1881 to exploit Assam’s natural resources. It struck oil in exploitable volume near Digboi in 1889; at that point it transferred its oil interests to a separate company, Assam Oil Company. AOC built a refinery in Digboi in 1901. AOC was taken over in 1917 by Burmah Oil Company, which later became Burmah Shell and then Shell. Expanded and modernized a number of times, the Digboi refinery continues to function till today. In 1938, AOC took a prospecting licence for 6,290 square miles in Assam. it ceded the concession after the War started in 1939, and resumed it in 1947. AOC struck oil in Naharkotia in 1953. By that time, however, the government of India had become paranoid about foreign ownership of business; there was a long standoff between it and AOC over the exploitation of the new oilfield. Finally in 1959, AOC and the government set up Oil India Limited, a 67:33 joint venture, to exploit the Naharkotiya oilfield; in 1961 it became a 50:50 joint venture. Apart from the small refinery in Digboi, India did not produce refinery products when it became independent in 1947; it depended almost entirely on imports, mostly from Anglo-Iranian Oil Company’s refinery in Abadan. Three companies sold the products through their distribution networks – Burmah Shell, Standard Vacuum and Caltex (now merged into Shell, Exxon and Chevron respectively). Burmah Shell was the largest, with an almost 50 per cent share of the market. In December 1953, the Indian government entered a 25:75 joint venture with Standard Vacuum for survey of 10,000 square miles in West Bengal. The company did some gravimetric and seismic surveys, and drilled seven holes. It found some gas in some which it considered non- commercial; it did not find any oil. The general impression was that Standard Vacuum put little effort into prospecting in West Bengal. This could have been due to the incentive structure. Standard Vacuum had access to cheap crude from the Gulf; if it found oil in India, the government would force it to exploit it. Its cost was likely to be higher, and the company would either have earned lower profit margins or the government would have had to protect domestic refining; Standard Vacuum would have had to negotiate the level of protection. The negotiations between Standard Vacuum and the government on the refinery threw up a large number of issues, many of which are relevant to the policy context today. 2 The following are important. 1. The company wanted a guarantee against nationalization for 30 years, later reduced to 25. 2. It wanted freedom to import crude. The implication was that it did not want to be forced to use domestic oil or oil that the government negotiated access to. 3. It wanted freedom to distribute its refinery products. It wanted to use its own distribution network to sell the products, and did not want to be forced to distribute through other networks, government’s or otherwise. Price fixing is anterior to distribution; the company also did not want price control. It would price its refined products at landed cost of imports (including duty). Import parity would be with Mexican oil and products, not Middle Eastern. Import parity was understood to place a ceiling on prices. 2 A detailed if rather partisan summary of the negotiations between the government and the oil companies – principally Standard Vacuum – is given in H N Kaul , K D Malviya and the Evolution of Indian Oil, Allied Publishers, Delhi. 9
  • 14. 4. It wanted free access to foreign exchange for all practical purposes – crude, freight, equipment, services, dividend remittance, including crude and services bought from its foreign operations – to be valued at international prices. 5. It wanted no import duty to be charged on crude and on equipment not produced in India. There was an import duty on diesel oil; wharfage rates too were such as to give some protection. The company wanted that these levels of protection would not be reduced. It wanted an import duty on petrol equal to the excise duty plus 12 Paise per imperial gallon. Import duties applicable to the company should be no lower than those applicable to its competitors. 6. The tankers that brought in crude should be allowed to be used for coastal distribution of refinery products. 7. There should be no restrictions on local borrowings for equipment, construction and inventories. 8. Its capital investment would be given 10 per cent straight-line depreciation in the calculation of income tax. 9. The company wanted exemption of the Industrial Development and Regulation Act of 1951, which gave the government the authority to control industrial production, expansion and diversification. The government agreed; but Shell and Caltex did not get this assurance. The government also wanted a number of things. 1. It wanted Standard Vacuum to set up a local subsidiary to build and run the refiner. Standard Vacuum was against it for three reasons: (1) The subsidiary would be subject to income tax; (2) it would have to pay sales tax on whatever refined products it sold to the distribution company; and (3) if the government placed controls on dividend payments, the subsidiary would be subjected to them. But eventually it did agree to set up a subsidiary. The government wanted the local subsidiary to issue shares to local shareholders; it issued a quarter of its capital of $6 million to them in preference shares. The other two companies issued non-voting shares to local shareholders. 2. Should India discover oil, the government wanted the Company to promise to use it in preference to imports. The company agreed; price was unspecified. 3. The government reserved the right to impose and vary excise duties, but promised to maintain the existing differentials between excise and import duties. In other words, if it imposed or increased an excise duty, it would increase import duty by at least that much. 4. The government wanted the company to train and employ Indians. 5. The government had agreed at independence to continue pooling dollars with the Commonwealth; at the same time, the British government owed it a large debt, termed sterling reserves, for supplies during the War. So it wanted Standard Vacuum to buy crude and other importables from the Sterling Area as far as possible. The company agreed, since AIOC, the company that produced oil in Iran and Kuwait, was British and would accept Pounds. 6. In the event of the government acquiring tankers, it wanted the company to use them in preference to other tankers. The company agreed, subject to the use of its own tankers and prior contractual commitments. 7. The government wanted the company to give priority to local purchases over imports; the company agreed. The negotiations continued for three years, but no agreement emerged. The oil companies prevaricated. The government suspected that the oil companies were happy with the import of 10
  • 15. refined products from Abadan refinery, which they sold in India at certain and high profits. But after Iran nationalized the Abadan refinery in May 1951, India looked a safer country to operate in. In November, Standard Vacuum signed an agreement with the government to set up a refinery. Burmah Shell and Caltex followed in the next two years. Esso’s 25,000 bpd refinery was inaugurated in Bombay in 1954, Burmah Oil Company’s 30,000 bpd refinery went onstream in Bombay in 1955, and Caltex’s 10,000 bpd refinery went up in Vizagapatam in 1957. The government was frustrated with the experience of negotiations with the three oil companies. In the 1950s, the government took a number of steps to reduce dependence on foreign oil companies. In 1956, it set up Oil and Natural Gas Commission to explore for oil, and brought in Soviet and Rumanian rigs and crews to prospect for oil. The two areas chosen were the Cambay area in Gujarat and the Jawalapuri-Janaur area in what is now Himachal Pradesh. The Soviet crew considered Gujarat more promising, and drilled there first. The first well was spudded on 25 July 1958; on 24 September it struck oil under 150 atm pressure at 7000 feet. Further exploratory drilling led to the discovery of Ankleshwar and Kalol oilfields in 1960, and suggested that the oil- bearing strata extended offshore to what came to be known as Bombay High. Oil from this area was the foundation of ONGC’s emergence as an oil producer. Gas too was found in and off Gujarat, both associated and non-associated. In 1984, the government separated ONGC’s gas business and gave it to a separate subsidiary, Gas Authority of India Limited (GAIL). GAIL built a pipeline from Hazira on the Gujarat coast to Delhi, and supplied gas to government-owned power stations and fertilizer plants on the way. It also set up joint ventures with government oil companies and state governments to supply gas to Bombay and Delhi for transport and domestic fuel, and to Andhra Pradesh for transport. In 1987 it set up Petronet, a joint venture with three other government oil companies, to import LNG from Qatar. Pricing and distribution of public sector gas are entirely decided by the government; there is no element of market in this area.3 The Soviet surveys had shown the oil-bearing structures of Gujarat extending into the sea in 1964-67, but the Soviets did not have the technology for offshore exploration or production. In 1974, a Japanese survey ship leased by ONGC discovered the prolific Bombay High offshore field. It has been the mainstay of ONGC’s business since then. Once oil was discovered in Gujarat, the government had to think about how to exploit it. In 1958, it set up Indian Refineries to set up refineries. In 1959, it set up Indian Oil Company to undertake distribution. The two were later merged into Indian Oil Corporation. IOC was given a monopoly of imports of refinery products; with that, it soon overtook the three foreign companies in distribution. Thus the foundations of the government-owned oil industry were in place by 1961. A 2mtpa refinery to process Gujarat crude was built with Soviet help in Koyali, Gujarat in 1966. But Gujarat crude could not meet the growing national demand. So in the 1960s, the government took to building coastal refineries in joint ventures with foreign companies. The 2.5 mtpa Cochin refinery came up in 1966 with investment from Phillips Petroleum, the 2.5 mtpa Madras refinery went on-stream in 1969 with participation from AMOCO and National Iranian Oil Company, and the lubricants plant of Lubrizol India came up in Bombay in 1969 with participation of Esso.4 In 1960, US President Dwight Eisenhower introduced oil import quotas favouring Mexico and Canada and discriminating against Middle Eastern producers and Venezuela. This upset the latter. In September 1960, Iraq, Iran, Saudi Arabia, Kuwait and Venezuela got together to “coordinate” policies and formed the Organization of Petroleum Exporting Countries. The organization was just a talking club for ten years. But in 1970, OPEC resolved to raise its members’ share of oil revenue to 55 per cent, and began negotiations with oil companies to effect the increase. There followed a spate of measures by which Middle Eastern oil producing countries nationalized or imposed revenue shares on oil producing companies, or cancelled concessions. Oil concessions were nationalized by Algeria in 1971, Iraq in 1972 and Kuwait in 3 Cf Mike Jackson (2005): Natural gas sector reform in India: case study of a hybrid market design. Stanford Program on Energy and Sustainable Development. Working Paper 43, July. 4 C S Venkataratnam and Anil Verma, Challenge of Change, Allied Publishers, Delhi 1997. 11
  • 16. 1976-77. Libya nationalized a number of oilfields held by foreign companies between 1971 and 1976, and took an 85 per cent share onshore and an 81 per cent share in the oilfields of others. (Iran had nationalized the British-owned Anglo-Iranian Oil Company in March 1951.) The Saudi King threatened Arabian American Oil Company (Aramco) with nationalization with 1950 and got a half-share in profits. He acquired a 25 per cent share in Aramco in 1973, increased it to 60 per cent in 1974, and took full ownership of the company in 1980. Kuwait nationalized its oil industry in 1975, Bahrain took a majority share in its concessionaire oil company in 1980. After the 1967 war between Israel and Palestine, Arab members of OPEC formed Organization of Arab Petroleum Exporting Countries. Israel defeated Egypt and Syria in the Yom Kippur war in 1973. Enraged, OPEC raised the price of its crude from $3 to $12 a barrel, and made it effective by cutting supply. After this, oil producing countries realized that they could raise their revenue by raising the price of their crude. So they started increasing prices without coordination. While the nationalizations of the 1970s did not immediately disrupt the relationships between oil producing countries and their licensee foreign companies, they introduced extreme uncertainty in the companies’ business environment. Their attempts to cope with this uncertainty changed the world oil industry in three major ways. 1. The companies began to explore for oil in more difficult environments such as the North Sea, Gulf of Mexico, and the Caspian Sea. Exploration in these fields was more expensive. So smaller companies failed or were bought up; the industry got more concentrated. 2. The governments of the US and Britain did not control oil produced in their jurisdictions in the way the Middle Eastern oil producers did. So oil produced in Texas, Gulf of Mexico and the North Sea began to be traded on commodity markets. For the first time, an open market in crude emerged. Quotations for crude such as Brent 3. Till the 1970s, refineries were tailored to a single crude source, and generally produced a limited set of products. The uncertainty of crude supply led refiners to design or modify refineries to take a broader variety of crudes and make a greater range of products. Not all refineries did; refineries are quite durable, and many refineries remained unchanged. Many closed down. But catalytic cracking technology developed to make refining more flexible.5 As oil producing countries increased their share of profits and oil at the expense of foreign oil companies, the oil supplies they controlled went up and those of oil companies went down. In the circumstances, the main reason for having foreign oil companies operate refineries in India – namely, their access to crude – disappeared. In 1976, India nationalized the three refineries owned by Shell, Caltex and Esso. In 1981, the government bought out Burmah Oil’s 50 per cent stake in Assam Oil Company. With the nationalizations, the entire Indian oil industry passed into government hands, and came to be run as a part of the government. In 1977, the government introduced an Administered Price Mechanism, to be operated by an Oil Coordinating Committee. The ministry of petroleum fixed so-called retention prices designed to give oil producers 15 per cent and refiners 12 per cent on their net worth. And it set administered prices at which products were sold to consumers. The difference between the revenue and dues of an oil company went its account with OCC. So overall, the price level was cost-plus; but the government could cross-subsidize individual products at will. It was the oil companies’ practice to construct their own petrol pumps and give them to dealers to run. Under the private companies, dealerships were given to trusted associates, and they became a part of the companies. After nationalization, the government decided to set up a fairer system. In 1983 it set up four Oil Selection Boards; each board had a retired judge and one other member. An SC/ST member was added in 1993. Oil pumps made good profits with little investment on the part of the dealer and at low risk. So many more people wanted pumps than 5 Jerome Davis, The Changing World of Oil: An Analysis of Corporate Change and Adaptation. Ashgate, London, pp 1-10. 12
  • 17. could get them, and recommendations and corruption were rampant in their allocation. In January 1996, a PIL led to a court enquiry, which revealed that the personal assistant of Satish Sharma, the petroleum minister, got oil companies to give pumps to relatives and friends of politicians, and charged others money. The same scandal continued under the ensuing BJP government, and blew up in 2002; Prime Minister Vajpayee cancelled all the 3850 allotments made in the previous two years. There has been no public scandal since then, but that does not necessarily mean that the system works any better now. 13
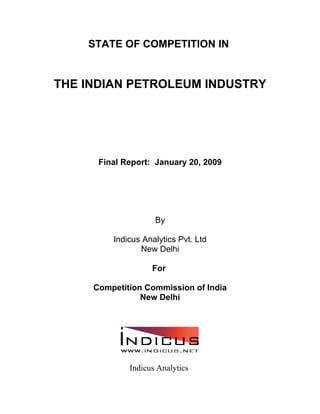
  • 18. V Competition in Exploration From 1979 onwards, the ministry of Petroleum began to invite international bids for exploration and development from time to time. Nine rounds of bidding were held till 1997; 32 blocks were awarded for exploration and 30 for development. In 1997 they produced 3 mtpa of crude and 7 mcmd of gas. But since refining and distribution were government monopolies (Appendix-table B1), the licensees had to sell their oil and gas to the government. Negotiations with the government were protracted and involved each time. So the rounds attracted little international interest. In the meanwhile, the government monopolies could not increase production and refining capacity to keep up with demand (Appendix-table A2). Between 1985-86 and 1995-96, the import ratio went up from 31 to 44 per cent for crude and from 7 to 27 per cent for refined products. The policy of government ownership and control of oil was a part of a socialist approach which applied to all economic policies. These policies became discredited when a serious balance of payments problem arose in 1989-91; a new government elected in 1991 overhauled many of the policies. It appointed two committees in 1994-95: one under the chairmanship of U Sunderarajan was asked to examine replacing administered by market-determined prices, and a strategic planning group on restructuring of the oil industry (R Group) was asked to look at the structure and organization of the industry. The story of which of their recommendations influenced policy and how far is convoluted; but the government made the following major policy changes. Fig 1 Oil output and imports 180 160 140 120 Million tons 100 80 60 40 20 0 1972-73 1976-77 1980-81 1984-85 1988-89 1992-93 1996-97 2000-01 2004-05 Crude output Crude imports Product output Product imports The government announced a New Exploration Licensing Policy in 1997, which differed from the old one in the following respects.6 1 Bidders were to compete on cost recovery – they could ask for up to 100 per cent – and on their share of profit petroleum. 2 They were free to sell their share of the oil to anyone within the country. 6 R K Narang, Ardhendu Sen and Leela Srivastava, Background paper: Issues in deregulation of oil and gas. In Leela Srivastava and S K Sarkar, Transition to a Liberalized Environment: Experiences and issues in Liberalization, Teri Press 1999, pp 411-426. 14
  • 19. 3 Conditions regarding minimum expenditure, required partnership with government oil companies, and signature, discovery and production bonuses were scrapped. 4 Tax provisions were defined, and their stability promised. There would be a 7- year income tax holiday, exemption from customs duty on exploration and drilling equipment, royalty was fixed at 10 per cent except for onshore crude which would pay 12.5 per cent, 5 per cent royalty on discoveries in water deeper than 400 meters, and development expenditure could be amortized over 10 years. 5 The licence could be assigned to third parties under conditions. 6 A Conciliation and Arbitration Act passed in 1996, based on the model set by United Nations Commission on International Trade Law, would apply to disputes. 7 Bidders were required to give the Directorate of Hydrocarbons, which was set up in 1993, the results of their surveys; in case they abandoned the concession, the results would become available to subsequent bidders. Under the New Exploration Licensing Policy, six rounds were held and 162 production-sharing licences were given till 1 April 2007, against 28 before the introduction of NELP. Of the licences, 77 per cent were offshore, and 53 per cent were to government companies. The sedimentary area explored went up from 50 per cent in 1995-96 to 85 per cent in 2006-07 of the total 3.14 square kilometers (1.79 million onshore and up to 400 meters offshore, 1.35 million deep-water beyond 400 meters). Well explored area went up from 15 to 20 per cent, poorly explored area from 17 to 21 per cent, and area being explored from 18 to 44 per cent. These figures suggest that many licensees were sitting on concessions because they did not see a satisfactory path to profitable exploitation of discoveries, or were negotiating such a path. A seventh round of NELP was opened on 1 April 2008. In July, six multinational companies (Chevron and Conoco-Philips of the US, Britain's BG (British Gas) and BP (British Petroleum), Canada's Niko and Anglo-Dutch Shell) wrote to the government to say that they would not bid if the regulatory framework remained uncertain and the government did not adhere to contractual arrangements. Instances of such were (1) the Enron affair, in which Maharashtra government reneged on a contractual obligation to buy electricity at a fixed price (it was saved from litigation by Enron’s liquidation on account of fraud committed by the company in its home country, US), (2) the government’s taking away the contractual right of the owners of the Panna-Mukta fields – Reliance, British Gas and ONGC – to sell gas, and forcing them to sell it to GAIL at a price of its choosing to GAIL (the exploration contracts embodied freedom of sale and pricing), and (3) DGH’s renegotiation of conditions embodied in the model production sharing contracts issued at the time of announcement of earlier rounds after bidders had invested money and found oil or gas. The companies were also of the view that DGH, which was supposed to be a regulator, acted more like an arm of the government. The government did not respond to the six companies’ concerns; consequently, they did not take part in the bids. In the event, of the 57 blocks on offer, 12 received no bids, and 19 received only one bid. Of the 45 winning bids, one was rejected by Cabinet Committee on Economic Affairs, resulting in 44 production sharing contracts. ONGC and its associates got 20 concessions. Thus, the round confirmed a decline in interest amongst international companies, especially experienced ones. There is a more general disincentive to bidding in the fact that the bidders have to sell their production in India, which remains a market dominated by government companies; it is thus impossible to be sure that the concessionaire would get an internationally comparable price for his output. This is particularly obvious in the case of Cairn Energy, which bought a block in Rajasthan from Shell in 2002 and soon struck oil. The find in Barmer was far from the sea. It could be sold to Indian Oil Coorporation, but negotiations have not borne fruit till now. The crude 15
  • 20. is waxy, and difficult to transport. Cairn has been drilling more exploration wells and raising its estimate of reserves. Now it is planning to lay a heated pipeline to Salaya and export the crude. Table 2: Oil and Gas Reserves on 1st April 2007 (Mtoe) ONGC OIL Others Total Oil 4603 815 629 6047 Gas 1820 290 838 2948 Oil in place 6423 1105 1467 8995 Oil 1313 243 172 1727 Gas 982 151 511 1645 Ultimate reserves 2295 394 683 3372 Source: Directorate of Hydrocarbons It is also probably true of Reliance, which first struck oil in Krishna-Godavari basin offshore, and later gas as well. In 2006, Niko Resources whom Reliance had called in as consultant estimated gas reserves at 1 trillion cbm. Reliance tried to sell the gas to power utilities on the south and east coast, but failed to reach agreement over the price. The power utilities are owned by state governments and make heavy losses. So their ability to pay is in doubt. Thus, private entry was allowed in oil exploration and production in the 1980s, and private firms have discovered substantial oil and gas resources. But none has used them to enter domestic refining and distribution. This is because deregulation of the downstream industries has not kept pace with that of exploration. Exploration and production costs vary enormously according to the location and depth of hydrocarbons and the size of reserves. There is a suggestion that the absence of competition makes it possible for the oil concessionaires to take bribes from suppliers of equipment and services in return of overpayments and. to overestimate investment costs. The chief safeguard against this possibility is The Directorate of Hydrocarbons, whose block management committee approves all field development plans. When it awards E&P contracts, it looks at both costs and at the technological capacity of the applicant and his ability and willingness to save time, do a thorough exploration and bring reserves into production. Besides its own expertise, its comparison of competing bids would help it make a judgment on individual proposals. The expertise it acquires in evaluating bids should give it capacity to supervise PSUs’ activities also. It is authorized to hire outside experts and consultants when necessary. A suspicion that ONGC’s costs had been padded arose in 2006. In April 2007, the allegation that Reliance Industries padded costs was made by the Communist Party of India (Marxist). ONGC pointed out that DeGolyer and McNaughton, an outside consultant, did a third-party audit of all its projects. Reliance got a third-party audit done by Gafney, Cline and Associates when the original discoveries were made, but was asked to get a new audit done. There are two other authorities that check the proposed costs of public enterprises. They would be approved by the parent ministry. It does not have the expertise to make an informed examination; but that does not prevent it from examining the costs. It is also within its purview to take the help of international experts. The other is the Comptroller and Auditor General. He only makes an ex post examination long after the costs are incurred. He reports to Parliament, which can make the government take action on his report. Parliament committees obtain a reply to CAG’s findings from the government, but there is no further action. Thus the safeguards within the government against overstatement of costs are not very effective. What is crucial here is that there should be multiple competitors for concessions. This requires expertise in formulating invitations for exploration contracts. From the fact that most exploration contracts have gone to a handful of Indian companies – mostly government, some private – it can be inferred that there is little competition for them. The reasons are also clear: that the government restricts the discoverer’s right to sell any oil or gas he finds in the world market, and 16
  • 21. that the dominance of public sector undertakings in the domestic refining industry makes it impossible for a discoverer to get a fair market price for his oil. Hence if there is padding of costs, it is due to the restraints on competition placed by the government of India. 17
  • 22. VI Competition in user Industries A major entry barrier into oil refining and gas is lack of competition in major markets for refined products. Government dominance of user industries and the losses it forces them to make limit their capacity to pay internationally comparable prices. Some of the user firms also suffer from endemic liquidity problems on account of their poor profitability, and delay payments for feedstock. Two such industries are important: electricity, which in other countries is an important market for gas and furnace oil, and fertilizer, whose preferred feedstocks are gas and naphtha. Overstatement of costs is not very effective. The electricity industry is dominated by electricity boards, which are essentially departments of state governments and have no operational freedom. The prices they charge are decided by the governments, and are fixed at unremunerative levels. As a result, they depend for investment funds on state governments, which are themselves in no great financial shape. Owing to their unprofitability, they are often short of liquidity and delay paying suppliers of fuel. Till 2004, they had run up enormous debts to coal and oil companies. Then the central government forced state governments to settle the debts as part of more general financial strengthening. The centre has the power and influence to force state governments to pay. Private companies would not be able to do so. Hence the electricity boards remain unpromising customers for gas or furnace oil produced by private companies. The centre tried to break this impasse by passing the Regulatory Commissions Act in 1998. It appointed a Central Electricity Regulatory Commission and persuaded a number of states to set up then own ERCs. It also passed a new Electricity Act in 2002 which envisaged introduction of competition from the private sector. Under its persuasion, a number of states corporatized their electricity boards and separated generation and distribution. But despite all this activity, electricity pricing practices did not change. Electricity boards continued to be financially weak and hence poor customers for hydrocarbon products. As long as they remain unable or unwilling to pay, enterprises of the central government, in gas, oil and electricity, will have an advantage in collecting their dues from state electricity boards as against any private competitors that may come up. The fertilizer industry produces nitrogenous, phosphatic, compound and mixed fertilizers. Of these, only nitrogenous fertilizers require hydrocarbon feedstocks; the normal feedstocks are gas and naphtha, which are first converted to ammonia and then into its compounds. Phosphatic and complex fertilizers were decontrolled in 1992, and nitrogenous fertilizers with low nitrogen content in 1994. But urea, which constitutes 85 per cent of nitrogenous fertilizer consumption, remains under control. It is administered by the Fertilizer Industry Coordination Committee, which is constituted entirely of central government secretaries except for two representatives of private plants. FICC operates a retention price scheme. It collects output and cost figures from all plants, adds 12 per cent return on capital, and thereby arrives at the total realization required. It divides the realization by the nitrogen output to get nitrogen price, which is then used to derive the prices of various fertilizers. The difference between the prices and the costs is given to plants as subsidy or taken away as tax. A similar exercise is done to calculate total transport costs to the farmer, which are then so distributed between plants that farm gate price of urea is the same across the country. While input costs rose, the ministry of fertilizers has hesitated to raise prices. The result is that it is paying an enormous fertilizer subsidy. To keep the subsidy down, it has endeavoured to keep input prices as low as possible. This is one reason why the government has tried to commandeer gas supplies from private producers and reneged on the freedom of pricing promised to them. The domination of the electricity and the fertilizer industries by the central and state governments, the losses they make and the consequent pressure to keep input prices low make the two industries unattractive as customers. This is not so material to public enterprises whose losses are borne by the government, but their ability to bear losses gives them an advantage against 18
  • 23. power plants, and discourages private investment in hydrocarbons. Unless electricity and fertilizer markets are decontrolled, this handicap of private hydrocarbon firms cannot be removed. 19
  • 24. VII Competition in Refining Industry Refinery licences were given to the Birla group (jointly with Hindustan Petroleum Corporation, a subsidiary of IOC) in 1988, the Essar group in 1993, and Reliance Industries in 1996. The Birlas’ Mangalore refinery was ready by 1999; it could not be started because HPC, whom the Birla group had taken in as partner for its access to market, refused to lift the products. Finally the Birla group sold off its 37.38 per cent stake to ONGC in 2003. The first phase of the Reliance refinery in Jamnagar was ready in 1999. Although Reliance got a licence for petrol pumps in 2002, it has sold only a small proportion of its petrol and diesel output through pumps; it has exported the bulk. In 2007, it sought and got 100% EOU status. It gave Reliance duty-free access to crude provided it balanced its total imports and exports. The Ruias’ Vadinar refinery went onstream in November 2006. The delays were partly due to their legendary lack of finance; but they were also not in a hurry because they could not work out a feasible marketing strategy. Distribution has handicapped growth of private refining, and hence emergence of competition. On 1 April 2002, the government announced the abolition of the Administered Price Mechanism and of the Oil Coordination Committee which administered the price controls. It introduced direct subsidies on kerosene and LPG (Appendix-table H1), and raised taxes on petrol and domestic crude (Appendix-table G7). The petroleum ministry issued retail distribution licences to ONGC, GAIL, OIL, Reliance Industries, Mangalore Refineries, Essar Oil and Cairn Energy. Of the licensees, only Reliance and Essar opened a significant number of pumps (Appendix-table F3). Reliance set up pumps which were shopping centres at the same time. On the highways, they also offered food, accommodation and baths to truck drivers. They sold 410 kiloliters a month on the average in 2005-06, against public sector outlets which sold 140 kilolitres. So although they had only 1432 outlets out of the total 30,000, their share of retail sales was close to 14 per cent (Appendix-table F1). Then, on 27 March 2007, Reliance applied for the status of a 100% export-oriented unit; it got that status in February 2008. In 2007-08, its exports came to 60 per cent of its sales. On 24 March 2008, Reliance announced that it was closing down all its petrol pumps. The reason was that the government was subsidizing petrol and diesel sold out of its companies’ pumps, but did not give the subsidies to private competitors. So retail sales were no longer profitable for Reliance. Essar did not take a public decision to close down pumps; it simply stopped regular supplies to its pumps. As Table 3 shows, its sales in 2007-08 were insignificant relatively to the market. Thus as from May 2008, retail sales of petrol and diesel oil are a government monopoly (Appendix- table F2); there is no competition. One consequence of this lack of competition was the recurring shortage of diesel oil in Tamil Nadu between May and August 2008, when Reliance was exporting it at the same time. Reliance had no petrol pumps any more, so it could not have supplied the market. It could have sold diesel to public sector oil companies, but then it would have breached the conditions of its EOU status. The EOU category, introduced into the trade policy in the 1960s, has outlived its usefulness. While it is reasonable to exempt exports from domestic taxes, there is no reason to make that exemption conditional on minimum exports. It is not certain whether the segregation of exporters and domestic producers was useful when it was tried first; it has outlived its usefulness, and in the Tamil Nadu diesel crisis it proved counterproductive. 20
  • 25. VIII Competition in Gas Industry Automotive fuels have to be reached to vehicle owners; hence oil refining companies cannot do without access to a marketing network. Gas, however, requires an expensive transport network in the form of pipelines; hence gas producers prefer to sell to as few consumers as possible, and prefer large buyers. Where gas has been available beyond industrial needs, it has been piped to households; but such domestic networks have been confined to cities. Unless pipelines of different suppliers get interconnected, there is no competition between them; each has a monopoly of supply to the customers connected to its pipeline. There is only one common carrier pipeline network in India. It has been built by Gujarat State Petroleum Corporation through two subsidiaries – Gujarat State Petronet, whose pipelines connect the cities of Gujarat, and Gujarat Gas, which lays retail connections within the cities. It transports supplies from three sources to Bombay and cities of Gujarat: liquefied natural gas from Qatar that Petronet brings into Dahej, gas supplies from Gujarat Gas, a British Gas subsidiary, which in turn buys gas from ONGC and sells it across Gujarat, and GAIL’s sales in Gujarat. GAIL was incorporated in 1984 to evacuate associated gas from ONGC’s Gujarat oilfields. Its most important gas pipeline is the Hazira-Vijaypur-Jagdishpur pipeline of GAIL which carries ONGC’s gas output from Gujarat to a series of power and fertilizer plants from the Gujarat coast to Punjab. As its gas supply ran short, it also started taking Petronet’s gas imports from Qatar. Assam Gas Company, which is owned by the government of Assam, supplies gas to a fertilizer plant, a petrochemical plant, four power stations, 250 tea gardens, 400 industrial establishments and 20,000 domestic consumers. Reliance, which found considerable gas offshore in the Krishna-Godavari field starting in 2003, has not laid pipelines to evacuate the gas because it has not yet finalized customers. As shown in Chapter VI above, the two industries that are major potential customers, electricity and fertilizers, are owned by the central and state governments. Most of the enterprises in them make losses which are financed by governments; it would be impossible for new private plants to compete with these plants. Since these markets are closed, the only feasible option for Reliance is to sell its output to GAIL at whatever price it can get, and let the government distribute it to plants of its choice. 21
  • 26. IX Conclusion In 2007-08, India’s five largest companies in terms of sales were oil companies. Four out of five were owned by the government. The sales of the sixth – Essar Oil – were negligible. Reliance’s share of sales was 17 per cent of all the oil companies’ sales, but 60 per cent of its output was exported. So it does not require much analysis to conclude that the Indian oil industry is an oligopoly, and that it is dominated by government firms (Appendix-table F1). The retail market for petrol and diesel is almost entirely a government monopoly. This monopoly also affects exploration and production, for as we have seen, a number of companies that have struck oil or gas cannot find a domestic market because of the government’s monopoly of distribution. How can this situation be changed, and competition be introduced? Table 3: India's oil companies' revenues, 2007-08 Company Rs billion Per cent Indian Oil Corporation 2015 34.7 Reliance Industries 1112 19.2 Bharat Petroleum 972 16.8 Hindustan Petroleum 939 16.2 Oil and Natural Gas Corporation 755 13 Essar Oil 6 0.1 Total 5799 100 Source: Company annual accounts. The domestic market is close to a monopoly. All hydrocarbon products are tradeable, although their transport costs vary greatly – highest for gas, lower for crude, and the more valuable a refined product, the lower proportionally are transport costs. So the most expeditious way of introducing competition is freeing imports. There cannot be competition in exploration and production if refining and distribution are concentrated; and there cannot be competition in refining unless crude is freely importable. Hence the first condition for a more competitive market is absence of restrictions on foreign trade. The next condition is tax parity of imports and domestic production. This means that whatever domestic taxes are levied should be applicable to imports as well. Import duties may be levied; but unless there is a reason to protect exploration and production beyond the size to which they would grow without protection, crude imports should be duty-free, so that there is maximum incentive to invest in refining. There will inevitably be taxation of refined products, since some of them are considered inputs into luxuries (e g, aviation fuel and petrol), and are in fact sources of prolific revenue. Duties on domestic production must be matched by equal import duties, so that there is no discrimination in favour of exports. Under competitive conditions, refining adds little value to crude. The tonnage of refined products comes to 90-95 per cent of the crude input; and the throughput of a refinery is so high in comparison to its capital costs that a low average profit margin gives a high rate of return. In 2007-08, a profit margin before tax of 16.7 per cent translated into a return on assets of 15.5 per cent for Reliance; for IOC, a margin of 3.9 per cent translated into a return on assets of 12.3 per cent. IOC was forced by the government to give huge subsidies on sales of petrol, diesel and kerosene (Appendix-table H1); on the other hand, its refineries are older and their historical cost per ton is lower. But even for a highly sophisticated refinery like that of Reliance, the capital- output ratio is close to one; for simpler refineries it would be much lower, and the return on capital would be higher than the margin. Typically, a refinery’s margin might be 10 per cent, and crude might account for 80-90 per cent of its costs. Since some refinery products are considered luxuries and others necessities, taxes on them will be different; and the average tax on refined product will be high. In the circumstances, the tax system can be simplified and competition in refining intensified by not taxing crude at all, and concentrating all taxation on refined products. 22
  • 27. Finally, we come to entry restrictions. Here, the answer is different for exploration and production, and for refining. We shall deal first with exploration and production, but it should be borne in mind that the attractiveness of exploration is closely dependent on the ease of entry in refining and distribution. It is difficult to conceive of completely free entry into exploration because it involves access to land which has to be approved and sometimes organized by the government. So some form of exploration licensing is unavoidable. The high proportion of concessions granted to ONGC would suggest otherwise, but there is no overt discrimination against foreign companies or exclusion of any companies other than on such self-evident criteria as minimum experience and minimum investment. The government’s insistence that discovered oil and gas must be used in India – its implicit export ban – reduces the potential value of finds and probably leads to fewer bids and lower revenue for the government; now that the balance of payments is no longer a policy problem, this domestic use requirement is outdated. We have argued above for duty-free imports of crude. In those circumstances, an export ban or insistence on domestic use makes even less sense. So the only important variable in exploration and production would be taxation of production (exploration can obviously not be taxed). The customary form of taxation here is that the government tax a share of the oil produced – what is called profit oil. If profit oil is zero, the producing company takes all the oil that is produced, and the government gets nothing. The government must be very desperate to produce oil domestically before it takes zero profit oil. This is not the situation in India. At the other extreme, profit oil can be 100 per cent. No oil company would agree to this unless the government paid all costs plus some profit. So this case really comes to the government exploring oil. Exploration does not necessarily imply production; a government may explore simply to get better knowledge of the country’s oil resources. The knowledge would reduce the risk in production, and would get the government better terms when it does decide to produce. At present, the government gives companies exploration licences with the condition that the data the concessionaires collect in the course of exploration must be given to the government; they are deposited with Directorate of Hydrocarbons. Given the fact that there is no urgency to produce, it would be a good idea to separate exploration and production; the government should invest simply in exploration and data collection. When it decides on production, it will then have ready data to sell to potential bidders; it will get more bids, and better terms. So much for exploration. However, it is refining and distribution that require reforms to introduce competition. There is one precondition that is already satisfied and is therefore likely to be ignored: that product standards should be defined and enforced. Oil products are extremely differentiated; different uses require different specifications, some require tight specifications, and non-standardized products can be dangerous in some uses such as aviation. So standards have to be defined and enforced by the government. Such standards will be correlated with the earlier-mentioned commodity taxes. In India, the extreme variation in tax rates creates powerful incentives to pass off a highly taxed product as a less taxed one, and more often, to adulterate products; for instance, it is common to mix divert subsidized kerosene and mix it with high-speed diesel oil. The solution adopted has been to put a dye in subsidized kerosene. That is an ineffective remedy, for the dye does not make kerosene less eligible for adulteration. The correct solution would be to have the same tax on close substitutes, and to subsidize the people intended directly. There is one other condition that would need to be modified. When allowing private entry, the government has insisted that new entrants must set up a minimum proportion of pumps in ‘backward’ or ‘rural’ areas. Ideally, there should be no such condition; if the government wants more petrol pumps in certain areas, it must give them subsidies until they reach a certain minimum turnover. The government has a service tax; it can be applied to petrol pumps, and a cut-off point may be set below which there would be no tax. 23
  • 28. It is possible to introduce competition in distribution alone, without any changes in refining. The first condition for it would be to abolish licensing of pumps. There is no argument for licensing except that captive pumps of oil companies have existed ever since they started selling petrol; there is a strong argument against licensing in India, that it creates rampant corruption, which reaches right up to the minister. Second, there should be free imports of products. There should be no canalization of product imports, and no quantitative restrictions. But distribution requires considerable investment in storage, logistics and petrol pumps. If competition is not introduced in refining, the only competition can come from imports; it will not emerge unless new entrants are assured of continued access to imports for a long period. To ensure a level playing field, domestic tax rates and import duties should be identical, so that the tax burden is the same irrespective of the origin of supplies. This is an argument that applies to all the policy changes suggested here, and not just to taxation. The oil production and distribution chain requires large capital investments whose life runs into decades. If the benefits of competition are to be reaped, the policy regime must be stable for decades, and must in advance be known to be stable. If the government is serious about competition, it must accept and announce self-restraint on its freedom to make and change policies. Finally, transportation affects competition in an important way. For all hydrocarbons, pipelines are the cheapest medium of transport. Differentiation of refined products makes dedicated pipelines for them expensive, but even amongst them, petrol and diesel are consumed in large enough quantities to make piping economical. Currently, all pipelines in India are owned by gas or oil companies, and thus insulate them from competition. If all the pipelines were common carriers and carried oil, gas or products for all customers without discrimination at preannounced prices, refineries and gas-based plants would spread out more evenly across the country, and there would be greater competition amongst them. The case is similar to that of electricity, in which there cannot be competition for the final market unless a transmitter and distributor provides access from every generator to every consumer. One solution that was tried out was to decree that all companies that had pipelines would allocate a certain proportion of pipeline capacity for common carriage. As far as we know, this regulation was a dead letter from the start; there has been no common carriage in India. The best solution now would be to nationalize all existing pipelines and give them to a new company to run as a public utility on a cost-plus basis. The next best solution would be to give all the pipelines of state-owned companies to a common carrier. In gas in particular, competition cannot emerge in the absence of a common carrier. The conclusions we have reached have implications for the Competition Commission. The oil industry has a regulator of sorts in Directorate General of Hydrocarbons. It provides expertise that the ministry lacks and buys such expertise as it does not have (or makes oil companies buy it). But it confines itself to technological issues and avoids the economic issues discussed above; and on policy it keeps close to the government and does not choose to take an independent view. This is where a role for the Competition Commission is inescapable. It is for the Competition Commission to decide at what level to frame its interventions. Quite a few of government obstructions to competition that are found in the oil industry are present in other industries as well; the Competition Commission would have to take a view on whether to take an industry- specific approach or to take up more general issues of policy. Either way, there is a role that only the Competition Commission can play. *** 24
  • 29. Data Appendix Petroleum Statistics A. At a Glance Table A1: Growth of Indian Petroleum Industry at a Glance 2000-0 2001-0 2002-0 2003-0 2004-0 2005-0 Item Unit 1 2 3 4 5 6 2006-07* 1. Reserves! (Balance Recoverable) (i) Crude Oil Mn. Tonne 703 732 741 733 739 786 756 Bn. Cub. (ii) Natural Gas Mtr. 760 763 751 854 923 1101 1090 2. Consumption (i) Crude Oil (in terms of refinery crude throughput) Mn. Tonne 103.44 107.27 112.56 121.84 127.12 130.11 146.55 (ii) Petroleum Products (excluding RBF) Mn. Tonne 100.07 100.43 104.13 107.75 111.63 113.21 119.55 3. Production (i) Crude Oil Mn. Tonne 32.43 32.03 33.04 33.37 33.98 32.19 33.99 (ii) Petroleum Products Mn. Tonne 95.61 100 104.14 113.4 118.23 119.75 135.26 4. Imports & Exports (i) Gross Imports (a) Qty : Crude Oil Mn. Tonne 74.1 78.71 81.99 90.43 95.86 99.41 110.86 POL Products Mn. Tonne 9.27 7.01 6.74 7.9 8.87 11.68 16.97 Total (a) Mn. Tonne 83.37 85.72 88.73 98.33 104.69 111.09 127.83 (b) Value : Crude Oil Rs. Billion 659.32 603.97 761.95 835.28 1170.03 1717.02 2199.91 POL Products Rs. Billion 120.93 72.49 82.06 96.77 148.88 255.75 403.89 Total (b) Rs. Billion 780.25 676.46 844.01 932.05 1318.91 1972.77 2603.8 Pol. Imports as per DGCI&S Rs. Billion 714.97 667.7 853.67 945.2 1340.94 1946.4 2582.59 (ii) Exports (a) Qty POL Products Mn. Tonne 8.37 10.07 10.29 14.62 18.21 21.51 32.4 (b) Value POL Products Rs. Billion 76.72 82.19 108.68 167.81 299.28 467.2 801.72 (iii) Net 25
  • 30. Imports: (a) Qty : Crude Oil Mn. Tonne 74.1 78.71 81.99 90.43 95.86 99.41 110.86 POL Products Mn. Tonne 0.9 -3.06 -3.55 -6.72 -9.83 -9.83 -15.43 Total (a) Mn. Tonne 75 75.65 78.44 83.71 86.48 89.58 95.43 (b) Value : Crude Oil Rs. Billion 659.32 603.97 761.95 835.28 1170.03 1717.02 2199.91 POL Products Rs. Billion 44.21 -9.7 -26.62 -71.04 -150.4 -211.45 -397.83 Total (b) Rs. Billion 703.53 594.27 735.33 764.24 1019.63 1505.57 1802.8 (iv) Unit Value of Crude Oil Imports (Gross) Rs./MT 8898 7673 9293 9237 12206 17272 19844 5. India's Total Exports Rs. Billion 2035.71 2090.18 2551.37 2933.67 3618.79 4564.18 5716.42 6. Pol. Imports as % of India's Total Exports (i) Gross Imports % 38.3 32.4 33.1 31.8 36.4 43.2 45.5 (ii) Net Imports % 34.6 28.4 28.8 26.1 28.2 33 31.5 7. Contribution of Oil Sector to Centre/State Resources (i) Royalty from Crude Oil Rs. Billion 22.72 24.86 30.67 31.74 42.71 50.6 N.A. (ii) Royalty from Gas Rs. Billion 6.08 6.59 7.78 8.54 8.29 9.81 N.A. (iii) Oil Development Cess Rs. Billion 27.28 28.78 50.91 51.43 52.48 50.07 70.34 (iv) Excise & Custom Duties Rs. Billion 359.12 361.04 451.27 507.33 563.95 631.43 718.93 (v) Sales Tax Rs. Billion 233.75 200.9 297.41 328.49 390 N.A. N.A. (vi) Dividend Rs. Billion 34.82 32.87 67.94 63.1 94.36 N.A. N.A. 8. Natural Gas : (i) Gross Bn. Cub. Production Mtr. 29.477 29.714 31.389 31.962 31.763 32.202 31.747 Bn. Cub. (ii) Utilisation Mtr. 27.86 28.037 29.963 30.906 30.775 31.325 30.791 Abbr: NA : Not Available. Note : * : Provisional. ! : As on 1st April of Initial year. Source: Ministry of Petroleum and Natural Gas. Government of India, (downloaded from www.indiastat.com) 26
  • 31. Table A2: Company-wise Production, Consumption, Import and Export of Liquefied Petroleum Gas (LPG) in India Company PSU PVT Total Particular Year Refinery Fractionator Refinery IOCL CPCL BPCL HPCL NRL BRPL MRPL ONGC GAIL OIL RIL EOL PVT (TMT) 2007-0 8 (Apr- Dec 07) 1198 260 673 453 38 34 211 774 789 36 1992 57 --- 6515 Production 2006-0 7 1488 399 826 592 54 48 282 1020 1032 44 2653 17 --- 8454 2005-0 6 1354 407 739 466 47 50 275 1094 1042 48 2193 --- 7717 2007-0 8 (Apr- Dec 07) 3976 --- 2192 2105 --- --- --- --- --- --- --- --- 477 8750 Consumptio 2006-0 --- --- --- --- --- --- n 7 5098 --- 2780 2651 9 --- 310 10848 2005-0 --- --- --- --- --- --- 6 4832 --- 2613 2531 47 --- 433 10456 2007-0 --- --- --- --- --- --- 8 (Apr- Dec 07) 1226 --- 111 171 --- --- 477 1985 Import 2006-0 --- --- --- --- --- --- 7 1558 --- 192 217 --- --- 310 2278 2005-0 --- --- --- --- --- --- 6 2233 --- 217 --- --- --- 433 2883 2007-0 --- --- --- --- --- --- 8 (Apr- Dec 07) 72 --- --- --- --- --- --- 72 Export 2006-0 --- --- --- --- --- --- 7 86 --- --- --- 26 0.1 112 2005-0 --- --- --- --- --- --- 6 53 --- --- --- --- --- --- 53 Source: Rajya Sabha Unstarred Question No. 575, dated on 04.03.2008. (downloaded from www.indiastat.com) B. Production Table B1: Refinery Crude Throughput and Production of Petroleum Products in India (‘000 Tonnes) Year Crude Throughput Production Public Private Public Private Total Total Sector/JVC Sector Sector/JVC Sector 1961-6 2 60 6524 6584 11 6184 6195 1965-6 6 1966 8267 10233 1733 7828 9561 1970-7 1 10820 7559 18379 9965 7145 17110 1975-7 6 17045 5238 22283 15895 4934 20829 1980-8 1 25333 503 25836 23646 477 24123 1985-8 6 42910 - 42910 39881 - 39881 1990-9 1 51772 - 51772 48562 - 48562 1991-9 2 51423 - 51423 48349 - 48349 27
  • 32. 1992-9 3 53482 - 53482 50359 - 50359 1993-9 4 54296 - 54296 51084 - 51084 1994-9 5 56534 - 56534 52927 - 52927 1995-9 6 58741 - 58741 55081 - 55081 1996-9 7 62870 - 62870 59005 - 59005 1997-9 8 65166 - 65166 61308 - 61308 1998-9 9 68538 - 68538 64544 - 64544 1999-0 0 74052 11912 85964 69144 10267 79411 2000-0 1 77411 26033 103444 72059 23555 95614 2001-0 2 77620 29654 107274 72462 27542 100004 2002-0 3 82015 30544 112559 76236 27904 104140 2003-0 4 89495 32345 121840 83397 30066 113463 2004-0 5 92808 34309 127117 86328 31905 118233 2005-0 6 96946 33163 130109 89793 29957 119750 2006-0 7* 108173 38378 146551 99714 35546 135260 Note: * : Provisional. Source: Ministry of Petroleum and Natural Gas. Government of India, (downloaded from www.indiastat.com) Table B2: Refinery-wise Crude Run and Production of Petroleum Products in India - Part I (in ‘000 tonnes) IOC BPCL HPCL HPCL IOC IOC IOC IOC IOC Year AOD Mumbai Mumbai Visakh Guwahati Barauni Gujarat Haldia Mathura 1990-91 Total Production 540 6603 5506 3231 712 2206 8791 2608 7414 Crude Run 566 6957 5766 3464 783 2416 9334 2935 7808 1991-92 Total Production 524 6630 4496 3676 793 2060 8877 2791 7925 Crude Run 546 6940 4729 3920 856 2262 9379 3021 8231 1992-93 Total Production 623 6875 5619 4274 749 2097 9258 2810 7430 Crude Run 547 7233 5849 4527 815 2287 9780 3040 7843 1993-94 Total Production 535 6831 5774 4203 840 2051 8830 2878 8121 Crude Run 554 7203 6018 4448 910 2222 9434 3106 8518 1994-95 Total 509 7071 4913 4759 833 2039 9148 2998 8018 28