Fuzzy cognitive mapping, a tool for participatory systems analysis
•
1 like•451 views

International Conference on Integrated Systems
Recommended

Recommended
More Related Content
What's hot
What's hot (13)
Viewers also liked
Similar to Fuzzy cognitive mapping, a tool for participatory systems analysis
Similar to Fuzzy cognitive mapping, a tool for participatory systems analysis (20)
More from Humidtropics, a CGIAR Research Program
More from Humidtropics, a CGIAR Research Program (20)
Recently uploaded
Recently uploaded (20)
Fuzzy cognitive mapping, a tool for participatory systems analysis
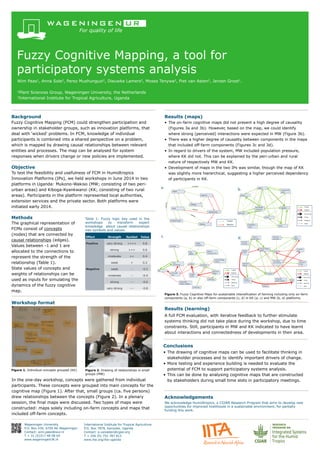
- 1. Fuzzy Cognitive Mapping, a tool for participatory systems analysis Wim Paas1, Anna Sole2, Perez Mushunguzi2, Dieuwke Lamers2, Moses Tenywa2, Piet van Asten2, Jeroen Groot1. 1Plant Sciences Group, Wageningen University, the Netherlands 2International Institute for Tropical Agriculture, Uganda Background Fuzzy Cognitive Mapping (FCM) could strengthen participation and ownership in stakeholder groups, such as innovation platforms, that deal with ‘wicked’ problems. In FCM, knowledge of individual participants is combined into a shared perspective on a problem, which is mapped by drawing causal relationships between relevant entities and processes. The map can be analysed for system responses when drivers change or new policies are implemented. Results (maps) • The on-farm cognitive maps did not present a high degree of causality (Figures 3a and 3b). However, based on the map, we could identify where strong (perceived) interactions were expected in MW (Figure 3b). • There was a higher degree of causality between components in the maps that included off-farm components (Figures 3c and 3d). • In regard to drivers of the system, MW included population pressure, where KK did not. This can be explained by the peri-urban and rural nature of respectively MW and KK. • Development of maps in the two IPs was similar, though the map of KK was slightly more hierarchical, suggesting a higher perceived dependency of participants in KK. Objective To test the feasibility and usefulness of FCM in Humidtropics Innovation Platforms (IPs), we held workshops in June 2014 in two platforms in Uganda: Mukono-Wakiso (MW; consisting of two peri- urban areas) and Kiboga-Kyankwanzi (KK; consisting of two rural areas). Participants in the platform represented local authorities, extension services and the private sector. Both platforms were initiated early 2014. Results (learning) A full FCM evaluation, with iterative feedback to further stimulate systems thinking did not take place during the workshop, due to time constraints. Still, participants in MW and KK indicated to have learnt about interactions and connectedness of developments in their area. Methods The graphical representation of FCMs consist of concepts (nodes) that are connected by causal relationships (edges). Values between -1 and 1 are allocated to the connections to represent the strength of the relationship (Table 1). State values of concepts and weights of relationships can be used as inputs for simulating the dynamics of the fuzzy cognitive map. Table 1: Fuzzy logic key used in the workshops to transform expert knowledge about causal relationships into symbols and values. Figure 2. Drawing of relationships in small groups (MW) Figure 1. Individual concepts grouped (KK) Workshop format Conclusions • The drawing of cognitive maps can be used to facilitate thinking in stakeholder processes and to identify important drivers of change. • More testing and experience building is needed to evaluate the potential of FCM to support participatory systems analysis. • This can be done by analysing cognitive maps that are constructed by stakeholders during small time slots in participatory meetings.In the one-day workshop, concepts were gathered from individual participants. These concepts were grouped into main concepts for the cognitive map (Figure 1). After that, small groups (ca. five persons) drew relationships between the concepts (Figure 2). In a plenary session, the final maps were discussed. Two types of maps were constructed: maps solely including on-farm concepts and maps that included off-farm concepts. Acknowledgements We acknowledge Humidtropics, a CGIAR Research Program that aims to develop new opportunities for improved livelihoods in a sustainable environment, for partially funding this work. Wageningen University P.O. Box 430, 6700 AK Wageningen Contact: wim.paas@wur.nl T + 31 (0)317 48 08 64 www.wageningenUR.nl Effect Strength Symbol Value Positive very strong ++++ 0.8 strong +++ 0.6 moderate ++ 0.4 weak + 0.2 Negative weak - -0.2 moderate -- -0.4 strong --- -0.6 very strong ---- -0.8 Figure 3. Fuzzy Cognitive Maps for sustainable intensification of farming including only on-farm components (a, b) or also off-farm components (c, d) in KK (a, c) and MW (b, d) platforms. International Institute for Tropical Agriculture P.O. Box 7878, Kampala, Uganda Contact: p.vanasten@cgiar.org T + 256 (0) 752 787 812 www.iita.org/iita-uganda a. b. c. d.