Jan 2010 Austin Economic Indicators
•
1 gostou•245 visualizações

Provided by the Greater Austin Area Chamber of Commerce

Recomendados
Mais conteúdo relacionado
Mais procurados
Mais procurados (17)
Destaque
Destaque (8)
Semelhante a Jan 2010 Austin Economic Indicators
Semelhante a Jan 2010 Austin Economic Indicators (20)
Último
Último (20)
Jan 2010 Austin Economic Indicators
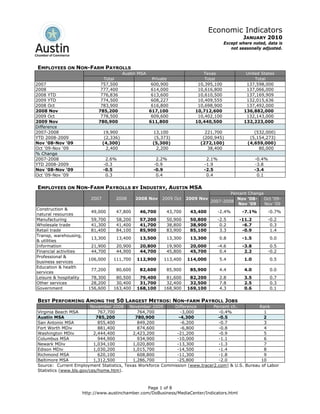
- 1. Economic Indicators JANUARY 2010 Except where noted, data is not seasonally adjusted. EMPLOYEES ON NON-FARM PAYROLLS Austin MSA Texas United States Total Private Total Total 2007 757,500 600,900 10,395,100 137,598,000 2008 777,400 614,000 10,616,800 137,066,000 2008 YTD 776,836 613,600 10,610,500 137,169,909 2009 YTD 774,500 608,227 10,409,555 132,015,636 2008 Oct 783,900 616,800 10,698,900 137,492,000 2008 Nov 785,200 617,100 10,712,600 136,882,000 2009 Oct 778,500 609,600 10,402,100 132,143,000 2009 Nov 780,900 611,800 10,440,500 132,223,000 Difference 2007-2008 19,900 13,100 221,700 (532,000) YTD 2008-2009 (2,336) (5,373) (200,945) (5,154,273) Nov ‘08-Nov ‘09 (4,300) (5,300) (272,100) (4,659,000) Oct ‘09-Nov ‘09 2,400 2,200 38,400 80,000 % Change 2007-2008 2.6% 2.2% 2.1% -0.4% YTD 2008-2009 -0.3 -0.9 -1.9 -3.8 Nov ‘08-Nov ‘09 -0.5 -0.9 -2.5 -3.4 Oct ‘09-Nov ‘09 0.3 0.4 0.4 0.1 EMPLOYEES ON NON-FARM PAYROLLS BY INDUSTRY, AUSTIN MSA Percent Change 2007 2008 2008 Nov 2009 Oct 2009 Nov Nov ‘08- Oct ‘09- 2007-2008 Nov ‘09 Nov ‘09 Construction & 49,000 47,800 46,700 43,700 43,400 -2.4% -7.1% -0.7% natural resources Manufacturing 59,700 58,200 57,200 50,900 50,800 -2.5 -11.2 -0.2 Wholesale trade 41,300 41,400 41,700 38,800 38,900 0.2 -6.7 0.3 Retail trade 81,400 84,100 85,900 83,900 85,100 3.3 -0.9 1.4 Transp, warehousing, 13,300 13,400 13,500 13,300 13,300 0.8 -1.5 0.0 & utilities Information 21,900 20,900 20,800 19,900 20,000 -4.6 -3.8 0.5 Financial activities 44,700 44,900 44,700 45,800 45,700 0.4 2.2 -0.2 Professional & 106,000 111,700 112,900 113,400 114,000 5.4 1.0 0.5 business services Education & health 77,200 80,600 82,600 85,900 85,900 4.4 4.0 0.0 services Leisure & hospitality 78,300 80,500 79,400 81,600 82,200 2.8 3.5 0.7 Other services 28,200 30,400 31,700 32,400 32,500 7.8 2.5 0.3 Government 156,600 163,400 168,100 168,900 169,100 4.3 0.6 0.1 BEST PERFORMING AMONG THE 50 LARGEST METROS: NON-FARM PAYROLL JOBS November 2008 November 2009 Difference Percent ch. Rank Virginia Beach MSA 767,700 764,700 -3,000 -0.4% 1 Austin MSA 785,200 780,900 -4,300 -0.5 2 San Antonio MSA 855,400 849,200 -6,200 -0.7 3 Fort Worth MDiv 881,400 874,600 -6,800 -0.8 4 Washington MDiv 2,444,400 2,423,200 -21,200 -0.9 5 Columbus MSA 944,900 934,900 -10,000 -1.1 6 Newark MDiv 1,034,100 1,020,800 -13,300 -1.3 7 Edison MDiv 1,030,200 1,015,700 -14,500 -1.4 8 Richmond MSA 620,100 608,800 -11,300 -1.8 9 Baltimore MSA 1,312,500 1,286,700 -25,800 -2.0 10 Source: Current Employment Statistics, Texas Workforce Commission (www.tracer2.com) & U.S. Bureau of Labor Statistics (www.bls.gov/ces/home.htm). Page 1 of 8 http://www.austinchamber.com/DoBusiness/MediaCenter/Indicators.html
- 2. Economic Indicators JANUARY 2010 Except where noted, data is not seasonally adjusted. LABOR FORCE, EMPLOYMENT & UNEMPLOYMENT Labor Force Employment Unemployment Unemp. rate Austin MSA 2007 847,220 815,545 31,675 3.7% 2008 867,507 829,633 37,874 4.4 2008 YTD 866,999 829,821 37,179 4.3 2009 YTD 892,505 832,600 59,905 6.7 2008 Oct 877,560 836,976 40,584 4.6 2008 Nov 877,692 834,556 43,136 4.9 2009 Oct 904,578 839,877 64,701 7.2 2009 Nov 905,495 843,093 62,402 6.9 Texas 2007 11,474,987 10,972,152 502,835 4.4% 2008 11,701,585 11,126,436 575,149 4.9 2008 YTD 11,693,671 11,126,950 566,720 4.8 2009 YTD 11,970,711 11,077,931 892,780 7.5 2008 Oct 11,812,192 11,200,329 611,863 5.2 2008 Nov 11,808,224 11,167,592 640,632 5.4 2009 Oct 12,069,719 11,090,397 979,322 8.1 2009 Nov 12,103,220 11,149,340 953,880 7.9 United States 2007 153,124,000 146,047,000 7,078,000 4.6% 2008 154,287,000 145,362,000 8,924,000 5.8 2008 YTD 154,281,000 145,545,455 8,735,636 5.7 2009 YTD 154,273,727 140,052,455 14,221,364 9.2 2008 Oct 155,012,000 145,543,000 9,469,000 6.1 2008 Nov 154,624,000 144,609,000 10,015,000 6.5 2009 Oct 153,635,000 139,088,000 14,547,000 9.5 2009 Nov 153,539,000 139,132,000 14,407,000 9.4 LABOR FORCE, EMPLOYMENT & UNEMPLOYMENT BY COUNTY, NOVEMBER 2009 Labor Force Employment Unemployment Unemp. Rate Bastrop 36,041 33,170 2,871 8.0% Caldwell 16,587 15,268 1,319 8.0 Hays 78,326 73,125 5,201 6.6 Travis 566,123 528,730 37,393 6.6 Williamson 208,418 192,800 15,618 7.5 EMPLOYMENT GROWTH Austin MSA Texas United States 2007-2008 14,088 154,284 -685,000 YTD 2008-2009 2,779 -49,019 -5,493,000 Difference Nov ‘08-Nov ‘09 8,537 -18,252 -5,477,000 Oct ‘09-Nov ‘09 3,216 58,943 44,000 2007-2008 1.7% 1.4% -0.5% YTD 2008-2009 0.3 -0.4 -3.8 Percent change Nov ‘08-Nov ‘09 1.0 -0.2 -3.8 Oct ‘09-Nov ‘09 0.4 0.5 0.0 Page 2 of 8 http://www.austinchamber.com/DoBusiness/MediaCenter/Indicators.html
- 3. Economic Indicators JANUARY 2010 Except where noted, data is not seasonally adjusted. LOWEST UNEMPLOYMENT RATES AMONG THE 50 LARGEST METROS November 2008 November 2009 Difference Rank Washington MDiv 4.5% 6.3% 1.8% 1 Virginia Beach MSA 4.9 6.6 1.7 2 San Antonio MSA 5.2 6.8 1.5 3 Nassau MDiv 5.3 6.8 1.5 4 Denver MSA 5.6 6.8 1.3 5 Austin MSA 4.9 6.9 2.0 6 Minneapolis MSA 5.6 7.0 1.4 7 Boston MDiv 5.1 7.3 2.2 8 Richmond MSA 5.0 7.5 2.5 9 Pittsburgh MSA 5.4 7.5 2.1 10 Source: Local Area Unemployment Statistics, Texas Workforce Commission (www.tracer2.com) & U.S. Bureau of Labor Statistics (http://www.bls.gov/lau/home.htm). EMPLOYMENT COST INDEX (2005 Q4=100), PRIVATE INDUSTRY Total compensation Wages & salaries United States West South Central United States West South Central 2007 105.2 105.1 105.5 105.5 2008 108.2 108.3 108.6 109.0 2008 YTD 108.0 108.1 108.4 108.7 2009 YTD 109.6 109.6 110.2 110.4 2008 Q2 108.0 108.2 108.4 108.8 2008 Q3 108.7 108.7 109.1 109.4 2009 Q2 109.6 109.5 110.1 110.2 2009 Q3 110.0 109.9 110.6 110.8 % Change 2007-2008 2.9% 3.0% 2.9% 3.3% YTD 2008-2009 1.5 1.4 1.7 1.6 Q3'08-Q3'09 1.2 1.1 1.4 1.3 Q2'09-Q3'09 0.4 0.4 0.5 0.5 Source: U.S. Bureau of Labor Statistics (http://www.bls.gov/ncs/ect/home.htm). METRO BUSINESS CYCLE INDEX, OCT. 1980=100, SEASONALLY ADJUSTED1 Austin Dallas Ft. Worth Houston San Antonio 2007 405.5 208.2 241.6 265.2 236.4 2008 407.8 210.3 244.8 275.8 240.0 2008 YTD 408.7 210.6 245.0 275.8 240.3 2009 YTD 383.7 199.4 238.8 264.9 229.2 2008 Oct 402.9 209.3 244.1 276.6 238.9 2008 Nov 400.5 208.0 243.0 277.3 237.9 2009 Oct 375.3 197.0 238.0 259.2 223.8 2009 Nov 374.0 196.9 238.2 258.7 222.8 % Change 2007-2008 0.6% 1.0% 1.3% 4.0% 1.5% YTD 2008-2009 -6.1 -5.3 -2.5 -4.0 -4.6 Nov ‘08-Nov ‘09 -6.6 -5.3 -2.0 -6.7 -6.3 Oct ‘09-Nov ‘09 -0.3 -0.1 0.1 -0.2 -0.4 Source: Federal Reserve Bank of Dallas (http://www.dallasfed.org/data/mbci.html). Page 3 of 8 http://www.austinchamber.com/DoBusiness/MediaCenter/Indicators.html
- 4. Economic Indicators JANUARY 2010 Except where noted, data is not seasonally adjusted. CONSUMER PRICE INDEX, ALL URBAN CONSUMERS, ALL ITEMS, 1982-84=100 U.S. city average U.S. city average South urban average Seasonally adjusted Not seasonally adjusted Not seasonally adjusted 2007 — 207.3 200.4 2008 — 215.3 208.7 2008 YTD — 215.8 209.2 2009 YTD — 214.4 207.7 2008 Oct 216.9 216.6 210.1 2008 Nov 213.3 212.4 205.6 2009 Oct 216.4 216.2 209.3 2009 Nov 217.3 216.3 209.7 % Change 2007-2008 — 3.9% 4.1% YTD 2008-2009 — -0.6 -0.7 Nov ‘08-Nov ‘09 1.9% 1.8 2.0 Oct ‘09-Nov ‘09 0.4 0.0 0.2 Source: U.S. Bureau of Labor Statistics (www.bls.gov/cpi/home.htm). LOCAL SALES TAX ALLOCATIONS2 Austin Metropolitan City of Austin City of Round Rock City of San Marcos Transit Authority 2008 $147,051,782 $154,009,619 $67,029,667 $18,382,874 2009 131,403,989 138,955,174 58,694,318 17,798,267 2009 YTD 10,379,952 10,875,172 4,812,885 1,562,261 2010 YTD 9,726,393 9,870,884 5,299,603 1,442,711 2008 Dec 11,557,643 12,140,054 5,873,208 1,288,214 2009 Jan 10,379,952 10,875,172 4,812,885 1,562,261 2009 Dec 10,548,658 11,180,850 4,595,181 1,221,438 2010 Jan 9,726,393 9,870,884 5,299,603 1,442,711 % Change 2008-2009 -10.6% -9.8% -12.4% -3.2% YTD 2008-2009 -6.3 -9.2 10.1 -7.7 Jan ‘09-Jan ‘10 -6.3 -9.2 10.1 -7.7 Dec ‘09-Jan ‘10 -7.8 -11.7 15.3 18.1 TOTAL SALES & RETAIL SALES Total Retail Texas Austin MSA Texas Austin MSA 2007 $1,620,691,009,349 $70,317,058,513 $350,230,557,388 $23,475,166,804 2008 1,872,595,089,755 72,789,587,893 360,863,364,480 23,315,760,201 2008 YTD 812,803,195,724 34,049,608,788 172,202,490,370 11,326,698,538 2009 YTD 646,996,683,479 30,081,649,225 152,048,798,513 10,251,980,735 2008 Q1 812,803,195,724 34,049,608,788 172,202,490,370 11,326,698,538 2008 Q2 646,996,683,479 30,081,649,225 152,048,798,513 10,251,980,735 2009 Q1 380,199,638,351 16,079,572,282 83,667,052,366 5,501,095,207 2009 Q2 432,603,557,373 17,970,036,506 88,535,438,004 5,825,603,331 % Change 2007-2008 15.5% 3.5% 3.0% -0.7% YTD 2008-2009 -20.4 -11.7 -11.7 -9.5 Q2 '08-Q2 '09 -33.1 -40.3 -41.8 -43.2 Q1 '09-Q2 '09 13.8 11.8 5.8 5.9 Source: Texas Comptroller of Public Accounts, (http://www.window.state.tx.us/taxinfo/sales/). Page 4 of 8 http://www.austinchamber.com/DoBusiness/MediaCenter/Indicators.html
- 5. Economic Indicators JANUARY 2010 Except where noted, data is not seasonally adjusted. AUSTIN-BERGSTROM INTERNATIONAL AIRPORT ACTIVITY Passengers3 Cargo (lbs.)4 2007 8,885,391 210,785,763 2008 9,049,572 201,881,429 2008 YTD 8,336,214 187,621,015 2009 YTD 7,526,335 141,467,484 2008 Oct 756,553 17,365,588 2008 Nov 682,217 14,227,706 2009 Oct 737,214 14,457,151 2009 Nov 678,919 12,038,387 % Change 2007-2008 1.8% -4.2% YTD 2008-2009 -9.7 -24.6 Nov ‘08-Nov ‘09 -0.5 -15.4 Oct ‘09-Nov ‘09 -7.9 -16.7 Source: Austin-Bergstrom International Airport (www.ci.austin.tx.us/austinairport/activity.htm). PATENT ACTIVITY Austin MSA 2007 2,126 2008 2,376 2008 YTD 2,171 2009 YTD 2,421 2008 Oct 222 2008 Nov 242 2009 Oct 193 2009 Nov 215 % Change 2007-2008 11.8% YTD 2008-2009 11.5 Nov ‘08-Nov ‘09 -11.2 Oct ‘09-Nov ‘09 11.4 Source: Locke Lord Bissell & Liddell, Austin, TX. VENTURE CAPITAL INVESTMENT Austin MSA United States Investment Investment Companies Deals Companies Deals (Mil.) (Mil.) 2007 67 80 $640.0 3,330 4,022 $30,538.6 2008 56 65 328.3 3,301 3,980 27,958.7 2008 YTD 50 51 273.9 3,058 3,076 22,255.6 2009 YTD 33 33 125.3 1,906 1,910 12,246.9 2008 Q2 14 14 56.2 1,056 1,067 7,442.9 2008 Q3 18 19 84.1 987 994 7,159.8 2009 Q2 11 11 44.7 657 657 4,117.7 2009 Q3 11 11 55.9 635 637 4,808.8 % Change 2007-2008 -16.4% -18.8% -48.7% -0.9% -1.0% -8.4% YTD 2008-2009 -34.0 -35.3 -54.3 -37.7 -37.9 -45.0 Q3'08-Q3'09 -38.9 -42.1 -33.5 -35.7 -35.9 -32.8 Q2'09-Q3'09 0.0 0.0 25.1 -3.3 -3.0 16.8 Source: PricewaterhouseCooper/Venture Economics/NVCA MoneyTree Survey (http://vx.thomsonib.com/VxComponent/static/stats/statshome.htm). Page 5 of 8 http://www.austinchamber.com/DoBusiness/MediaCenter/Indicators.html
- 6. Economic Indicators JANUARY 2010 Except where noted, data is not seasonally adjusted. NEW PRIVATELY-OWNED HOUSING UNITS AUTHORIZED BY BUILDING PERMITS Number of housing units Valuation (millions) Total Single-family Multifamily Total Single-family Multifamily Austin MSA 2007 19,903 12,120 7,783 $2,839.260 $2,067.311 $771.949 2008 11,792 7,710 4,082 1,845.720 1,341.901 503.819 2008 YTD5 13,130 7,736 5,394 1,928.678 1,330.136 598.542 2009 YTD 8,241 6,180 2,061 1,159.880 993.437 166.443 2008 Oct 815 508 307 120.743 95.984 24.759 2008 Nov 713 281 432 83.757 54.364 29.393 2009 Oct 476 469 7 81.160 80.740 0.420 2009 Nov 626 374 252 87.747 71.351 16.396 % Change 2007-2008 -40.8% -36.4% -47.6% -35.0% -35.1% -34.7% YTD 2008-2009 -37.2 -20.1 -61.8 -39.9 -25.3 -72.2 Nov ‘08-Nov ‘09 -12.2 33.1 -41.7 4.8 31.2 -44.2 Oct ‘09-Nov ‘09 31.5 -20.3 3,500.0 8.1 -11.6 3,803.8 United States 2007 1,398,415 979,889 418,526 $225,236.6 $183,679.2 $41,557.4 2008 905,359 575,554 329,805 141,623.5 110,687.4 30,936.1 2008 YTD 864,135 550,998 313,137 133,476.6 104,918.3 28,558.3 2009 YTD 524,243 400,686 123,557 86,651.0 75,153.6 11,497.4 2008 Oct 63,691 40,390 23,301 9,765.1 7,840.8 1,924.3 2008 Nov 41,480 26,197 15,283 6,389.2 5,029.8 1,359.4 2009 Oct 46,525 37,899 8,626 8,148.0 7,374.3 773.7 2009 Nov 40,747 31,376 9,371 6,949.2 6,108.8 840.4 % Change 2007-2008 -35.3% -41.3% -21.2% -37.1% -39.7% -25.6% YTD 2008-2009 -39.3 -27.3 -60.5 -35.1 -28.4 -59.7 Nov ‘08-Nov ‘09 -1.8 19.8 -38.7 8.8 21.5 -38.2 Oct ‘09-Nov ‘09 -12.4 -17.2 8.6 -14.7 -17.2 8.6 Source: U.S. Bureau of the Census (www.census.gov/const/www/permitsindex.html). NAHB/WELLS FARGO HOUSING OPPORTUNITY INDEX (HOI) Austin MSA United States Median Median Weighted Median Median HOI6 family HOI family interest sales price sales price income income rate 2007 $202,500 55.2 $69,300 $236,000 43.9 $59,000 6.50% 2008 184,500 63.5 69,100 207,475 56.8 61,500 6.14 2008 YTD 187,333 62.3 69,100 213,300 55.0 61,500 6.18 2009 YTD 182,000 74.1 73,300 177,167 71.6 64,000 5.17 2008 Q2 186,000 63.4 69,100 215,000 55.0 61,500 6.12 2008 Q3 185,000 61.9 69,100 205,900 56.1 61,500 6.39 2009 Q2 186,000 73.4 73,300 177,000 72.3 64,000 5.03 2009 Q3 183,000 74.0 73,300 179,000 70.1 64,000 5.33 Change 2007-2008 -8.9% 15.0% -0.3% -12.1% 29.4% 4.2% -5.5% YTD 2008-2009 -2.8 18.9 6.1 -16.9 30.2 4.1 -16.3 Q3 '08-Q3 '09 -1.1 19.5 6.1 -13.1 25.0 4.1 -16.6 Q2 '09-Q3 '09 -1.6 0.8 0.0 1.1 -3.0 0.0 6.0 Source: National Association of Home Builders (http://www.nahb.org/hoi). Page 6 of 8 http://www.austinchamber.com/DoBusiness/MediaCenter/Indicators.html
- 7. Economic Indicators JANUARY 2010 Except where noted, data is not seasonally adjusted. EXISTING HOME SALES, LISTINGS & PRICES Months Sales Dollar volume Average price Median price Total listings inventory Austin MSA 2007 28,048 $6,910,962,480 $246,400 $184,200 9,833 4.0 2008 22,440 5,470,518,171 243,800 188,200 11,585 5.5 2008 YTD 21,020 5,129,310,211 242,636 ― 11,721 5.6 2009 YTD 19,339 4,558,536,214 234,782 ― 10,934 6.5 2008 Oct 1,444 345,831,114 239,500 188,500 11,635 5.9 2008 Nov 1,089 251,409,268 230,900 180,100 10,869 5.7 2009 Oct 1,930 450,170,770 233,200 179,700 10,300 6.1 2009 Nov 1,745 405,992,592 232,700 176,300 9,836 5.7 % Change 2007-2008 -20.0% -20.8% -1.1% 2.2% 17.8% 37.5% YTD 2008-2009 -8.0 -11.1 -3.2 ― -6.7 16.1 Nov ‘08-Nov ‘09 60.2 61.5 0.8 -2.1 -9.5 0.0 Oct ‘09-Nov ‘09 -9.6 -9.8 -0.2 -1.9 -4.5 -6.6 United States 2007 5,652,000 ― $266,000 $219,000 ― 8.9 2008 4,913,000 ― 242,700 198,100 ― 10.5 2008 YTD 4,552,000 ― 243,545 ― ― 10.5 2009 YTD 4,743,000 ― 217,136 ― ― 8.9 2008 Oct 413,000 ― 229,600 186,400 ― 10.2 2008 Nov 322,000 ― 223,000 180,300 ― 11.0 2009 Oct 498,000 ― 217,300 172,200 ― 7.0 2009 Nov 472,000 ― 216,400 172,600 ― 6.5 % Change 2007-2008 -13.1% ― -8.8% -9.5% ― 18.0% YTD 2008-2009 4.2 ― -10.8 ― ― -15.2 Nov ‘08-Nov ‘09 46.6 ― -3.0 -4.3 ― -40.9 Oct ‘09-Nov ‘09 -5.2 ― -0.4 0.2 ― -7.1 Sources: Real Estate Center at Texas A&M University (http://recenter.tamu.edu) & National Association of Realtors (www.realtor.org/Research.nsf/Pages/EHSdata). Page 7 of 8 http://www.austinchamber.com/DoBusiness/MediaCenter/Indicators.html
- 8. Economic Indicators JANUARY 2010 Except where noted, data is not seasonally adjusted. OFFICE & INDUSTRIAL REAL ESTATE MARKET7 Austin National Inventory Vacant Average rental Average rental Vacancy rate Vacancy rate (sq. ft.) (sq. ft.) rate rate Office 2007 72,939,677 8,490,412 11.6% $25.24 10.8% $24.86 2008 76,747,339 10,429,331 13.6 25.32 11.9 25.01 2008 YTD 75,694,438 9,525,725 12.6 25.86 11.6 25.30 2009 YTD 78,158,873 11,599,118 14.8 25.39 13.2 23.98 2008 Q2 74,791,272 8,781,496 11.7 26.35 11.3 25.40 2008 Q3 75,694,438 9,525,725 12.6 25.86 11.6 25.30 2009 Q2 77,611,506 11,720,294 15.1 25.61 12.9 24.33 2009 Q3 78,158,873 11,599,118 14.8 25.39 13.2 23.98 % Change 2007-2008 5.2% 22.8% 17.2% 0.3% 10.2% 0.6% YTD 2008-2009 3.3 21.8 17.5 -1.8 13.8 -5.2 Q3'08-Q3'09 3.3 21.8 17.5 -1.8 13.8 -5.2 Q2'09-Q3'09 0.7 -1.0 -2.0 -0.9 2.3 -1.4 Industrial 2007 78,551,315 7,799,694 9.9% $7.72 8.0% $6.22 2008 81,087,114 9,179,278 11.3 7.74 8.8 6.29 2008 YTD 80,193,624 7,573,729 9.4 7.68 8.4 6.33 2009 YTD 81,937,061 10,821,160 13.2 7.12 10.2 5.95 2008 Q2 79,686,322 7,796,383 9.8 7.54 8.5 6.31 2008 Q3 80,193,624 7,573,729 9.4 7.68 8.4 6.33 2009 Q2 81,486,036 10,211,422 12.5 7.36 9.8 6.08 2009 Q3 81,937,061 10,821,160 13.2 7.12 10.2 5.95 % Change 2007-2008 3.2% 17.7% 14.1% 0.3% 10.0% 1.1% YTD 2008-2009 2.2 42.9 40.4 -7.3 21.4 -6.0 Q3'08-Q3'09 2.2 42.9 40.4 -7.3 21.4 -6.0 Q2'09-Q3'09 0.6 6.0 5.6 -3.3 4.1 -2.1 Source: CoStar Group. 1 These indexes summarize movements in locally measured nonagricultural employment, the unemployment rate, inflation-adjusted wages and inflation-adjusted retail sales. 2 The allocation historical summaries show the total dollars returned to a local sales taxing city, county, special purpose district or transit authority by the Comptroller's office for their local sales tax collection. The payments are listed by month and totaled by year. Allocation amounts are dependent upon the timing and accuracy of taxpayers' returns, but generally represent taxes collected on sales made two months or more prior to the allocation payment. 3 Total passengers includes domestic and international revenue and non-revenue passengers. It is a total of passengers enplaned, deplaned, and through. 4 Total cargo includes domestic and international enplaned and deplaned belly freight, mail, and cargo. 5 The Census Bureau publishes monthly data that it does not revise in light of later information that is incorporated into YTD numbers. Similarly YTD numbers are not revised to incorporate later information that will be included in final annual totals. Final 2008 annual permits for Austin are notably lower than indicated in the unrevised published monthly and YTD numbers for 2008. The Real Estate Center at Texas A&M appears to adjust historical monthly numbers to be consistent with later revisions. We’re not, presently, electing to replace the Census as the source for this data in Economic Indicators, however, users comparing 2008 and 2009 may want to also consult the data at http://recenter.tamu.edu/data/databp.html. 6 HOI is a measure of the percentage of homes sold in a given area during the quarter that are affordable to families earning that area’s median income. 7 Annual numbers are year-end. Page 8 of 8 http://www.austinchamber.com/DoBusiness/MediaCenter/Indicators.html