National Solar Jobs Census 2013
•
1 gostou•672 visualizações

This research poster was created as a part of the 2014 Solar Symposium and is by The Solar Foundation. The National Solar Jobs Census series is a product of The Solar Foundation®, conducted annually since 2010. The inaugural Census established the first credible employment baseline for the domestic solar industry.The Census surveys solar employers and quantifies jobs across all solar technologies and industry subsectors. Since 2010, employment has grown by 53%, representing nearly 50,000 new U.S. solar jobs.
Recomendados

Recomendados
Mais conteúdo relacionado
Mais procurados
Mais procurados (9)
Destaque
Destaque (20)
Semelhante a National Solar Jobs Census 2013
Semelhante a National Solar Jobs Census 2013 (20)
Mais de GW Solar Institute
Mais de GW Solar Institute (20)
Último
Último (20)
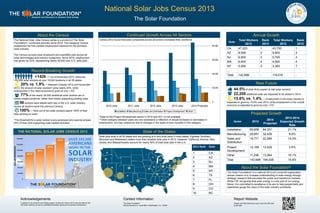
National Solar Jobs Census 2013
- 1. 44.5% of solar firms expect to add solar workers. 22,200 additional solar are expected to be added in 2014. 15.6% vs. 1.4% — Employment in the solar industry is expected to grow by 15.6% over 2014, while employment in the overall economy is expected to grow by only 1.4%. 0 20,000 40,000 60,000 80,000 2010 Jobs 2011 Jobs 2012 Jobs 2013 Jobs 2014 Projected Installation Manufacturing Sales and Distribution Project Development* Other* * Annual Growth Projected Growth Census 2013 found that solar companies across all sectors increased their workforce. *Data on the Project Development sector in 2010 and 2011 is not available **Other category between years are not necessarily a reflection of actual increases or decreases in employment, but may instead be due to changes in the types of jobs included in this category. Continued Growth Across All Sectors The National Solar Jobs Census series is a product of The Solar Foundation®, conducted annually since 2010. The inaugural Census established the first credible employment baseline for the domestic solar industry. The Census surveys solar employers and quantifies jobs across all solar technologies and industry subsectors. Since 2010, employment has grown by 53%, representing nearly 50,000 new U.S. solar jobs. About the Census National Solar Jobs Census 2013 The Solar Foundation State Total Workers 2013 Rank 2013 Total Workers 2012 Rank 2012 CA 47,223 1 43,700 1 AZ 8,558 2 9,800 2 NJ 6,500 3 5,700 3 MA 6,400 4 4,500 4 NY 5,000 5 3,300 7 … Total 142,698 - 119,016 - Contact InformationAcknowledgements Report Website In addition to its research and writing support, funding for Census 2013 was provided by the GW Solar Institute, as well as charitable foundation grants and corporate contributions. The Solar Foundation 505 9th Street N.W., Suite 800 ● Washington, D.C. 20004 Please visit http://tsfcensus.org or scan the QR code to the right. Solar jobs exist in all 50 states and are growing at a very brisk pace in most states. Eighteen Southern, Mountain and Midwestern states more than doubled solar jobs in 2013. However, California, Arizona, New Jersey, and Massachusetts account for nearly 50% of total solar jobs in the U.S. State of the States +142k – As of November 2013, there are 142,698 solar workers at over 18,000 locations in all 50 states. 20% VS. 1.9% — Between October 2012 and November 2013, the amount of solar workers* grew nearly 20%, while employment in the national economy grew at only 1.9%. 77% of the nearly 24,000 additional solar workers are in newly-created positions, rather than simply expanding existing roles. 56 workers were added each day in the U.S. solar industry across all sectors since the previous Census. 100% — Nine out of ten solar workers spend 100% of their time working on solar. *The threshold for a solar worker is any employee who spends at least 50% of their time supporting solar-related activities. Record-Breaking Growth The Solar Foundation® is a national 501(c)(3) nonprofit organization whose mission is to increase understanding of solar energy through strategic research that educates the public and transforms markets. While TSF recognizes that solar energy is a key part of our energy future, it is committed to excellence in its aim to help people fairly and objectively gauge the value of the solar industry worldwide. About the Solar Foundation® Sector 2013 2014 Projected 2013-2014 Expected Growth Rate Installation 69,658 84,331 21.1% Manufacturing 29,851 32,429 8.6% Sales and Distribution 19,771 22,585 14.2% Project Development 12,169 12,529 3.0% Other 11,248 13,064 16.1% Total 142,698 164,938 15.6% 2013 Rank State 1 CA 2 AZ 3 NJ 4 MA 5 NY 6 TX 7 FL 8 OH 9 CO 10 NC Near Future