How to Effectively Monitor SD-WAN and SASE Environments with ThousandEyes
Mpwhelp Eng[1]
1. About Mapwel
Mapwel is mapping software for creation of your own maps and their upload into the GPS unit. Unlike other
software tools that work only with tracks and waypoints, Mapwel allows to create complete maps for GPS. Click
here to see supported GPS units.
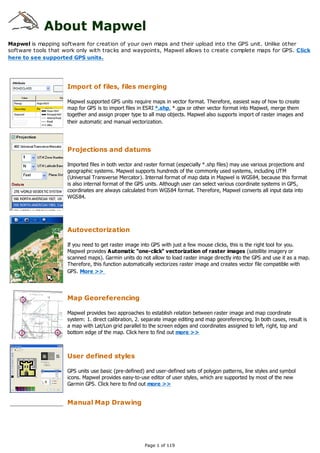
Import of files, files merging
Mapwel supported GPS units require maps in vector format. Therefore, easiest way of how to create
map for GPS is to import files in ESRI *.shp, *.gpx or other vector format into Mapwel, merge them
together and assign proper type to all map objects. Mapwel also supports import of raster images and
their automatic and manual vectorization.
Projections and datums
Imported files in both vector and raster format (especially *.shp files) may use various projections and
geographic systems. Mapwel supports hundreds of the commonly used systems, including UTM
(Universal Transverse Mercator). Internal format of map data in Mapwel is WGS84, because this format
is also internal format of the GPS units. Although user can select various coordinate systems in GPS,
coordinates are always calculated from WGS84 format. Therefore, Mapwel converts all input data into
WGS84.
Autovectorization
If you need to get raster image into GPS with just a few mouse clicks, this is the right tool for you.
Mapwel provides Automatic "one-click" vectorization of raster images (satellite imagery or
scanned maps). Garmin units do not allow to load raster image directly into the GPS and use it as a map.
Therefore, this function automatically vectorizes raster image and creates vector file compatible with
GPS. More >>
Map Georeferencing
Mapwel provides two approaches to establish relation between raster image and map coordinate
system: 1. direct calibration, 2. separate image editing and map georeferencing. In both cases, result is
a map with Lat/Lon grid parallel to the screen edges and coordinates assigned to left, right, top and
bottom edge of the map. Click here to find out more >>
User defined styles
GPS units use basic (pre-defined) and user-defined sets of polygon patterns, line styles and symbol
icons. Mapwel provides easy-to-use editor of user styles, which are supported by most of the new
Garmin GPS. Click here to find out more >>
Manual Map Drawing
Page 1 of 119
2. Manual Map Drawing
Map can be drawn from the scanned paper chart, aerial photos, satellite images and/or with use of
tracks and waypoints imported from your GPS. Tracks and waypoints are automatically converted into
the map elements. Mapwel allows to draw map with use of straight lines and curves. When drawn
with curves, map can be uploaded into the GPS with chosen precision/data-size ratio. User can apply
Contrast, Brightness and Gamma filters to the scanned chart or satellite image to adjust the
background for convenient drawing of vector objects on the top. To make drawing of complex objects
easier, Mapwel provides Opening in the Area tool.
Tools
Mapwel tools help to manage maps in your GPS, which are normally not accessible, or hard to
manipulate because they are all merged into a single file. ' Add maps to other maps in GPS' function
allows to add your map to those already present in the GPS memory. 'Delete specific maps in GPS'
allows to erase individual maps from your map set. 'Merge IMG files' alllows to combines several maps
into a single file for use with Nüvi, Zümo, Colorado, Oregon or unit, which memory is directly accessible
from Windows.
Other Mapwel tools help to create map faster. For example, 'Create Circle around Point' function for
aviation maps creates 'circles' of defined radius around all selected points. Very large 'circles' look
deformed near poles, because of coordinate system projection. However, real-world distance from
center to any point on the "circle" is the same.
Freehand Tool
Unlike the other Mapwel drawing tools, which are based on the precise manual placement of the nodes,
curves and lines, Freehand tool allows to draw many of the Mapwel objects very fast with a free hand.
Strokes are automatically converted into the chosen style. After conversion, strokes can be edited as
other vector objects (node by node).
Trace Tool
This is another tool for faster vectorization of the raster image. It allows to vectorize one object (or set
of similar objects) at once, but it cannot vectorize whole map with different types of objects at once.
Tracing should be repeated for respective types of objects (filled areas, roads, rivers, etc.). Trace tool
works on images with any common color depth (including True Color and bi-tone) that are sufficiently
clean.
Object Inspector
Object Inspector box at right side of the main Mawpel window displays information about respective
map objects and simplifies the object manipulations. It also allows to select one or several objects in the
work space.
WYSIWYG
Mapwel allows to draw the map in any colors you choose and the 'What you see is what you get'
interface (WYSIWYG) shows how the map will look like on the color or monochrome GPS display.
Mapwel also simulates the Nighttime and Marine color modes. When drawing the map, use display
mode tabs in the left bottom corner of the Mapwel screen to review your map in the real GPS colors.
Properties of Objects
Each object has adjustable properties like name, comment (text that is displayed in GPS when cursor
stays on top of the object), type, max. zoom level, etc. POI (points of interest) may have address and
phone number assigned. It is also possible to define properties of the whole map, like name, copyright
text, address format, internal map ID, map draw priority and zoom levels of map layers.
Page 2 of 119
3. Automatic Object Splitting
GPS rendering engine requires large areas and lines to be split into smaller objects because of the data
structures limitations and speed of map rendering. Mapwel splits all objects automatically without loss of
the map detail when it uploads map into the GPS. User does not have to bother about the object size or
detail limitations. Splitting process runs internally without user even knowing about it.
Accuracy
Map scope A ccuracy
< 45° +-2.4 m Both technical and software limitation of GPS units restrict accuracy of maps (see the Accuracy table).
This restriction is related to the map scope. It means that very large map is represented in GPS with
90° +-4.8 m
lower accuracy than the small or normal size map. Mapwel automatically converts all map data into the
180° +-9.6 m best possible accuracy level.
Map Uploading and Export
Finished map can be saved into Mapwel *.mpw file format, exported into *.img, *.kml or other
supported format, or uploaded directly into the GPS. Export of map into other than *.mpw file is
supported by Mapwel Advanced version only. Mapwel includes separate MapUpload program for loading
*.img files into the GPS. MapUpload also allows to pack several img files into a single executable file to
distribute to your friends or customers.
All in One
Creation of map for GPS involves drawing or import of map, conversion of data into GPS native format and upload
of data into GPS. Mapwel is the only available software that allows user to do above three steps with a single
software tool.
Use Mapwel WYSIWYG workspace to create complete GPS map with filled areas, all types of lines, map
features, cities, exits and points of interest with adresses. Do not limit yourself to just tracks and
waypoints. Use Mapwel import capabilities to open existing maps in various formats.
When converting to GPS native format, Mapwel automatically splits large objects to meet GPS technical
requirements and does lot of other automation to make creation of map as easy as possible.
Upload your map directly into the GPS. Mapwel allows you to add your map to other maps already present
in GPS memory. With Advanced version you can even export map into GPS native IMG file.
Other most important features include: Free map loader (for IMG files from other sources), Delete specific
maps in GPS function, UTM projected system and many geographic systems support.
Demo
Mapwel is available for download and testing in FREE demo mode. Demo is fully functional except the limit on
number of objects (map elements) that can be uploaded into the GPS. Therefore, maps uploaded into GPS with
demo are incomplete.
Levels
Registered Mapwel software is available in two levels:
1. Basic, for single GPS unit. Basic version allows user to upload map only into the GPS with ID that was
used for registration. This version is intended for personal use.
Advanced, for unlimited number of GPS units. Advanced version requires GPS (the one used for
Page 3 of 119
4. used for registration. This version is intended for personal use.
2. Advanced, for unlimited number of GPS units. Advanced version requires GPS (the one used for
registration) to check validity of password only once after installation of Mapwel. Then user may attach
any other compatible GPS and upload maps into it. This version is intended for personnel or organizations
that own number of GPS units. Advanced version allows to export maps into IMG, KML and MP format and
supports batch conversion mode.
Registration (Purchase)
To turn demo version into full version without limit user needs to purchase registration password and enter it
into the Mapwel. No additional download is needed. Registration password is derived from the GPS unit ID
number. This number is required for registration.
When uploading maps into GPS, Mapwel checks the ID of attached GPS. Therefore, GPS with ID used for
registration is needed for uploading maps. Mapwel Advanced (see Advanced version), checks registered GPS
only once, after installation.
Requirements
Windows 98/Me, Windows NT/2000/XP, Windows Vista compatible.
Minimum hardware requirements: 256 mega bytes RAM, screen resolution 1024x960, True Color display
mode
Page 4 of 119
5. Supported GPS Models
Model
Garmin™ Mobile® XT
Garmin™ Astro®
Garmin™ Oregon®(all models)
Garmin™ Colorado®(all models)
Garmin™ Nüvi® and Zümo®(all models)
Garmin™ Edge 605, 705®
Garmin™ iQue M3, M4, M5®
Garmin™ eTrex Summit HC®
Garmin™ eTrex Venture Cx, HC®
Garmin™ eTrex Legend, Legend C, Legend Cx,
Legend HCx®
Garmin™ eTrex Vista, Vista C, Vista Cx, Vista HCx®
Garmin™ Rino 120, 130, 520, 530, 520HCx, 530HCx®
Garmin™ GPS V®
Garmin™ GPSMAP 60C, 60CS, 60Cx, 60CSx®
Garmin™ GPSMAP 76, 76S, 76C, 76CS, 76Cx, 76CSx®
Garmin™ GPSMAP 176, 176C, 276C, 376C, 378, 478C®
Garmin™ GPSMAP 96, 96C, 196, 296, 396, 496®
Garmin™ Quest, Quest 2®
Garmin™ Street Pilot i2, i3, i5®
Garmin™ Street Pilot c320, c330, c340®
Garmin™ Street Pilot c530, c550, 580®
Garmin™ Street Pilot 2610, 2620, 2650, 2660®
Both serial and USB data transfer is supported.
NOTE: Mapwel is not affiliated with any manufacturers mentioned here. All brand names and product names are
trademarks of the respective manufacturers.
Page 5 of 119
6. Mapwel Registration
Mapwel is available in free demo version for evaluation purposes. Demo version truncates map uploaded into
GPS (unless it is Mapwel_Island.MPW test file) and it has also the multiple files upload option disabled.
To turn demo into fully-functioning program, user needs to purchase registration password and insert it into
demo main menu / Help / Registration.
Depending on the type of purchased password, Mapwel demo switches to Basic or Advanced registered mode.
If Mapwel is in Advanced version, user can disconnect the registration GPS after the password checking and
attach any compatible GPS for map upload. Basic Mapwel version allows user to upload map only to single GPS
unit.
Page 6 of 119
7. Sample Map
To test the map into GPS upload and to see how the finished map looks in the
Mapwel, use the Mapwel_Island.MPW file in the MAPWEL/FILES folder. You can
upload this map into GPS without truncation even if you have unregistered version
of software.
Note: map elements like areas, lines and symbols appear gradually as you zoom-in
the map in GPS. Use the Setup/Map/Detail menu in GPS to set detail level.
Page 7 of 119
8. Troubleshooting
How to use Mapwel with Garmin Mobile XT ?
Connect your phone to computer with USB cable. Select 'mass storage' mode. After a few seconds Mapwel
should be able to work with the phone like with any other GPS. Try to read GPS ID with use of Mapwel
main menu>GPS>Display GPS ID
Map cannot be found in GPS after upload from Mapwel (MapUpload) program
Most GPS (including Garmin Mobile XT) must be restarted after the map upload. Otherwise, map may be
not visible.
Map is not visible on the GPS screen, although it is listed in map list
Some GPS models (like Garmin Mobile XT) require to turn on 'Outline Detailed Map' option in Tools/Settings/Map. Otherwise, border
of custom map is not visible and this could make the searching for a custom map more difficult.
Another possible cause of this problem is wrong use of the 'Background Area' polygons. These objects are intended to define
irregular shape of the map. GPS displays only objects that are inside of the Background Area (if it is present in the map). Other objects
are ignored. If Background Area polygon is wrongly used as a fill of some map object, the whole map is invisible.
Some maps are not visible on the GPS screen
GPS does not display maps with identical ID. If you use your own numbering of maps (Mapwel > File > Properties > ID), each must
have a unique internal ID number. Unless you select 'User Defined' option, Mapwel assigns unique ID number to each map
automatically.
I use custom colors, symbols and fill patterns in my maps and some of them are displayed in weird
colors in the GPS
Although each map is saved with its own set of user defined colors and styles, GPS uses only one of those
sets. Therefore, all maps that are present in the GPS memory must have the same set of user defined
colors and styles. Otherwise, maps with different user defined sets are displayed with wrong styles.
My custom map completely covers the underlaying maps. Is it possible to make them show through my
map?
Yes, it is possible. Use Mapwel main menu > Edit > Preferences to turn on the 'Transparent map' option.
Then load the map into the GPS.
Map in GPS is displayed in other colors than those that are visible in Mapwel
Map in GPS native format can contain two types of objects: 1. basic, 2. user defined. Objects of basic
type have no color information stored with them. GPS displays them in its own pre-defined colors. User
defined objects have their own color and style assigned by user (Mapwel main menu > Objects > User
Defined Styles). Therefore, you have to use objects from the second category if you want GPS to display
them in your own colors. Moreover, Mapwel allows to draw map objects in the work area in any color to
make creation of map easier. These 'work' colors, however, are not transfered to GPS. To see how the
map will look like in the GPS, please use 'Color' tab at bottom part of the main Mapwel screen.
My auto-vectorized map is displayed as a large colored squares and details appear only when I zoom in
to 120 m
The most deatailed layer of auto-vectorized maps is supposed to appear at higher zoom levels as well.
Page 8 of 119
9. The most deatailed layer of auto-vectorized maps is supposed to appear at higher zoom levels as well.
Check 'Map Detail' setting in your GPS. It should be set to 'Most'.
Map looks good in Mapwel, but after loading to GPS the polylines and/or polygons become distorted and
look like zig-zag line
The finest coordinate grid used in native map format has approximately 2.5 m spacing. If polylines and
polygons in your map contain large number of very small elements, their coordinates are rounded (some up
and some down) when exported to GPS map format, creating a zig-zag effect. The work around is to make
elements of polylines and polygons longer.
Page 9 of 119
10. How to make your own map
Garmin GPS units accept only vector data. Therefore, creation of map in Mapwel involves several steps from
calibration of raster scan or satellite image to upload of vectorized map to GPS.
Raster files used in below example are mw.jpg and mw2.jpg. They can be found in MAPWEL > FILES folder.
Click on any below step to see simple example:
1. Direct image calibration or image editing+georeferencing
2. Background filters (colors)
3. Drawing/import of objects
4. Upload of map into GPS
Some of these steps are not necessarry if your input data are already vectorized and stored in file format
supported by Mapwel (ESRI shapefiles, GPX, MP). Please see the following table for steps needed when working
from a specific data format:
W ork ing from scan, W ork ing from
W ork ing from W ork ing from
ae rial or sate llite m ap in MP
im age (raste r
O ziEx plore r calibrate d ESR I shape file s
form at (ve ctor
im age (raste r im age ) (ve ctor file )
im age ) file )
Image
calibration
use r prom pte d
Map
georeference whe n im porting
shape file
Background
filters
optional optional
Drawing of
optional optional
objects
Upload of map
into GPS
Only the most frequently used methods are shown in above table. Each of them can be combined with use of
your own tracks and waypoints imported from GPS, map files in GPX format downloaded from internet, etc.
There are several ways how to create vector objects for the map
- Manual drawing of objects
- Automatic vectorization of whole raster image
- Automatic tracing of objects from raster image
- Freehand drawing with mouse or tablet
- Import of tracks and waypoints from GPS
- Use of ESRI shapefiles
- Merging of other Mapwel files or other compatible files (*.MP, *.GPX, etc.)
Options for managing maps in your GPS
- Erasing specific map in GPS
- Adding map to maps already present in GPS
Page 10 of 119
11. In case of problems with map uploading or displaying on GPS, please click here.
Page 11 of 119
12. Raster Image Calibration and
Georeferencing
Mapwel provides two approaches to establish relation between raster image and map coordinate system. In both cases, result is a
map with Lat/Lon grid parallel to the screen edges and coordinates assigned to left, right, top and bottom edge of the map.
Selection of proper approach depends on the type of the raster image:
Approach 1 (recommended)
is a direct map calibration. This calibration transforms raster image and vector data drawn on top of
the image to the Lat/Lon grid parallel to the screen edges. This method uses an affine linear
transformation and will work with maps which are rotated or skewed. The Lat/Lon grid of the image
must be linear (straight lines) to allow linear transformation to the grid parallel to screen edges. Even
images with a non-linear Lat/Lon grid can be calibrated with this tool, if the grid non-linearity is caused
by projection (like UTM, for example). In such a case, map usually contains linear Easting/Northing grid
and non-linear Lat/Lon grid. Calibrate map with use of the Easting/Northing grid and Mapwel
recalculates images so that the Lat/Lon grid becomes linear.
Approach 2
involves separate transformation of raster image into rectangular grid, and consequent map
georeferencing. If image (typically distorted scan or map with unknown projection) is curved in a way
that direct calibration cannot be used, it can be edited with tools for rotation, move, cropping, non-
linear straightening and morphing. The goal is to achieve Lat/Lon grid parallel to the screen edges
and optionaly to make raster image match the tracks and waypoints imported from GPS. Once the
image is calibrated, map can be georeferenced with use of 2 points.
Page 12 of 119
13. Image Editing
Mapwel provides several tools for image editing. This chapter deals with image rotation, cropping and
straightening. Editing of raster image is an alternative approach to calibration. Click here for more image
editing and calibration tools.
To rotate, straighten and crop image use following approach:
1. Use main menu > Image > Import function to place image into the work area background. Scanned photo
is usually rotated and distorted.
2. Use main menu > Image > Rotate to Horizontal function to rotate the image. Place the rotation marks on
a line that is supposed to be horizontal. Then click right mouse button and choose Rotate Image command from
the pop-up menu.
Page 13 of 119
14. 3. Image is rotated so that marked grid line is horizontal now.
4. Use the main menu > Image > Straighten function to compensate the image deformity. The tool that
appears in the work area has two main marks (left top and bottom right corner) and 6 additional marks.
Page 14 of 119
15. 5. Place two main marks on map corners first. Then move the rest of marks to a corresponding spots on the map
edge. The black dashed rectangle indicates how the map will be straighten. Click right mouse button and then
choose Straighten Image command from the pop-up menu.
6. Use main menu > Image > Crop function to eliminate the empty space around the map. Place the crop
marks and then click right mouse button to access the pop-up menu. Click on Crop Image item.
Page 15 of 119
17. Map Georeferencing
This tool is supposed to be used if raster image has linear Lat/Lon grid parallel to the screen edges. You do not
need to use this tool if you have calibrated image with a direct Image Calibration tool. Click here for more
image editing and calibration tools.
Mapwel uses coordinates of map edges (left=west, right=east, top=north, bottom=south) as a reference frame
for all calculations.
If coordinates of edges are unknown (most common case), user can define coordinates of any two known spots
and Mapwel derives the edge coordinates from them. These two points must be not located on the same
horizontal or vertical line and they should be as far one from the other as possible.
Georeferencing map with 2 points:
Imagine the map with unknown edge coordinates:
1. Use main menu > File > Georeference Map function to define coordinates of two known spots (grid
intersections, in this case). Place the red marks onto the two known spots. Click right mouse button on the work
area to access a pop-up menu and then assign coordinates to each of the two spots.
Note: W he n using lat/lon coordinate s, we st and south coordinate s are re garde d as if the y we re ne gative , i.e . W 80 is -80, for
e x am ple .
Page 17 of 119
18. 2. Use Apply to Map Coordinates command from the pop-up menu. Note that map edge coordinates are
adjusted automatically according to the two defined spots. Map edge coordinates recalculated to WGS84.
Notes
To change coordinates format, elevation units, distance units, map transparency, transfer speed and curves
precision, use the main menu Edit > Preferences.
Page 18 of 119
19. Background Filters (Colors)
When using imported image as a template for map drawing, it can be usefull to make it brighter, darker or less
saturated to allow objects drawn on the top to be more visible and thus make the work more comfortable.
Use the main menu > Image > Background Filters window to adjust brightness or colors saturation. In this
case the Gamma parameter was adjusted to make image bighter.
Bac kground image is muc h brighter, while all detail is still visible.
Page 19 of 119
21. Drawing of Objects
When drawing this island map, we will follow these steps:
1. Drawing of Areas (ocen, forest, land)
2. Drawing of Lines (land contours)
3. Drawing of Symbols
Some area types (Park) are always displayed beneath others, regardless on their creation order. Therefore, it is
necessarty to ensure that no other area covers them. This is the reason why we will make an opening in the
ocean object.
Areas should overlap each other a bit to avoid of displaying a small gap between the areas in GPS.
1. Areas
Let's draw the ocean area first. As the map is supposed to be rectangular in this case, the edges of ocean area
should lie exactly on the Work Area edges.
Select the Area tool and place the first node somewere near the bottom left corner of the Work Area. Set
the edge type to straight lines (control 1). Check the 'Snap to Work Area Edges' option (2).
Set the object pararmeters name (3) and type (4).
Draw the ocean object by clicking left mouse button on the Work Area. Select each of the nodes (5) and move
it towards the Work Area corner. As the 'Snap' option is ON, the nodes will be snapped to the corners
automatically.
Then click the right mouse button and choose the Finish Object command from the pop-up menu.
The ocean area now covers whole map. It is of an orange color, because this color was set in the Palette. Note
that new object is displayed in the Object Inspector window as a small icon.
Page 21 of 119
22.
Now we will draw an opening for the ocean area to create a hole for the forest object to show through.
Select the Opening tool and draw the hole. After placing the first node, change the edge type to curves.
The future forest object should overlap the ocean and land objects (because forest is displayed beneath all
other objects), while the ocean object should overlap the land (because land will be on top of other areas). This
is the reason why the opening is draw on the edge of the forest (1) and why it ovelaps the land (2).
See below animated example on how to draw area or opening with curves.
Now there is the opening in the ocean object. Note that combined ocean+opening object is displayed in the
object inspector window. Separate parts are displayed in the Parts window to allow user to select and
manipulate them.
Page 22 of 119
23.
To change color of the ocean object, press left mouse button on the color in the Palette and draw color to
object icon in the Object Inspector or to the selected object in the Work Area. Then release the button.
Another way is to click right mouse button on selected object and choose Color c ommand from the pop-up
menu to access the color dialog window.
Now we will draw the second area - forest. Select the Area tool and draw the forest object with use of curves.
Note that forest should overlap all other areas (ocean and land), because it is displayed beneath them. While
drawing the forest, set the area type to Park. Note the 3rd icon in the Park item which indicates that this
object is displayed beneath others.
Page 23 of 119
24. The forest area is finished. Now there are two objects in the Object Inspector window.
We will draw the 3rd type of area - land. Use the same approach as with the forest with a single difference -
the land area is on top of others and therefore you do not have to make overlays. There are 5 land areas in this
example.
Page 24 of 119
25.
2. Lines
Now we will draw the lines (land contours).
Select the Line tool and draw all contours one-by-one with use of the curves. See below animated example
on how to draw line objects.
When lines are finished, select them all and click right mouse button on selection to access the pop-up menu.
Choose Properties to open Properties window and set Land Contour line type.
Page 25 of 119
26. The map looks like this now. Note that when you move cursor over the object icon in the Object Inspector
window, enlarged object icon and its description is displayed in the zoom window.
3. Symbols
Select the Map Feature tool and click on the respective spot on the map to place the symbol. Default type
of map feature is Summit, therefore only the object name should be changed, in the case. Select the object
and click right mouse button to access the pop-up menu. Choose Properties and set the object's name in the
Page 26 of 119
27. Properties window.
Now make the rest of symbols in the map. They are Map Features objects too. Select the Navaid>Racon type
in the Properties window after object is finished.
Page 27 of 119
28.
Duplicate the Racon symbol and place it on the proper spot on the map. This simple example map is finished
now. To check how it will look like in the color or monochrome display GPS click on 'Color' or 'Grey Scale' tabs
in the bottom left corner of the Mapwel. You can switch between the tabs anytime during the map creation.
Page 28 of 119
30. Upload of Map into GPS
Use the main menu > File > Upload Map to GPS c ommand.
In case of problems with map uploading or displaying on GPS, please click here.
Page 30 of 119
31. How to load raster image into GPS
Use the main menu > Image > Automatic Vectorization c ommand.
Page 31 of 119
32. How to acquire GPS ID number
Use the main menu > GPS > Display GPS ID c ommand.
Page 32 of 119
33. Import of ESRI Shape Files
ESRI Shape Files are vector files that contain geographical data and optional attributes. Shape files can
support point, line and area features. Each layer is stored separately. An ESRI shape file consists of main file
(.SHP), an index file (.SHX) and attributes dBASE table (.DBF).
Use the main menu / File / Open or Merge function to import an ESRI shape file and convert it into the
Mapwel map. Then you can upload it into the GPS unit.
As the shape files are primarily not designed to use with GPS units and attributes of objects are specified by
user, Mapwel cannot assign the shape file attributes (data) to the map object properties like Name,
Comment, Type, etc. automatically. User is prompted to assign available shape file data to the map objects.
Because layers are stored in a separate shape files, it is necessary to Merge (with use of main
menu>File>Merge command) all shape files to create complete map in Mapwel. Mapwel stores whole map in a
single MPW file.
Loading of each SHP file involves three steps:
1. Selection of projection and datum used for representation of geographical data in SHP file.
2. Assignment of SHP attributes to types used by Mapwel.
3. Assignment of other SHP attributes representing name, comment, street name, phone number and other
data to Mapwel data structures.
Step 1 - Selection of projection and datum
Use the first tab in the SHP open file dialog to select coordinate system of the SHP file. You have to know
coordinate system of the SHP file. If chosen coordinate system is not the right one, map will be imported
improperly.
UTM Zone Number, UTM Latitude Band Letter and Planar Distance Units are controls for definition of
additional information for UTM system. UTM Latitude band letter affects only selection of the hemisphere
(northern or southern) when converting coordinates from UTM to Lat/Lon. Therefore, you can obtain the
same Lat/Lon coordinates for various band letters.
Use Data Size Reduction control to decrease the number of imported vertices (in case of area and line
objects). If imported data contain too many vertices, displaying of map on the GPS can be very slow. In such
a case, reduce the size of imported data to speed-up the map displaying. Reduction of vertices decreases
also precision of the map elements definition. The highest available accuracy of the map elements uploaded
into the Garmin GPS is approximatelly ±1.2 m. Accuracy of imported data should be lower or equal to this
value to optimize the speed of map displaying and data size.
Border is an empty space added around the map. Imported map may be clipped to bounding rectangle of all
Page 33 of 119
34. objects. Set Border to non-zero value if you need to add empty space around the map. Click left or right
mouse button on the value to increase/decrease it, or click on 'Border' label to set value by keyboard.
Click the Next>> button when you are finished with selection of coordinate system and data size reduction.
To learn about custom (user-defined) projections, click here please.
Step 2 - Assignment of attributes to Mapwel types
If any of the SHP file attributes defines the type of objects, you can use this tab to create attribute-to-
Mapwel type conversion table.
Mapwel cannot recognize meaning of SHP attributes automatically, as they may contain any type of
information. Definition of conversion table allows user to assign proper type to imported objects.
You can skip this step if:
- there is no attribute that defines type of objects
- some attribute already contains Garmin object types
- you do not wish to assign type to objects.
Page 34 of 119
35.
Follow these steps to create conversion table:
A) Select attribute that defines the object types.
B) Click on the first line of the first column in conversion table. Select attribute value from the pop-up menu
that appears.
C) Click on the second column in the same line. Select type of object from the pop-up menu. This type will be
assigned to all imported objects that have attribute ROADCLASS set to value Primary.
Page 35 of 119
36. D) Use Add button to create as many items in the table as neccessary. Define all attribute value - object
type pairs.
When finished, click on the Next>> button.
Step 3 - Assignment of other SHP attributes to
Mapwel data structures
Page 36 of 119
37. If there are attributes, which define the name, comment or other Mapwel-compatible data like street name or
phone number, use this tab to assign them to the respective Mapwel variables.
If imported file has an attribute that conforms the Garmin area, line and point indexing system, assign this
attribute to the Type variable. This condition is usually satisfied by shape files originally created for
GPSmapper software.
If type conversion table was defined in Step 2, Type is automatically set to the respective attribute.
Click the Finish button when the last step is finished.
In this case, imported map has four types of lines: 3 types as defined in the Step 2 and the 4th (default)
type for rest of the lines, which were left with the undefined type.
Page 37 of 119
38. Page 38 of 119
39. Custom (User Defined) Projection
Mapwel supports hundreds of projections and datums. If you need to use custom projection, please use following
approach:
1. Open Userprj.INI file from your Mapwel>Settings folder in any text editor.
2. Edit parameters in either [USER_DEFINED_Transverse_Mercator] or
[USER_DEFINED_Lambert_Conformal_Conic] section, according to the projection method. Then save
the edited file. Please note: change only fields at right side of '=', i.e. the key values. Do not change
section and key names.
3. When using below window for entering coordinates, check the Projection check box and select
X_User_Defined_Transverse_Mercator or X_User_Defined_Lambert_Conformal_Conic projection.
Current version of Mapwel supports transverse Mercator and Lambert conformal conic projections. Support
for other projections will be added in the future.
Custom projections are listed among pre-defined projections in this window,
which pops-up whenever coordinates are converted to WGS84.
Page 39 of 119
40. Map Coordinates
Following procedure is typically used to georeference imported raster image with Lat/Lon grid parallel to the
screen edges, which corner coordinates are known.
Click here for more image editing and calibration tools.
Map coordinates are displayed in a bar at the top part of the main Mapwel window. To enter a non-WGS84
coordinate, click left mouse button on arrow icon at left side of the box, instead of typing the coordinate into
the box.
Boxes for entering map coordinates.
A window for entering and conversion of coordinates in various coordinate systems will appear.
Page 40 of 119
41. Morphing of Image
This tool is intended for use with maps with unknown projection and datum, or with distorted maps. In other
cases, please try direct calibration first.
When drawing vector map with use of scanned paper map and tracks acquired with GPS, you can often
encounter the problem of paper map not matching the tracks, even if it was declared as a 'GPS map'. In such
case another problem pops-out and this is how to draw the rest of objects as it is not clear how to position
them with respect to the measured tracks. If whole image is just shifted, you can use main
menu / Image/ Move function to position the image under vector tracks properly. If deviation between image
and vector parts is not constant, correction requires more labour.
Fig. 1. Me asure d track s do not m atch scanne d pape r m ap ve ry we ll (le ft).
Im age afte r non-line ar calibration with thre e pairs of points (right).
Mapwel provides 'Image Morphing' tool for non-linear calibration of bitmap image to allow user to adjust image
before actually drawing vector objects on top of it. Morphing function uses pairs of points defined by user.
Image is calibrated so that area around the first point of each pair is transformed into area around the second
point of each pair.
Click on main menu / Image / Image Morphing to start image adjustment. The first pair of calibration
points will appear on the screen. They are one of top of the other. Click on the cross indicating position of the
point and move it aside. Now you can see both points in the pair and an arrow between them, which indicates
direction of image transformation in this place.
Fig. 2. Pair of calibration points.
If you click right mouse button on any of the calibration points, a pop-up menu appears, which contains
following c ommand: Preview, Original, Add Pair, Delete Pair, Morph Image, Cancel.
Page 41 of 119
42. Place calibration pair on some corresponding places (fig. 3. left) and use the Preview c ommand from pop-up
menu to see effect of calibration (fig. 3. right). First point of the pair is placed on street on the raster image.
Second point is placed on the corresponding place of the measured track. In Preview, area near first point is
transformed into area near second point and raster image matches the measured tracks much better.
We use Preview for now, because there will be more calibration pairs added. As adjustment is performed on a
raster image, each change could add distortion to the image. Therefore, use Preview to see effect of calibration
until all pairs are added. We will use Morph Image to perform all changes at once at the end of calibration.
Fig. 3. Im age with single pair of calibration points be fore calibration (le ft) and afte r calibration (right).
Now we will add second pair of calibration points to calibrate upper part of the image. Use Add Pair c ommand
from the pop-up menu. Notice that image returns to original form to allow user to place all points under the same
conditions. Use Preview command to see calibration with two pairs. You can switch between Original and
Preview mode to examine points placement and calibration effect.
Fig. 4. Im age with two pairs of calibration points be fore calibration (le ft) and afte r calibration (right).
Measured tracks fit adjusted image quite good now, except the bottom part of the image. There has to be one
Page 42 of 119
43. more calibration pair added.
Usually, there should be not many calibration pairs used, and they should be not placed one near to the other,
because influence of each pair reaches only to the nearest pair. If pairs are too near one to the other, image
gets distorted because of adjustments being too local.
Fig. 5. Im age with two pairs of calibration points be fore calibration (le ft) and afte r calibration (right).
Notice that roads ne ar 3rd pair are calibrate d e ve n whe n the pair
is not place d on any particular obje ct on the im age (le ft).
Use such approach to pre ve nt pairs be ing too ne ar one to the othe r.
The image seems to be calibrated quite well with three pairs of points. So far we were using the Preview mode.
Now click on Morph Image function to perform all adjustments to raster image at once.
When doing a large map, calibrate it part-by-part, each part with use of several pairs (like shown in above
example). Do not calibrate the whole map at once as each pair slows down the calibration process. As the
influence of pairs is more or less local, there is no reason to calibrate large map at once.
Page 43 of 119
44. Move Image
When drawing vector map with use of scanned paper map and tracks acquired with GPS, you can often
encounter the problem of paper map not matching the tracks, even if it was declared as a 'GPS map'. If the
whole image is just shifted, the main menu / Image/ Move function can be used to position the image under
the vector tracks properly. In other cases, please click here for more image editing and calibration tools.
Fig. 1. Im age unde r the ve ctor obje cts ne e ds to be shifte d.
Let's suppose that deviation is constant in this case. Click on main menu / Image/ Move command to start
image adjustment. Place pair of points to mark the current and desired position of any spot on the raster image.
Fig. 2. C urre nt and de sire d position of spot on raste r im age . The shift dire ction is m ark e d by an arrow.
Click right mouse button to access a pop-up menu. Select Move to shift the raster image.
Fig. 3. Im age shifte d to fit unde r the ve ctor obje cts.
Page 44 of 119
45. Exporting Maps
This function can be accessed via main menu > File > Export Map. Use this command to save map in format
other than Mapwel's native MPW format if you need to process data in other software. Mapwel currently
supports data export into Garmin IMG, Google Earth KML and cGPSmapper MP formats.
Mapwel Advanced licence is need to use export function. It is not available in Mapwel Basic.
Google Earth KML (Keyhole Markup Language) format
Maps exported into this format can be open in Google Earth and displayed on top of the earth surface. When
you create your own map, it is very useful to use this function to check accuracy of the map. If the 'terrain'
option in Google Earth is set, map is displayed so that it follows the terrain and it looks like 3D map.
Map e x porte d from Mapwe l in KML form at and loade d into Google Earth.
Map contains polygons, polyline s and sym bols.
PO Is are e x porte d with addre ss info (if supplie d).
Le ft: contour line s from Mapwe l displaye d 3D with 'Te rrain' option in Google Earth.
R ight: m ap from Mapwe l displaye d on top of the sate llite im age in Google Earth.
Garmin IMG format
IMG is native binary format of Garmin GPS units. These files can be loaded into GPS with our freeware
MapUpload (included with Mapwel installation files) or with 3rd party upload software.
Mapwel (both Basic and Advanced) allows to load maps directly into the GPS. If you prefer to use other
uploading method, please note that Garmin GPS units with files 'visible' from PC require all maps to be merged
into single IMG files with name GMAPSUPP.IMG. Find out more here.
Page 45 of 119
46. To define irregular shape of map, use the 'Background Area' polygon object in Mapwel. Please note that map can
contain only 1 object of this type and all other object must lie within its boundaries. If 'Backround Area' is used,
GPS does not display objects outside of this polygon.
IMG File Feature A vailability
Irre gular m ap shape
PO I addre sse s, C ountry and State info support
Use r de fine d zoom le ve ls
Use r de fine d polygons, polyline s and sym bols
Use r de fine d copyright te x t
Lock ing m aps with unlock code
Auto-routing
Marine m aps
Page 46 of 119
47. How to erase all maps in GPS
Use the main menu > GPS > Erase Maps is GPS c ommand.
Page 47 of 119
48. How to compile multiple maps into
IMG format at once
Use the main menu > Files > Batch c ommand.
Page 48 of 119
49. How to erase specific maps
Use the main menu > GPS > Erase Specific Maps command to open window with list of maps to be erased.
The list is empty when window opens.
Click on Get Map List from GPS button to download list of maps from the GPS.
Click on Get Map List from IMG file button to load list of maps stored in the IMG file on PC. IMG file can contain
single map or map set with many maps. Users can build and edit their map set on PC and then load it to multiple
GPS units. Use this option to erase specific maps from your map set file on PC, without need to work with GPS.
Mark maps to be erased by clicking on the respective line of the Erase c olumn.
When finished, click on button to perform erasure. All maps marked by X sign will be erased. This operation
may last even several minutes.
Page 49 of 119
50. How to change serial data transfer speed
Use the main menu > Edit > Preferences command or change the speed in the Map Transfer window.
Page 50 of 119
51. Guide Lines
Guide Lines are horizontal, vertical, or slanted lines that can be placed
anywhere in the work area window to aid in object placement and nodes
alignment.
To create a new guide line, position cursor on either vertical or horizontal
ruler, depress the left mouse button and drag cursor to the work area.
Guide lines can be used for areas and lines splitting. Place the guide line
on the object. Select object and then select the guide line. Click right
mouse button on the guide line to access pop-up menu. Choose Slice
Selected Objects c ommand.
Use main menu > Edit to lock or erase guide lines or to switch on/off
snapping of objects to the guide lines. Use main menu > Nodes to switch
on/off snapping of nodes to the guide lines.
Page 51 of 119
52. How to Create Map of Irregular Shape
If you want to draw your map so that it is not rectangular, in order to not cover surrounding countries, you
have to assign it an irregular shape.
To achieve irregular shape of the map when displayed in GPS, place a special area of Background Area type as
a first object in the map. This area is displayed in pink color in both 'Color' and 'Grey Scale' display modes.
Page 52 of 119
53. How to Measure Track Length
The total length of all selected line objects is displayed in Properties window on the Line Tab.
Page 53 of 119
54. How to define your own area, line
and symbol styles
Use the main menu > Objects > User Defined Styles command to launch the editor of above mentioned
styles.
Page 54 of 119
55. Main Window
1 The Tool Bar contains tools for creation, editing and transformation of objects. Click here to learn
more.
2 Work Area. When starting a new map, the work area is blank. User can import scanned image or
photo into the background of work area. Default colors of work area and grid lines are specified and
can be changed in Edit / Preferences.
3 Display Mode Tabs. In User mode, all objects (background image and map objects) are displayed in
user colors. In Image mode only the background image is displayed. In Vector mode only the map
objects are displayed (in user colors). Grey Scale mode simulates the monochrome display of GPS
units and Color mode simulates the color display of GPS units. Use the last two modes to see how
the map will look in GPS.
4 Button bar. The most used functions from main menu and pop-up menus are accessible through
these buttons.
5 Palette of Colors. Click right mouse button on any color to adjust this color. To change color of an
existing object, press left mouse button on color and drag and drop it on the object icon in Objects
Inspector window or on the selected object in the work area. To set color that will be used for
newly created objects click left mouse button on any color. Color that will be used for new objects is
outlined in black and white.
Page 55 of 119
56. 6 Object Inspector window. All objects
created on working area are displayed
here in order of creation. It shows order
of objects, their type, visibility, name
and comment.
When composing complex map with
many objects, it is sometimes difficult to
isolate desired object in the work area.
Use Object Inspector in this case. To
change order of objects, select them
with right mouse button, drag them to
their new position, and release mouse
button. To Hide/Show object click the
eye icon to the left of each object.
To access menu to duplicate, delete, or
change properties, click right mouse
button on selected objects in Object
Inspector window.
To change color of object in Object
Inspector, press left mouse button on
any color in Palette and drag it to this
object. Then release the button. To select non-contiguous subset of objects, depress the
Another way is to double click the Ctrl key and left click on each object.
object icon to access the color dialog
box, or use the Color command from the In the editing mode the Object Inspector and Part
pop-up menu. Inspector windows are replaced with basic parameters of
the object.
Color can be also dragged and dropped
from object in the list onto the palette. Read more about Object Inspector here.
7 Part Inspector window. Openings (holes) of area objects are displayed here as well as parts of
grouped objects. This window serves to select holes and parts for further manipulation, because they
cannot be selected in work area and in Objects Inspector.
8 Magnifying window. This window displays enlarged area around mouse cursor. It aids precise
placement of nodes, allowing user to maintain view of design in the Work Area. To hide this window,
use View/Zoom Window; this will enlarge the Parts Inspector window. When cursor moves over
Object Inspector, this window displays enlarged object icon and description.
9 Rulers. Press left button on vertical or horizontal ruler and drag mouse to Work Area to create a
Guide Line.
10 Status Bar. The mouse cursor coordinates, zoom and tool hint or other information are displayed
here.
11 Button for sending the map into the GPS unit. Same command is available in main menu / File.
12 Main Menu.
13 Find Object control. Type several characters of searched object name or comment into this box. If
object with name or comment that begins with these characters exists, Object Inspector scrolls the
list to make found object visible and selects it.
14 Zoom Levels Preview. Use this control to preview how map layers will be displayed in GPS at
various zoom levels.
A Snap Nodes options. Use these check boxes to define snapping of nodes to work area edges, guide
lines or other nodes. Snapping helps precise placement of nodes. Same options can be found in main
menu / Nodes.
Page 56 of 119
57. B Edge Mode combo box - choose line or curve edge as default when creating new objects.
C Middle Point First check box - if checked, new curve element is created so that on first click,
line is created. On a second click line turns to a curve using the previous point (end of line) as middle
point of curve. If it is not checked, the curve is created on a first click, but the middle point must be
dragged to proper position.
D Curvature of the rectangle with rounded corners.
E Basic parameters of the newly created object. More parameters can be accessed with use of
Objects / Properties menu after finishing the object.
Page 57 of 119
58. File
The first 6 commands are New, Open, Open Recent, Save, Save As and Merge.
Open and Merge commands allow user to open map files in Mapwel MPW and other formats. Use Merge
command to combine two or more maps. Note that background bitmap is discarded when merging maps. Only
the vector map objects are preserved. Current version of Mapwel supports these formats:
File Format Extension Read Write Comment
Mapwel .MPW
ESRI Shape File .SHP
Google Earth Files exprted in this format can be used
.KML
Keyhole Markup Language with Google Earth
GPS eXchange .GPX
Current v ersion of Mapwel does not
cGPSmapper
.MP support auto routing, streets
GPSMapEdit numbering & marine charts
MapDekode .DBX
OziExplorer Waypoint File .WPT
OziExplorer Track File .PLT
Garmin GPS Database .GDB
Mapwel A dv anced v ersion can export
Garmin .IMG maps into IMG format and/or upload
IMG files into GPS.
Click here to find out more about the ESRI shape files import. Mapwel also supports export into IMG map files
and their upload into GPS (see below), but it does not support editing of these files.
Upload Map to GPS converts the map data into proper GPS format and allows user to upload one or several
MPW and/or IMG map files into the GPS unit.
Upload IMG File to GPS launches the MapUpload.exe program, which allows user to upload one or several
IMG map files into the GPS unit. MapUpload does not perform any checking if IMG file is correct. This function
is intended to allow user to upload map files that he/she has created in other software. MapUpload also
allows user to wrap multiple IMG files into selfextracting .exe file. It is also possible to embed author's logo
and map set image, and optionaly lock maps to a specific GPS ID number. However, protection method
currently used in MapUload is not secure. Note: MapUpload.exe is a separate program that can be found in
the Mapwel folder. Unlike Mapwel itself, MapUpload is FREEWARE and it can be distributed separately. It
cannot be sold.
Countries and Cities. This command is used to define table of countries, states, cities, zip codes and
their mutual links. This table is necessary for creation of Cities and POI (points of interest) objects. For
detail information click here please.
Georeference Map. Use this function to establish relationship between the image coordinates (x,y) with
known real-world coordinates (longitude/latitude). Define location of two spots with known coordinates and
porgram will derive coordinates of the map edges. Mapwel uses coordinates of the map edges for all
calculations. Click here to learn more.
Export Map. Use this command to export map into Garmin IMG, Google Earth KML or cGPSmapper MP map
Page 58 of 119
59. file. This function works only in Advanced version of Mapwel. The GPS unit to which the registration is bound
must be connected and switched on.
Google > Launch Google Maps. Use this command to compare your map created in Mapwel with satellite
image or Google map. It is useful when it is not clear what kind of object the data you are working from
represent. This command opens separate web browser window and launches Google Maps web site with map,
satellite or hybrid image of the area of your map created in Mapwel.
Batch. Use this command to access window for batch conversion of multiple MPW, MP or DBX map files into
the Garmin IMG format. First, select files to convert into the Map Files Table. Then choose the destination
folder for the IMG files and hit Compile button. List of source files can be stored on disc with use of menu >
List > Save command for later re-use.
This function works only in Advanced version of Mapwel. The GPS unit to which the registration is bound must
be connected and switched on.
Merge IMG files. Use this command to merge several IMG maps into a single file. This command is useful if
you want to prepare maps for iQue, Nüvi, Zümo, or Colorado manually. Otherwise, Mapwel makes all map
operations (transfer, add map, erase, erase specific map) and user does not need to use this command.
The last command is Exit, which follows the usual Windows convention prompting user to name the map and
choose a location.
Page 59 of 119
60. GPS
Import Waypoints from GPS. Waypoints acquired by user can be used for map drawing. Import waypoints
from GPS and they become part of the map automatically. Please note that map (the "work area" in Mapwel)
is defined by North, West, South and East boundary (coordinate). User can either import only those
waypoints, which coordinates fit into the map boundaries, or map boundaries can be adjusted automatically
so that all waypoints fit on the map. Use the first option when you add waypoints to an existing map and you
want to ignore the waypoints that are outside of map. Use the second option when you work on a blank
background and you want to import all waypoints from the GPS.
Import Tracks from GPS. Tracks acquired by user can be used for map drawing as well as the waypoints.
Erase Maps in GPS. Use this function to delete all maps in the GPS. Base Map uploaded by manufacturer is
not erased.
Erase Specific Maps. Use this function to delete specific maps in the GPS or in the IMG file that contains
a map set (such file is usually named GMAPSUPP.IMG). Base Map uploaded by manufacturer to GPS is not
erased with this operation. Learn more about this function here.
Display GPS ID. Use this function to find out the unique identification number of the GPS unit defined by
manufacturer.
Page 60 of 119
61. Edit
Use the Preferences command to change the map and data transfer settings. The work area, nodes, edges,
grid and guide lines colors can also be changed under Preferences. Click here for more information.
Snap to Guide Lines snaps selected objects to nearest guide line when user moves objects in the
Transformation mode. Objects are snapped only if they are near to the guide line. This function allows user to
align objects with use of the guide lines. It works with whole objects (not just edited nodes as snap options
under then main menu > Nodes).
Lock Guide Lines disables editing of guide lines and adding of new guide lines. Locking of guide lines prevents
unwanted seizure of guide lines when working with digitized objects in the work area.
Erase Guide Lines deletes all guide lines in the work area.
Copy and Paste are clipboard operations.
Page 61 of 119
62. Image
Import command is used to bring an image into the background as a template for drawing; Mapwel can
import an image in JPG, GIF, BMP, PNG and TIFF formats.
Mapwel can import images up to 7700 x 7700 pixels if run on Windows XP or later, and 3000 x 3000 pixels on
previous versions of Windows. Larger images are scaled down to above size.
Import OziExplorer Calibrated Image command imports OziExplorer *.MAP with raster image and
georeferencing information. Current version of Mapwel supports only *.MAP files in WGS84 with 2 calibration
points. If 7 or more calibration points are used, Mapwel uses only 2 of them for georeference. *.MAP files
with 3-6 calibration points (affine calibration methods) are not supported.
Background Filters and Edit Image Window are described separately.
Rotate to Vertical and Rotate to Horizontal are tools for rotation of image. They are intended for precise
rotation of images that contain either vertical or horizontal lines (grid). Place rotation marks on the object
(line) in the image and then click right mouse button on the work area. Select 'Rotate Image' from the pop-up
menu. Image will be rotated so that marked line is vertical or horizontal, respectively. Please note: use Edit
Image Window for rotation of image with angle parameter.
Crop is tool for precise placement of crop marks and cropping of the image. Place crop marks on the image
and then click right mouse button on the 'scissors' symbol near the crop mark. Please note: Edit Image
Window can be used for cropping of image too.
Straighten. Use this tool to compensate distortion of scanned images or photos. If deformed image has
edges or grid that are supposed to be orthogonal, set the red marks on these deformed lines. Then click the
right mouse button on the work area and select 'Straighten Image' command from the pop-up menu. Image
will be transformed so that selected shape becomes a rectangle (see below image: blue shape transforms into
a black rectangle)
Image Morphing. Use this tool for non-linear calibration of raster image according to measured tracks and
waypoints. Image is calibrated with pairs of points that define source and destination areas of projection.
Move. Use this tool to move image under the vector map.
Calibration. Use his tool to calibrate image and the vector data drawn on top of the image.
Delete Image if you want to reduce the size of the MPW file (for publishing map on the Internet, for
example) and you do no longer need the background image.
Export as BMP saves your cropped and adjusted image as a separate bitmap file. Use this function if you
need to use the image in other application. Mapwel stores map, image and all other data in a single MPW file.
Automatical Vectorization. Use this tool for quick creation of GPS map from raster image.
Acquire (Scan) ... command launches the image scanning software. This command work with scanners that
support TWAIN. Scanned image is transferred into background of the work area as if it was loaded with
Import c ommand.
Page 62 of 119
63. Page 63 of 119
64. Nodes
The Nodes Menu is accessible only in creation/editing mode.
Align Beginning to Previous Object moves the beginning of an edited object to the end of previous object.
The next command, Align End to Next Object, causes the end of the object being edited to the beginning of
the next object.
Align Line Beginning to beginning of Previous. When doing a complex line, some line parts start not on
end of previous part, but on its beginning, instead. Use this function to place beginning of the new part
exactly on beginning of previous part.
Reverse Nodes Order changes the order of nodes.
Use Delete Whole Edge command to erase whole edge and start its creation anew.
Snap nodes to Work Area Edges, Snap to Guide Lines, Snap to Nodes, Snap to Object Edges are
options for alignment of nodes during editing or creation of object. Nodes are snapped only if they are moved
near to the work area edges, guide lines, other nodes or edges of other objects, respectively.
Please note: these options affect snapping of the edited nodes. Snap options under the main menu > Edit
affect snapping of the whole objects.
Page 64 of 119
65. Shape
The Shape Menu is accessible only in the creation/editing mode. To use any of the 10 commands, place at
least one node in the work area, then select one of the shapes and draw it in the work area. Right mouse
click and select To Elements from the small pop-up menu. Mapwel will move the last node to the nearest
point on the shape just created and the shape will be started from that point. This means the shape can be
started from any point.
Page 65 of 119
66. Objects
Edit switches selected object to editing mode.
Group is function for combining several objects into one for easier manipulations. This lets you apply the
same transformations, properties and other changes to all the objects within the group at the same time.
Use Ungroup function to divide grouped objects.
Sort Colors function changes order of selected objects so that objects of the same color are in the
successive order.
Sort Types changes order of selected objects so that Areas are listed first, Lines are next and then Points
of Interest, Exits, Cities and Map Features. This function helps you to organize objects in your map.
Sort Names function sorts selected objects alphabetically.
User Defined Styles command launches editor of filled areas, lines and symbols.
Page 66 of 119
67. Transform
Transformation Window command opens window for alignment of 2 or more selected objects. This command
may be useful when drawing reference frames (circles) around some object
Please note: use main menu > Convert > Create Circle around Point c ommand for easier and more
precise drawing of reference circles.
Combine Outlines makes single line object from series of lines.
Expand Objects enlarges selected objects by offsetting the object contours. It is intended for creation of
overlay of constant width between adjacent objects. Expand Objects command does not provide the same
result as normal enlargement.
Shrink Objects reduces size of selected objects by offsetting the object contours. Shrink Objects command
does not provide the same result as normal size reduction.
Shaping submenu contains commands for so called boolean operations on the filled areas. These operations
include union, intersection and difference. Click here for more information.
Page 67 of 119
68. Convert
The Convert commands work on objects selected with the Transform Tool (arrow) or in Objects Inspector.
Create Line from Area creates line object from selected area object. If area object has openings, program
will create also lines from openings as a separate objects.
Create Area from Opening creates a new area object from selected opening in an existing area. Opening
must be selected in the Parts Inspector window. This command is intended for situation when user needs to
create object of other color for a hole (opening) in the area. User should adjust the newly created area or
the opening to make them overlay each other, to avoid gaps when displayed in the GPS.
Create Area from Line creates a new area object from selected line object. If area is not closed, program
automatically closes it.
It is important to note that above commands will duplicate an object and then convert the new object as
selected. Below commands just convert selected objects without duplication.
Area to Opening command can be used to convert areas like land or islands to openings in the underlaying
area like ocean, for example. Map may display faster in GPS if island is made as an opening in the ocean area,
letting the background (yellow) area showing through, as opposite to island being a land area put on top of
the solid ocean area. In the first case, GPS has lower number of layers to display.
When converting selected areas to openings, some area object must precede selected objects in the list, as
newly created openings cannot be a stand alone objects and they must follow after the area object.
Map Feature to POI and POI to Map feature convert respective type of points into the other type.
Area to POI can be used to convert small areas like buildings into the points of interest.
Swap Object Name and Comment command helps to manipulate objects in the list when using the Sort
objects on Name function.
Create Circle around Point creates "circles" of defined radius around all selected points. Near poles very
large "circles" look deformed (see below image), because of coordinate system projection. However, real-
world distance from center to any point on the "circle" is the same.
Page 68 of 119
69. Select
Commands in this menu allow to select vector objects with use of various criteria, or modify existing selection.
The first command is Zoom to Selected Objects. This command scrolls selected object(s) to center of the
screen and zooms in or out to fit selection to the screen. It helps to localize object(s) selected in the
Inspector window in the work area.
Next c ommand Zoom and Edit Selected Objects works in the same way as above command, but it also starts
nodes editing mode.
New Selection, Add to Selection and Select Subset options allow to define the way of how vector objects
are selected.
Rest of the commands in this menu allows to select multiple objects of the same type (like Roads, POIs with
address) at once. They work with either whole map or just selection, according to selection mode defined by
above options.
Page 69 of 119
70. View
Unlike the Eye icon in the Object Inspector window which hides/shows only particular objects, commands in
the View Menu hide/show all objects that fit user-specified criteria.
Areas, Lines, Points of Interest, Map Features, Cities, Exits settings show or hide respective type of objects.
Area Captions, Line Captions, Symbol Captions show or hide names (captions) of respective type of
objects in the work area. Symbols are all point objects (Points of Interest, Map Features, Cities, Exits).
Fill of Areas. Uncheck this setting to turn into the "wire frame" display mode. This is useful for example when you need to
make overlay of the Areas.
Show/Hide Objects. Use this sub-menu to show and hide set of selected or unselected objects.
Guide Lines, Button Bar, Grid, Rulers settings show or hide respective controls of the work area.
Zoom Window shows/hides zoom window in the bottom right corner of the screen. Hiding this window is
useful in case of low screen resolution (800x600, for example) to enlarge Object Inspector window.
GPS Display Frame. Check this setting to show frame of the GPS unit display in the 'gray scale' and 'color'
modes. This function allows you to see if map does not have too much detail and if it will be legible on the
GPS display. To change size of the display frame, click on the GPS icon in the upper-left corner with right
mouse button.
Nighttime, Marine Colors. Use these settings to change the map colors in 'gray scale' and 'color' display
mode. Marine colors works in both 'gray scale' and 'color' display mode. Nighttime has effect only in the 'color'
mode.
Start-up Window with Videos List. Uncheck this option if you do not want the list of tutorial videos to pop-
up when starting the Mapwel.
Page 70 of 119
71. Object Inspector
The main features of Object Inspector are described in Main Window chapter.
Right click on selected object or objects in Object Inspector to access a pop-up menu for operations with
selected objects.
For meaning of Group and Ungroup commands please see Main Menu / Objects chapter.
To select and manipulate openings or grouped objects, use the Part Inspector window beneath the Object
Inspector window. It is not possible to select these parts directly on the Work Area.
To change order of objects in Object Inspector, select an object with a left click, depress the right mouse
button and drag it to its new position in the list. Then release the right button and, from the menu that appears,
choose whether the selection should be placed Before or After the item. You can choose also the Set
Identical Parameters command to copy properties from one object to another of the same type.
Double click on the object name to open the Properties window.
1 2 3 4 5 List item in the Inspector window
Zoom Nam e 1. Eye icon for showing/hiding object, 2. Small picture of object, 3. Type of
Level & C om m e nt object, 4. Name and comment of object.
Object is visible. Left click on the icon to hide the object.
Object is invisible. Left click on the icon to show the object.
Object Icon.
Object is Area.
Page 71 of 119
72. Object is Area of type that is always displayed behind other objects.
Object is Line.
Object is land or depth contour (Line).
Object is railroad (Line).
Object is river (Line).
Object is trail (Line).
Object is Line of road type.
Object is Line of road type, with a road sign.
Object is Point of Interest (POI) with empty address fields.
Object is Point of Interest (POI) with address.
Object is City.
Object is Map Feature.
Object is Exit.
Object is Opening in the Area. Openings are displayed in the Parts window.
Object is composed of several other objects that are grouped.
Nam e
& C om m e nt Name and comment of object. Click on it to change object properties.
A6 Automatic zoom level of object.
4 Individually set zoom level of object.
Page 72 of 119
73. Tools
From top to bottom:
- Select and Transform Tool
- Edit Edges Tool
- Zoom Tool
- Zoom 1 Tool
- Pan Tool
- Create Area Tool
- Create Opening Tool
- Create Line Tool
- Create Point of Interest (POI) Tool
- Create City Tool
- Create Map Feature Tool
- Create Exit Tool
- Create Autorouting Highway *
- Create Autorouting Street *
- Create Autorouting Road *
- Create Marine Area **
- Create Marine Line **
- Create Marine Point **
- Create object with Freehand
- Trace tool (tool for vectorization of raster images)
* Tools available only in the Mapwel versions that support autorouting.
** Tools available only in the Mapwel versions that support marine charts.
Use zoom tool to zoom in (left mouse button click) or zoom out (right mouse button click). If you want to zoom
in a specific area, depress the left mouse button and drag mouse to make selection. Then release the mouse
button and selected area will be enlarged so that it fits on the screen.
Opening can be used only after Area or previous Opening object. It does not appear in Object Inspector
window as a separate object and cannot be selected directly on the Work Area. To select the Opening object
for transformation, use the Part Inspector window.
To add Opening to Area, the Area must be either selected or it must be the last object in the Object Inspector
list.
Page 73 of 119
74. Freehand Tool
Freehand tool works like a painting tool. Unlike the other Mapwel tools, which are based on the precise
manual placement of the nodes, curves and lines, Freehand tool allows to draw many of the Mapwel objects
with a free hand. Strokes are automatically converted to a chosen style. After conversion, strokes can be
edited as other vector objects (node by node). The Freehand tool can be combined with any other tools in
the Mapwel.
Like other creation tools in Mapwel, Freehand tool can be used with various display modes (User, Grayscale,
Color).
Freehand tool can work with any Microsoft Windows compatible mouse or digitizing tablet. Its use is not
restricted to any specific brand of tablet.
Before you start actual drawing with the Freehand tool, you should choose the style you want to use. Click
with right mouse button or corresponding tablet pen button depressed on the Freehand icon (in the Tool
Bar). Panel with freehand styles will appear (picture below). This panel can be invoked also by holding the
left mouse button or tablet pen tip depressed about 1 second on the Freehand icon.
Each style is represented by its icon. Hover the cursor over the icon to display the style name. Select desired
freehand style to activate the tool. Mapwel will switch to creation/editing mode.
Freehand Styles
1 Area
2 Opening of Area or Marine Area
3 Line/Road
4 Autorouting Highway *
5 Autorouting Street *
6 Autorouting Road *
7 Marine Area **
8 Marine Line **
* Styles available only in the Mapwel versions that support autorouting.
** Styles available only in the Mapwel versions that support marine charts.
Click left mouse button or tablet pen on the Freehand tool to start drawing. When the Freehand tool is active,
parameters of respective style are displayed on panel at the right side of the Mapwel window. After Stroke
options allow to configure the Freehand tool. For example, it is possible to define whether to finish freehand
mode after a single stroke or reactivate the tool.
Page 74 of 119
75. Freehand Options
Meaning of the After Stroke options is as follows:
- Finish Object - converts stroke into nodes and finishes creation/editing immediatelly
- Edit - converts stroke into nodes and switches to normal nodes editing mode
- Another stroke - converts stroke into nodes and allows to add another strokes.
When finished, single vector object contains several strokes.
Only one of above options can be active at once.
If Reactivate tool is checked, Mapwel automatically reactivates Freehand tool after
each stroke. This feature works only with Finish object option. To end strokes
creation, hit ESC or ENTER (RETURN) key on the keyboard, or click the STOP button
above the freehand options.
Page 75 of 119
76. Trace Tool
Trace Tool lets you create vector objects from raster images. This process is almost (though not entirely)
automatical. Trace tool allows to vectorize one object (or set of similar objects) at once, but it cannot
vectorize whole map with different types of objects at once. Tracing should be repeated for respective types
of objects (filled areas, roads, rivers, etc.). Trace tools works on images with any common color depth
(including True Color and bi-tone) that are sufficiently clean.
Raster image should be imported into work area with use of main menu>Image>Import c ommand.
Vectorization involves several steps (please see animated Fig.1):
1. Activation of the trace tool, choosing of the proper trace style (see Fig.2).
2. Setting of magic wand tolerance, selection options and vector object properties.
3. Selection of respective object or multiple objects on raster image with magic wand.
4. Setting of vector objects parameters (type of line, zoom level, etc.)
5. Conversion of selected raster objects into vector objects.
Fig. 1. Animation - Use of the Trace Tool
Before you start using the Trace tool, you should choose the style you want to use. Click with right mouse
button on the Trace tool icon (in the Tool Bar). Panel with trace styles will appear (picture below). This
panel can be invoked also by holding the left mouse button depressed about 1 second on the Trace tool icon.
Each style is represented by its icon. Hover the cursor over the icon to display the style name. Select desired
style to activate the tool. Mapwel will switch to creation/editing mode.
Page 76 of 119
77. Fig. 2. Trace Tool styles (styles 3-7 are not available in the current version of Mapwel).
Tab. 1. Trace Styles
1 Area
3 Line/Road
4 Autorouting Highway *
5 Autorouting Street *
6 Autorouting Road *
7 Marine Area **
8 Marine Line **
* Styles available only in the Mapwel versions that support autorouting.
** Styles available only in the Mapwel versions that support marine charts.
Trace Controls
Use these controls to adjust:
- Parameters of vector objects
- Magic wand sensitivity (tolerance)
- Selection operations for selecting multiple objects
Color box - define color of vector objects. "Auto Color" must be unchecked.
Auto Color - color of vector objects will be taken from raster image.
Simplicity - varies in range 0..10.
0 means precise vector objects with high number of elements. 10 means low precision
and low number of elements.
Edge Type combol box - select curve (polycurve) or straight lines (polyline) type of
vector objects
Ignore Openings - valid only for filled areas. Holes in vectorized areas are ignored,
only the outer shape is vectorized.
Selection - various operations for selection of multiple or complex objects. Use "Add
Similar" if you want to select non-contiguous objects of similar color at once.
Page 77 of 119
78. User Defined Styles
Some Garmin GPS units support user defined styles* for filled areas, lines and points. Mapwel software includes editor
of these styles and library of predefined styles. Editor allows user to create her/his own fill patterns, colors, line
styles and point icons (cities, map features, points of interest and exits). New styles are saved with map in Mapwel
*.MPW format.
* Support of use r de fine d style s m a y re quire upgra de of the GPS firm ware . Use r de fine d style s we re succe ssfully te ste d on GPSm ap 60C ,
60C Sx , Nuvi a nd Vista C . If m a p with use r de fine d style s is loade d to Garm in GPS that doe s not support the m , obje cts are displaye d with
use of the GPS built-in style s, i.e . use r de fine d style s a re not use d.
Warning: if you cre a te m a p for loa ding into se ve ra l type s of GPS units, m ak e sure that all of the m support use r de fine d style s, be fore
actual cre ation of the m a p!
GPS units support single se t of use r de fine d style s for a ll m aps in the m e m ory. If m aps with diffe re nt se ts of style s are loade d into GPS
toge the r, only one se t of style s is a ctive , i.e . som e m a ps will be displaye d with wrong style s. Use menu>File>Save Whole Set and
menu>File>Open Whole Set com m a nds to copy a ll style s from one m ap to anothe r, to e nsure that the y use the sam e se t of style s.
Use r de fine d style s for fille d are a, line and point of inte re st.
It is also possible to save respective new styles as a separate files to disk, for future use in other maps, or to export
styles in *.txt format to use with other mapping software.
Library of pre de fine d style s.
Editor of user styles can be accessed with Mapwel main menu > Objects > User Defined Styles, or with pop-up
menu in the Properties window.
Page 78 of 119
79.
Filled Areas
Editor of user styles contains separate tabs (1) for editing of areas, lines and points. User defined areas are bitmaps
of 32x32 pixels size. Only 2 colors (foreground and background) per pixel are allowed. User can define one pair of
colors for GPS daytime mode (13) and another pair for the nighttime mode (14). Use of the background colors is
optional. If they are not used, the area will be transparent.
It is possible to define name of the style (displayed by some GPS units) in up to 4 languages. Use table (15) to
type-in the name of the style. use right mouse button click on the Language column to choose from available
languages.
Page 79 of 119
80. Zoom level (16) control allows to define maximum zoom level at which the object using this style will be visible in
the GPS.
Layer specifies order in which object will drawn by the GPS. By assignment of proper layers user can define which
object will be drawn on top of the other objects.
Please see below table for description of the rest of the controls.
1 Tabs with editors for areas, lines and points.
Editor zoom control. It is also possible to use mouse wheel to zoom the work area
2
in and out.
Open and Save buttons. Use these buttons (or menu>File) to open or save styles
3
from/to library.
4 Pencil tool.
5 Paint Bucket tool.
6 Clear style button.
7 Scroll buttons.
8 Menu.
9 Work area.
Color palette. Some GPS units (GPSmap 60CSx, for example) use fixed 256-colors
palette. Use default colors from this palette to ensure that your styles will look the
Page 80 of 119