1. .
ACCIDENT INVOLVEMENT OF YOUNG PEOPLE AND THEIR TRAFFIC
SAFETY ATTITUDES
HERMAN KATTELER
CLARA WOLDRINGH
ITS, RADBOUD UNIVERSITY NIJMEGEN, NL
Phone +31 24 365 3570
E-mail h.katteler@its.ru.nl
ABSTRACT
This paper describes the results of an in-depth study among pupils in secondary school age to
investigate their attitudes related to traffic safety. The study was initiated in the context of a policy
to further guide the development of traffic safety education. Youngsters' attitudes were measured
in seven domains, such as risk perception and risk taking, alcohol and drugs, propensity to group
conformity and traffic safety related norms and values such as indifference in behaving unsafely.
A further feature of the study was the measurement of pupils’ actual accident involvement. This
provided empirical evidence for the relevance of attitudes to accident involvement. This
knowledge provides guidance to the search for the most effective orientation of traffic safety
education. The Dutch Ministries of Education and Transport initiated the study.
The study is based on a sample of 1.680 pupils in the Netherlands. The bike is their dominant
way of transport. Forty percent of them face four or more risky traffic situations to/from school
every day. Young people are a high-risk group in terms of accidents. It could be shown that
specific attitudes correlate strongly to actual accident involvement. No evidence was found for
any correlation between pupils’ knowledge of traffic rules and accident involvement. Within the
set of attitudes, the most predictive ones are the propensity to follow group norms and the
propensity to behave decently in traffic. Other important attitude domains are the attitude towards
cycling when having drunk and the degree in which youngsters tend to accept risk in traffic.
Attitudes worsen as children get older. The study confirms that measures in terms of
infrastructure are insufficient to prevent accidents. Education is a necessary supplement.
1. AIM OF THE STUDY
Young people are a high-risk group in terms of accidents of cyclists. The bike is their dominant
way of transport in secondary school age. Unsafe behaviour is considered a major reason of
accident involvement. It was considered useful to identify factors that lie behind those differences
in traffic behaviour of young people. As far as those factors can be influenced by education,
safety education would have a strong lead. This need led to a nation-wide study among 12-16
years-old pupils in secondary education. The study was initiated and supervised by the Dutch
Ministry of Education and the Ministry of Transport.
The aim of the study was to get an overview on the state of affairs among young people with
respect to knowledge, attitudes and action tendencies related to traffic safety. To this end, a test
instrument was developed. The study was consciously given a comprehensive approach,
addressing pupils’ attitudes and action tendencies as well as their knowledge of traffic related
aspects. These aspects covered a wide range of traffic safety related domains. This would allow
conclusions on useful accents in safety education that is usually dominated by its cognitive
orientation focusing on knowledge of road signs and traffic rules.
The research team added an extra element to the study by measuring the accident involvement
of the youngsters. As far as evidence would indicate that specific attitudes correlate rather
1
2. strongly with accident involvement, traffic safety education would find a lead for further
development. If these specific attitudes can be influenced, traffic safety education has an even
stronger case.
The thorough measurement of attitudes is typical for the study (Woldringh and Katteler, 2002). As
such, it fits with other studies that focused on attitudes towards traffic safety related aspects.
Studies focused usually on safety measures, such as seat belt usage or speed limits, or on
enforcement of traffic regulations or traffic safety related behaviour, particularly the use of alcohol
(e.g. SARTRE, 1998; Cauzard and Quimby, 2000). Other studies focused on specific groups
such as young drivers and, more specifically, the attitudes of novice drivers (e.g. Laapotti et al.,
2002). The study discussed in this paper, is different from those studies given the broad scope
(coverage of both knowledge and attitudes; coverage of several safety related domains) and the
correlation with accident involvement that was sought.
Sections 2 and 3 include methodological issues. Section 4 gives selected results of the test.
Section 5 describes how accident involvement was measured and in what degree knowledge and
attitudes are correlated to accident involvement.
2. MEASUREMENT OF ATTITUDES
2.1 Selection of domains
The objective to attain a broad overview of the state of affairs regarding young peoples’ traffic
related knowledge, understanding and attitudes raised preliminary questions to the research
team: knowledge of what? Attitudes towards what exactly? The starting-point was the choice to
cover a broad spectrum of domains and to include all possibly relevant domains. This choice for a
comprehensive model required an overview of those domains that could be considered relevant
to traffic behaviour. This overview could be put together on the basis of expert views on domains
that should be learning objectives in education. Eleven experts had commonly identified ten
objects/domains as elementary conditions to safe traffic behaviour. Within each domain, sub-
domains in terms of knowledge aspects, attitudes and cognitive skills were identified. In total, the
experts identified over 20 sub-domains as learning objectives in safety education (Twisk, 1999).
The research team considered the number of 10 main domains as too high and removed
domains that had a relatively low degree of relevance to traffic safety or where the relation to
traffic safety was considered too indirect (such as mode choice). The preparatory work resulted in
the selection of seven domains that would be covered by the test. These traffic safety related
domains are the following:
1. Traffic rules;
2. Ability to identify risky situations (risk identification);
3. Ability to put oneself in someone else’s position in traffic (changing of perspective);
4. Alcohol and drugs in relation to traffic
5. Dealing with group pressure; lead behaviour;
6. Safe use of the bike; injury protection (physical aspects);
7. Traffic behaviour related norms and values.
Selection of concepts
The choice for a comprehensive approach also included different measurement levels such as
knowledge and attitudes. In fact, the preparatory stage of the study focused, among others, on
the question towards which levels the test should be oriented. Experts distinguished between
knowledge and cognitive skills. Although this distinction is valid, hardly any differences could be
made in the later stage in which operational definitions of the constructs were made. Therefore, it
was decided to combine knowledge and cognitive skills into one level. As far as the attitude level
was concerned, the study team decided to distinguish between an emotional component on the
one hand and action tendencies on the other hand, according to the socio-psychological tradition
with respect to attitudes. As a consequence, a set of three levels (knowledge in a broad sense;
2
3. emotion and action tendency) was realised. Subsequently, the test instrument can be said to
have a broad orientation, both in terms of covered domains and levels within each domain.
Seven domains and three levels theoretically make for 21 sub-domains. A few sub-domains could
be ignored, as these sub-domains were not relevant (e.g. knowledge of group pressure).
Eighteen sub-domains remained as relevant areas to cover. Since several sub-domains were
thought to include more than one relevant concept, the total number of concepts to measure
became even larger. For example, the following three variables were identified in the sub-domain
‘norms and values at the attitude level’:
- Appreciation of traffic safety (to what extent do young people attach value to behaving safely
or to using the road in a safety context?);
- Attitude towards incorrect traffic behaviour of the pupil himself/herself (does the pupil feel
indifferently or is the pupil sensitive to own faults?);
- Attitude towards incorrect traffic behaviour of others.
Also three concepts were distinguished in the sub-domain ‘knowledge of traffic rules’:
- Knowledge of traffic rules and traffic signs;
- Knowledge of the informal basic rule of behaving in traffic (not to bring yourself or others in
danger);
- Ability to apply rules.
Table 1 shows the 7 domains, 3 levels and 25 concepts that were covered by the test instrument.
Horizontal reading gives the concepts used per domain whereas e.g. all attitude variables are
given when reading vertically.
Each of the 25 concepts required to be laid down into measurable terms. The development of the
test had to take into account the following set of conditions.
- Target group consists of 12-16 years-old pupils;
- The test should be applicable and understandable for pupils in all types of education, varying
from special education to all types of secondary education.
- The test should allow pupils to answer individually;
- The length of the test should not exceed one lesson of 45 minutes.
In addition to these requirements, it was considered necessary to realise variation in the
presentation of the items in order to keep the pupil’s attention. This was realised by offering
photographs and illustrated traffic situations. However, the majority of the domains were
addressed by item sets (Likert scales). he primary challenge was developing a test that is
applicable for pupils of any intellectual level and, at the same time, discriminating young people
with different safety related knowledge and attitudes.
Table 1. Domains and concepts covered by the test
Level
Domain
Knowledge Attitude Action tendency
Traffic rules - Knowledge of traffic
rules and traffic signs;
- Knowledge of informal
basic traffic rule
- Ability to apply rules
- Importance attached
to rules/signs
- Attitude towards non-
conformity
- Non-conformity
(self-profile)
Risk identification - Distinguishing ability
in recognising risks
- Sensitivity to risk - Risk acceptance
Change of
perspective
- Understanding of
blind spot
- Feeling when
hindering
- Consideration for
(vulnerable) road
users
Alcohol, drugs - Blood alcohol level
permitted
- Consequences of use
of alcohol/drugs
- Towards people who
drive with alcohol
- Using alcohol when
using the bike
Dealing with
group pressure
- Propensity to group
conformity
- Degree of peer
behaviour
3
4. Physical aspects - Factors that affect
vehicle’s braking
distance
- Use of safety
increasing attributes1)
Norms and values - Towards pupil’s own
incorrect behaviour;
- Towards others’
incorrect behaviour;
- Appreciation of traffic
safety
- Propensity to decent
traffic behaviour
- Self-profile
1. E.g., the willingness to be clearly visible
Defining indicators of one particular concept caused insurmountable difficulties, namely the ability
in distinguishing risky situations from less risky situations. In trying to present photographs with
different degrees of safety risks, it had to be concluded that even experts could not reach
agreement on which situations could be considered risky and which situations not really risky.
This distinction was sought in order to have an inter-subjective common view against which the
individual assessments of pupils could be judged. As a consequence, the concept ‘ability in
recognising risky situations’ could not be used. Ultimately, youngsters’ reactions on 2
photographs and 7 statements (‘the presented situation is hardly/ a little/ very risky’) were used to
infer a measure of risk sensitivity.
Most concepts were measured using scale construction. This required a set of items per concept.
Special attention was given to requirements of reliability and validity. The scale reliability could
technically be tested (see section 3). In the stage of development of the test, the validity of
individual items and photographs was checked in terms of face validity using the judgement of
experts. They judged on the degree in which the operational definitions could be considered a
realistic and valid representation of the concept in question. In a later stage of the project, the
validity could be checked against some logically expected correlations, such as the higher level of
knowledge of pupils of 14-15 years old versus pupils of 12-13 years-old.
3. THE RESEARCH PROCESS
Test development
Three main development stages preceded the nation-wide use of the test among secondary
school pupils. The stages were:
Stage 1: The construction of operational definitions;
Stage 2: Testing of the instrument;
Stage 3: Checking for the scalability of the item sets.
All chosen concepts within the seven domains were defined in operational terms in the first stage.
When possible, previously used operational definitions that already approved to be reliable, were
selected. However, this could only be done in a minority of the concepts. The test mainly
consisted of a mixture of questions and statements, some of which were visualised with
photographs and schematically presented traffic situations. The measurement of action
tendencies inevitably had a self-report nature. Experiences elsewhere did not discourage this
strategy (Hatakka et al., 1997).
Pre-tests were conducted to check the comprehensibility and the practicability of the diverse
components of the instrument. The items needed to be understandable for pupils of the lowest
classes in special education. Therefore, a first pre-test focused on pupils in special education.
This resulted in the inclusion of very basic traffic situations, enabling the research team to
measure knowledge of elementary traffic rules. A second pre-test was held among 43 pupils in
different types of education. Pupils were asked to indicate the degree of complexity of each block
of questions. The contents of parts of the test were individually discussed with the test leader.
This gave the information, among others, that the use of popular slang was not appreciated. For
example, the statement ‘someone who ... is a sissy’ was removed for that reason. Further point of
attention was the test duration. Although the majority of the pupils could complete the test within
4
5. the lesson of 45 minutes, one-third of the pupils could not. Therefore, the number of items had to
be reduced.
A third pre-test was held among 234 pupils in 12 classes within six schools. Obviously,
comprehensibility and practicability received substantial attention. Further reduction of the
number of items appeared necessary. The selection of items that should be removed was guided
by the level of difficulty of the item and by the items’ behaviour in terms of scalability. Scalability
tests were a major objective of this pre-test stage. The pre-test revealed that reliable scales for
the majority of the concepts could be constructed.
The preparatory work resulted in a test instrument, consisting of 110 questions or items that
defined the 25 concepts across the seven domains at the knowledge, the attitude and the action
tendency level. Additionally, the test instrument included indicators of the home-school route, in
particular the type of obstacles encountered every day (such as roundabouts and ungated railway
crossings) and the number of obscure crossings. This allowed comparing the relative importance
of knowledge, attitudes and infrastructure related risk exposure to accident involvement.
Nation-wide measurement
A sample of schools in The Netherlands was selected taking into account the distribution of
schools across regions and the number of pupils in different types of education. Within each
school, three classes were selected spread across the school years 1, 2 and 3 (pupils of 12-15/16
years-old). A total number of 26 schools participated in the test. Fourteen of the schools were
secondary schools oriented towards vocational education (‘vmbo’). This followed the fact that
about 55% of all pupils in secondary education in the Netherlands receive basic vocational
education. Pupils in the 3rd
school year and pupils in ‘vmbo’ were underrepresented in the
realised sample. As far as the realised sample did not match the distribution of the total
population of pupils, data were weighted.
The study comprised a sample of 1.681 young people aged 12 - 16 years, selected in the
stratified sample of all types of schools and school years. The pupils completed the
comprehensive self-administered questionnaire in class answering on statements, illustrations
and photographs. Almost half of the respondents (45%) belonged to the age category of 12 -13
years old. The other half was 14-15 years old with a small group in the age category of 16 years.
Most pupils in the sample usually come to school by bike (89%). The sample could well
distinguish between cyclists who face complex crossings daily and those who do not.
Scale construction
Most concepts were indicated by a set of items. Factor analysis checked whether each set of
items represented one underlying concept. A scalability test was carried out for all item sets that
were available for scale construction. Cronbach’s alpha was used to indicate the reliability of each
scale. A minimum value of .65 for attitude scales was required to continue the process of scale
construction. Scales could be constructed for each of the seven domains.
The average score on the scale items determined pupils’ position on each scale. Scale classes
were defined independently of the frequency scores. Since the study objective was to get an
overview of the state of affairs of knowledge and attitudes, well interpretable and ‘objective’ class
positions were preferred. Each scale received five positions, ranging from very low to very high
(knowledge level) or from very negative to very positive (attitudes). This procedure allowed
conclusions of the type: ‘x percent of the pupils show a strong tendency to accept risk in their
traffic behaviour’ or ‘y percent of the pupils have a positive attitude with regard to their own
drinking behaviour when faced with travel’.
The question remains whether or not the knowledge level or attitude level of young people can be
considered positive enough. Should 70% of the sample be positive to decide that the population
of pupils has an acceptable level? Will 60% do? Or should traffic education aim at 80% or even
5
6. higher? The subject of setting standards was discussed on the basis of the study results. Two
types of standards were advocated and used. An empirical standard was identified on the basis
of the scores of those pupils who had no accident involvement. This inevitably included a
different standard per concept. A normative standard was set, claiming 80% of the youngsters
should be positive in whatever respect, taking into account that the current level of accident
involvement is too high. The subject of setting standards goes beyond the scope of this paper.
4. KNOWLEDGE AND ATTITUDES: SELECTED RESULTS
This section presents results on young people’s knowledge and attitudes. Obtaining this type of
result was the major goal of the study. Because this paper’s objective is to demonstrate the
relation of knowledge/attitudes and accident involvement, rather than to focus on the state of
affairs in terms of knowledge and attitudes of young people, only a limited selection of results will
be given.
Young people’s knowledge
In fact, measurement of pupils’ knowledge of traffic rules and traffic signs was part of the test,
realising that knowledge is essential for safe participation in traffic, but not an evident predictor of
safe behaviour. Safety education without attention given to traffic rules is hardly conceivable. The
test instrument wanted to establish whether or not the 12-15 years-old age category has
mastered basic rules. The test items indicated real basic knowledge level by presenting
elementary right-of-way situations. Eight of the ten illustrated pictures contained only two road
users of which always one bike-rider. Each road user should be able to answer these correctly.
Although a high proportion of pupils could be expected to master the right-of-way rules, the
outcome can be considered disappointing. One-third of the pupils achieved poorly with a
maximum of 6 correctly interpreted traffic situations. Combined with an additional 20 percent of
the pupils that missed three questions, half of the young people cannot be said to have mastered
basic right-of-way rules that are recurrent every day. Interestingly to observe, incorrect answers
include a tendency to overcautious behaviour. ‘Stronger’ road users are given way more
frequently than vice versa. This tendency partly explains that poor knowledge does not correlate
to accident involvement (see section 5).
Boys and girls as well as age groups show similarities in terms of basic knowledge of priority
rules. A remarkable difference was observed between knowledge level and type of school. Pupils
on vocational training oriented schools (‘vmbo') show a lower level of knowledge than pupils on
secondary schools with highest level of education (see Figure 1). It can be seen that basic
knowledge is different per school year within the vmbo-type of schools. This ultimately results in a
large knowledge gap between pupils of a pre-vocational level in year 1 (30% of pupils mastered
basic rules) and pupils in general secondary education in year 3 (60%).
Figure 1. Knowledge level of basic rules per school year and school type
6
7. Young people’s attitudes and action tendencies
A diversity of attitudes and action tendencies related to traffic and traffic safety were measured.
Although the concepts might be overlapping to some extent, each of the concepts emphasise a
special area of traffic safety behaviour such as being considerate to other road users (e.g. older
people), showing consideration for incorrect behaviour of others and propensities such as non-
conformity to traffic rules, following group behaviour or using alcohol when participating in traffic.
The sample of young people did not score equally across the various attitudes. Although many of
the attitude scales correlate positively to each other, the scales appear to cover different aspects
of the traffic behaviour spectrum. A large part of the sample had negative scores with respect to
four attitudes and action tendencies. These concepts are:
- Attitude towards pupil’s own unsafe behaviour. This scale was based on 6 items.
- Propensity to behave decently. Five items were used, e.g. pupil’s reaction when approaching
a pedestrian crossing where a pedestrian hints that he will cross over, or how a pupil reacts
when he is about to be knocked down by a car but is saved by an emergency brake of the
car.
- Attitude towards group following behaviour (4 items).
- Action tendency in terms of the use of safety increasing attributes such as willingness to be
clearly visible after dark (4 items).
The attitude of the sample population to their own unsafe behaviour is shown here as an
illustration. Six items were used, including: ‘After I have done something really dangerous in
traffic, I do not feel ashamed about it’ and ‘If you have to chose between a pleasant, but less safe
route or a safe, but less pleasant route, which one do you normally chose?’ Boys showed a
slightly more negative attitude in this respect than girls. This tendency was consistent across
almost all attitudes and concepts: girls generally have better attitudes than boys. Different
accents in attitude towards own unsafe behaviour were found between pupils in distinct school
years (see Table 2). Differences between youngsters in rural areas and youngsters in cities could
not be found.
Table 2. Pupils’ attitude towards own unsafe or safe behaviour
All pupils Boys Girls Year 1 Year 2 Year 3
negative/indifferent 1)
34% 39% 26% 27% 33% 42%
neutral 29% 28% 29% 24% 32% 30%
positive/feeling guilty 37% 33% 45% 49% 35% 28%
Total (100%) (1681) (912) (758) (629) (592) (460)
1. In terms of ‘does not feel ashamed when other road user falls due to pupil’s unsafe behaviour’, or: pupil
prefers unsafe but pleasant trajectory over safe but less pleasant trajectory, etcetera.
7
30%
33%
45%
55% 55%
60%
0%
10%
20%
30%
40%
50%
60%
70%
vmbo-1 vmbo-2 vmbo-3 havo/vwo-
1
havo/vwo-
2
havo/vwo-
3
8. In contrast to those four scales on which rather many young people scored negatively, other
attitudes showed more positive results. One of these concepts was the propensity to risky
behaviour. Two-thirds of the pupils in the sample claimed to never or, at the most, sometimes
take risks. The remaining one-third admitted to take risks frequently. Although risk-taking as an
action tendency has a relatively favourable position in the whole of attitudes, many young people
(in absolute sense) accept a clearly increased chance of incidents or accidents due to their
conscious risky behaviour on a regular basis.
A second concept that scored relatively well was the attitude towards the use of alcohol when
participating in traffic. Four items were used to scale pupils on a continuum. One of the
statements to answer was: ‘I think that if someone is half drunk, he can still ride a bicycle’.
According to the scale based on the four items, slightly more than half of the sample can be said
to have a critical, scrupulous attitude in this respect. However, attitudes worsen when children get
older. A high proportion (70%) of 12 years-old pupils held a critical view on alcohol usage in
relation to traffic behaviour, against 42% of 15 years-old pupils (see Figure 2).
Figure 2. Development of knowledge and attitude with respect to alcohol by age group
Two additional tendencies can be observed in Figure 2. Attitude and knowledge show opposite
patterns. When children get older, their knowledge of effects of alcohol improves. However, their
attitudes worsen. Since attitudes most probably influence behaviour stronger than knowledge
does, this pattern can be considered a threat for safe behaviour.
As a third tendency, attitudes seem to improve when young people get 16 years old. Although the
number of 16 years-old pupils in the study was limited and the change of the curve is modest, this
pattern can also be found in studies concerning youthful deviant behaviour, particularly minor
offences (van der Laan and Essers, 1998). This similarity suggests that attitudes with respect to
safe and unsafe behaviour in traffic is an exponent of a more general pattern of deteriorating
attitudes correlated to increasing age in the adolescent years. In turn, this could imply the
usefulness of a broad educational approach in which safety education is embedded.
5. ACCIDENT INVOLVEMENT
Measuring accident involvement
The measurement of accident involvement was not part of the original study objectives. However,
it was acknowledged that the study would gain relevancy by demonstrating correlation between
young people’s accident involvement and their traffic related knowledge or attitudes. In fact, the
importance of traffic safety education would be underlined when a relation is empirically
established.
Accident involvement was measured on a detailed basis. The measurement took into account
that accident involvement actually has levels of seriousness ranging from more severe accidents
with hospitalisation to incidents with a lucky escape. Inevitably, the design was confined to self-
8
0
20
40
60
80
12 13 14 15 16
good know ledge of effects of alcohol usage critical attitude
9. reported accidents. Within this context, the pupils were asked to report on their involvement in
three types of accidents in the last two years:
- Accidents resulting in hospitalisation or medical treatment;
- Accidents with just material damage;
- Near-accidents.
The research team was fully aware that pupils’ interpretation of situations in terms of near-
accidents might differ and that retrospection might influence the results to some extent.
Nevertheless, these disadvantages were considered secondary to the improved validity and the
more balanced approach surpassing the practice to regard equally registered accidents or injuries
and accident involvement.
Whereas the percentage of pupils with injuries in the last two years appeared to be at a ten
percent level, substantial more young people faced an accident with material damage (34%). In
total, 38% of the pupils were involved in accidents of a physical or material type. Almost half of
these pupils were involved in accidents more than once. Apart from the involvement in accidents
either with physical injuries or with material damage, half of the pupils reported that they had one
or more near-accidents (also labelled as incidents here). Technically, this enabled discriminating
pupils according to this dependent variable and to correlate with knowledge and attitudes.
Conceptually, the high number of pupils that appear to have had accidents or near-accidents
reinforces the idea that accident involvement includes a gradual phenomenon ranging from near-
accidents to fatal accidents. Figure 3 shows the degree in which pupils claimed to be involved in
the different types of accidents.
Figure 3. Pupils’ involvement in different accident types (N=1.681)
In total, the minority of the pupils aged 12-16 year was not involved in any accident type whereas
60% of the pupils claimed that they were involved in an accident or incident in the last two years.
This accident involvement was occasional for less than half of these pupils whereas more than
half of the pupils with accident experience claimed to be more regularly, some even frequently
involved in (near-) accidents. On balance, 34 percent of the pupils were fairly frequently involved
in (near-) accidents.
It is interesting to observe from the data that near-accidents are a first step to the occurrence of
accidents. Data showed that those pupils who got injured or had material damage accidents also
had relatively many near-accidents and, vice versa, most young people without near-accidents
were not involved in traffic accidents.
Table 3. Relation between accidents and near-accidents (pupils 12-16 years old)
Near-accidents
Real accidents
Practically
never
A couple of
incidents
Almost every
month or even
every week
Total
Not involved in accidents 64% 27% 9% 100%
9
11
34
50
60
0
20
40
60
80
100
injured material near-
accident
total
10. (968)
Once involved 47% 35% 18% 100%
(332)
Upward of twice involved 20% 46% 34% 100%
(247)
Total 53% 32% 15% 100%
(1.547)
Pearson correlation r = .34; p < .001
It should be noted that a part of the accidents happened through no fault of the pupil. The figures
mentioned before do not take this fact into account. Since pupils also indicated whether or not the
accident happened due to own or other people’s fault, data allow focussing on accidents that
happened through their own fault. Accidents with material damage and near-accidents were
reported to have happened as frequently through their own fault as through other people’s fault.
According to the pupils to whom injuries happened, other road users caused these accidents
more frequently. Data do not suggest that pupils answered on a socially desirable way.
Characteristics of the home-school trajectory were identified in terms of recurrence of risky traffic
situations (such as roundabouts, obscure crossings or cycling on roads without separate bicycle
markings) and the length of the trajectory. Data demonstrated that the accident involvement is
clearly related to the trajectory’s infrastructure. For example, 55% of the pupils who usually
encounter two or more risky traffic situations faced several near-accidents in the last two years
whereas ‘only’ 37% of those who have none or only one obstacle had a near-accident. This
strengthened the idea that the operational definition of the concept of accident involvement was a
valid one.
Attitudes and accident involvement
The empirical study distinguished traffic safety related knowledge and attitudes. No evidence was
found for any correlation between pupils’ knowledge of traffic rules and accident involvement.
Also other knowledge concepts such as knowledge of effects of the use of alcohol or drugs in
traffic did not show to be correlated to accident involvement. Better knowledge does not imply
safer behaviour according to these findings.
Unlike knowledge, attitudes of young people appear to correlate rather strongly with accident
involvement. Within the set of attitudes, the most predictive ones are the propensity to follow
group norms and the propensity to behave decently in traffic. Both attitudes showed a Pearson-r
correlation with real accidents (injuries; material damage) of r=.17 and a Pearson r-correlation of .
30 with near-accidents. Other important attitude domains are the attitude towards riding a bike
after drinking alcohol and the degree in which youngsters tend to accept risk in traffic. It also
turns out that safe use of the bike (e.g. the use of a dynamo after dark and riding with proper
brakes) has predictive value for accident involvement. Generally, attitudes and action tendencies
can be said to correlate to accident involvement.
Multiple regression analysis was performed in order to describe the total variance in accident
involvement in the sample of pupils. Analysis showed that 6 attitude variables could explain 13
percent of the total variance (multiple correlation coefficient r=.36). The actual significance of
these outcomes is that traffic related attitudes matter. A relatively large part of young people with
negative attitudes is involved in accidents whereas young people with positive attitudes and
action tendencies are less involved in accidents.
A multiple stepwise regression analysis was carried out as a final analysis including both attitudes
and infrastructure variables. The best combination of variables that explain the maximum of
variance in accident involvement in the sample of pupils is shown in Table 4. Six variables explain
15 percent of the total variance (r=.39). Two of the variables significantly contributing after
selection of other variables in the model, are infrastructure related (length of trajectory; number of
risky traffic situations) and four variables are attitudes or action tendencies.
10
11. Table 4. Selection of set of variables most predictive of accident involvement
Model R R-square Increase R-
square
Level of
significance
Tendency to follow group norms .283 .080 .080 .000
+ use of safe bike attributes .321 .103 .023 .000
+ number of risky situations on-route .354 .125 .022 .000
+ tendency to behave decently .369 .136 .011 .000
+ length of home-school trajectory .381 .145 .009 .000
+ degree of risk acceptance .390 .152 .007 .001
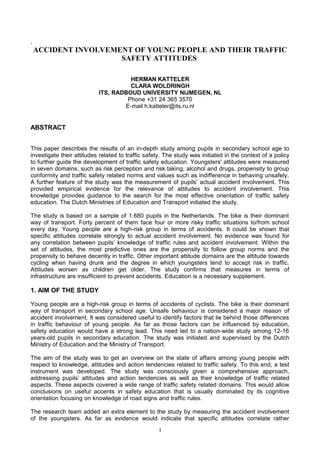
Figure 4. Predictive power of groups of variables
A final assessment was made by comparing the relevancy of attitudes to road infrastructure
characteristics in terms of predictive value for accident involvement. To this end, multiple
regression analysis was carried out for 3 variables (risk exposure in terms of length of school
route and type of risky traffic situations on-route). Figure 4 shows that attitudes are firm predictors
of accident involvement. Home-school infrastructure does influence the occurrence of accidents
but to a lower extent (r=.19). Personal and demographic characteristics such as sex, age group,
type of residential area hardly contribute to the chance to get involved in an accident.
CONCLUSIONS
The study among pupils in secondary education had a comprehensive approach covering seven
traffic safety related domains and measuring knowledge, attitudes and action tendencies.
Additionally, accident involvement was measured, distinguishing different types of accidents and
near-accidents. The study provided empirical evidence that traffic related attitudes influence
accident involvement. Young people with negative attitudes were more frequently involved in
accidents than young people with positive attitudes. Two of the predictive attitudes were the
tendency to follow group norms and the degree of risk acceptance. In contrast to attitudes, no
empirical evidence could be found for any correlation between knowledge and accident
involvement. Attitudes appeared to be firmer predictors of accident involvement than obstacles on
the home-school route. Since attitudes and action tendencies lead to higher accident rates, the
study results underline the relevancy of traffic safety education of young people. Safety education
has even a stronger case when taking into account the compliancy of attitudes.
REFERENCES
Cauzard, J. and Quimby, A (2002) Individual differences in attitudes to enforcement of traffic
regulations. Working paper 8, ESCAPE project.
Hatakka, M., Keskinen, E., Katila, A. and Laapotti, S. (1997) Self-reported driving habits are valid
predictors of violations and accidents. Proceedings, Traffic and Transport Psychology. Elsevier
Science.
11
A tt it u d e s
. 3 6
I n fr a s tr u c t u r e
. 1 9
D e m o g r a p h y
. 0 6
C o r r e la t io n
w it h
a c c id e n t in v o lv e m e n t
12. Laan, P. van der, and Essers, A. (1998) Ontwikkeling van de jeugdcriminaliteit: periode 1980-
1996. Een tussentijds verslag. WODC, Den Haag.
Laapotti, S., Keskinen, E. and Rajalin, S. (2002) The attitudes of young male and female drivers
towards traffic in 1978 and 2001. Liikenneturva.
SARTRE 2 (1998) The attitude and behaviour of European car drivers to road safety. Part 4,
Report on Central European Countries.
Twisk, D. (1999) Elementaire leerdoelen voor verkeerseducatie in het voortgezet onderwijs.
SWOV, Leidschendam.
Woldringh, C. and Katteler, H (2002) Kennis, houding en gedrag t.a.v. verkeersveiligheid bij
leerlingen in de basisvorming. ITS, Nijmegen.
12