SlideShare uma empresa Scribd logo
1 de 56
Baixar para ler offline
www.restaurant.org/forecast

                                                    FEATURED 2012 CONSUMER RESEARCH SECTION


                                                    Decoding
                                                    Consumers
                                                        in a
                                                           Challenging
                                                            ECONOMY


                                                       n
                                          Hunkered-dow


                Op
                     timistic


                                                            Cautious


            Scan this QR code or visit
            www.restaurant.org/forecast
            to view the 2012 Restaurant
            Industry Forecast video
Shared Vision of the National Restaurant Association,
National Restaurant Association Educational Foundation and State
Restaurant Associations:
We will lead America’s restaurant industry into a new era of prosperity,
prominence and participation, enhancing the quality of life for all
we serve.


                                                                              FOLLOW
                                                                              www.twitter.com/
                                                                              WeRRestaurants


MISSION                                  MISSION
We exist to help our members             As the philanthropic foundation
                                                                              JOIN
— the cornerstone of their               of the National Restaurant           www.facebook.com/
communities — build customer             Association, we exist to enhance     NationalRestaurantAssociation
loyalty, rewarding careers and           the restaurant industry’s service
financial success.                       to the public through education,
                                         community engagement and the
                                         promotion of career opportunities.

                                                                              WATCH
                                                                              www.youtube.com/
                                                                              restaurantdotorg
We create value
for our members in five ways:
•	 Advocacy and representation
	 Building and sustaining positive public opinion and a favorable political
  environment.                                                                CONNECT
                                                                              www.linkedin.com/
• Tools and solutions                                                         groups?gid=37937
	 Helping grow revenues, increase profitability and develop employees.
• Education and networking
	 Providing opportunities to connect and learn from each other.
• Research and insights
	 Anticipating and preparing for emerging trends that could impact
                                                                              VIEW
  restaurants.                                                                www.flickr.com/photos/
• Responsible stewardship                                                     restaurantdotorg
	 Providing thought leadership to inspire community involvement and
  impact.


                         www.restaurant.org
Inside
The National Restaurant Association is
pleased to provide the 2012 Restaurant
Industry Forecast, our 43rd annual profile
of restaurant-industry opportunities and
challenges for the year ahead. The
research and insights are based on
analysis of the latest economic data, as
well as extensive surveys of restaurateurs
and consumers.
The National Restaurant Association will
closely monitor incoming industry and
economic data in the months ahead and
provide updates to this Forecast at
www.restaurant.org/research.
The 2012 Restaurant Industry Forecast
was prepared by the National Restaurant
Association Research and Knowledge
Group:

Hudson Riehle
Senior Vice President, Research
and Knowledge

Bruce Grindy
Chief Economist


Tim Smith
Art Director
                                             2012 Sales Projections....................................................................................................2
Annika Stensson
Public Relations
                                             Decoding Consumers in a Challenging Economy.........................................................9
Jennifer Batty
Editor                                       Economic Outlook..........................................................................................................15


                                             Fullservice Outlook.........................................................................................................21


                                             Limited-Service Outlook................................................................................................27


                                             Other Foodservice Segments.........................................................................................33
1200 17th St., NW, Washington, DC 20036
(800) 424-5156 | www.restaurant.org          Food and Menu Trends..................................................................................................35
© 2012 National Restaurant Association
                                             Workforce Outlook........................................................................................................41
ISBN 978-1-931400-74-9

                                             Supply-Chain Outlook....................................................................................................47

Thank you to our National Restaurant         Appendix........................................................................................................................50
Association 2012 Restaurant Industry
Forecast sponsor:


                                                                                   www.restaurant.org                   |   National Restaurant Association                       1
Sales Outlook                                                                                                              2012 Restaurant Industry Forecast


2012:
Achieving Growth
in a Challenging Environment
2012 Restaurant Industry Forecast


D
          riven by the continued national       choose one restaurant over another. To                             rants in the current environment.
          economic recovery and consumers’      help operators better attract and retain                               The second segment looks at frequent
          pent-up demand for the food,          customers, the 2012 Forecast analyzes                              restaurant customers. These consumers are
service and social outlet that restaurants      consumers by creating two segments.                                critical to the restaurant industry in good
provide, the U.S. restaurant industry is           One segment looks at consumers by                               economic times, and are even more
projected to expand in 2012. According to       their financial situation and spending                             important in the current environment. The
the National Restaurant Association’s 2012      patterns. The result is the creation of three                      three categories analyzed are: Frequent
Restaurant Industry Forecast, total             distinct consumer categories: Optimistic                           Fullservice Customers, Frequent Quickser-
restaurant-industry sales are projected to      Consumers, Cautious Consumers and                                  vice Customers and Frequent Off-Premises
reach a record high of $631.8 billion in        Hunkered-Down Consumers. Each group                                Dinner Customers. Each frequent customer
2012, a 3.5 percent increase over 2011 and      has a different mindset about the econo-                           uses his or her respective segment more
the second consecutive year that industry       my, and a different way of using restau-                           than once a week, on average.
sales topped the $600 billion level.
   In inflation-adjusted terms, total
restaurant sales are projected to grow 0.8
percent in 2012, down slightly from a 1.3
percent gain in 2011. Although both the
                                                Adding It All Up: $631.8 billion
nominal and real growth rates will be           Projected restaurant-industry sales in 2012
somewhat below the 2011 gains, industry
growth will remain in positive territory for     Commercial Restaurant Services                  $575.1 billion
the third consecutive year. This follows the
unprecedented two straight years of real          	 Eating places*: $419.2 billion

sales declines in 2008 and 2009.                  	 Bars and taverns: $18.9 billion


Anticipating Consumers’                           	 Managed services: $44.4 billion
Needs
In addition to revealing the Association’s        	 Lodging places: $31.4 billion
sales and economic projections on the
national and state levels, the 2012 Forecast      	 Retail, vending, recreation, mobile: $61.2 billion
also takes a detailed look at the mindset
and spending patterns of consumers.                        Noncommercial Restaurant Services                  $54.2 billion
   To be successful in today’s challenging
business environment, restaurant opera-         *Eating places include fullservice restaurants and limited-
tors need to understand what makes              service (quickservice) restaurants, cafeterias and buffets,      Military Restaurant Services   $2.5 billion
                                                social caterers, and snack and nonalcoholic beverage bars.
customers tick and what motivates them to


2        National Restaurant Association   |   www.restaurant.org
2012 Restaurant Industry Forecast                                                                                                                                                                            Sales Outlook


   Restaurant-Industry                                                                          Restaurant-Industry                                                                                Restaurant-Industry
   Share of the Food Dollar                                                                     Sales                                                                                              Employment


               $                                        $
                                                                                                (Billions of Current Dollars)                                                                                                                           14.3 million
                                                                                                                                                              $631.8                                                         12.9 million
                                                                                                                                                                                                    11.4 million
        25%                                      48%                                                                                           $379.0
                                                                                                                                   $239.3
                                                                                                                 $119.6
                                                                                                   $42.8

               1955                                 Present                                        1970 1980 1990 2000 2012*                                                                                 2002                   2012*                 2022*
                                                                                                                                                              *Projected                                                                                         *Projected


42 Years of Restaurant-Industry Sales
This chart shows sales growth for the restaurant industry since 1971, when the National Restaurant Association began issuing its annual
forecast. The chart shows growth in the number of dollars spent each year in restaurants as well as real (inflation-adjusted) sales growth.

          12.8%
                                      12.4%
                     11.8%                          12.3%


                 11.6%   11.5%
                                                               9.9%
                                 10.8%


                                                                                                                                                                                        2012
                                                                                                                                                                                                              Current dollar growth: 3.5%
                                                        9.2%                 8.0%                      7.9%
                                                                                       8.3%                                                                                                                   Real (inflation-adjusted) growth: 0.8%
       8.4%                                                                                                    7.2%
7.7%                                                                                       6.6%
                                                                                                                                                                                                                           6.2%
                                                                      6.9%                                                                                                       5.8%
                                                                                                              6.1%                                                                             5.5%
                                                                                    5.8%                                     5.3%                                                                            5.3%                  5.3%
              5.1%          5.0%                                                                                                                            5.0%                                                                                4.8%
                                                                                                                                                     4.7%            4.6%
       4.4%                                                                                                                            4.2%                                             5.3%
                                   4.2%                                                                                                                                                                                                                             4.0%
                                                                             3.8% 3.8%                 4.0%                                                                                           4.6%                               4.7%
                                                                                                                                              4.4%                                                                  4.5%
                                          3.2%                                                                                                                     4.2%                                                                          3.5%
3.0%                 3.0%                                                                                                   3.4%                     2.9%                        3.0% 2.9% 3.0%                            3.0%
                                                                                                              2.8%                                          2.7%                                                                                          3.1%             3.5%
                                                                                                2.5%                                          2.3%
                                                                                         2.1%                                          2.1%                               2.0%                                      2.1%          2.2%
                                                 1.6%                 1.6%                                                                                         1.5%                                                                  1.6%
                                                               1.2%                                                  1.2%                                                                                    1.2%                                                   1.3%
                                                                                                                                                                                                                                                1.0%                       0.8%
                                                                                                                                                                                                      0.8%                                                   0.6%
                                                                                                                            0.5%


                 –0.2%                              –0.1%                                                                          –0.2%
                                                                                                                                                                                                                                                   –0.9%–0.6%


                                                                                                                                                                                                                                                         –2.8%


1971                 1975                               1980                             1985                               1990                            1995                               2000                               2005                       2010          2012


   Current dollar growth                          Real (inflation-adjusted) growth
Growth rates are estimated for 2008 to 2010 and projected for 2011 and 2012. Providing final estimates for restaurant-industry sales from previous years is an ongoing process.
The National Restaurant Association’s Restaurant TrendMapper offers updated sales estimates as they become available.
Visit www.restaurant.org/trendmapper to learn more.
Source: National Restaurant Association


                                                                                                                                           www.restaurant.org                                  |    National Restaurant Association                                           3
Sales Outlook                                                                                          2012 Restaurant Industry Forecast


What’s in Store for                                                                                                      Footnotes:


Restaurant-Industry Sales
                                                                                                                         1	 Data are given only
                                                                                                                            for establishments
                                                                                                                            with payroll.
                                                                                                                         2	Waiter/waitress
                                                                                                                           service is provided,
Restaurant-industry food-and-drink sales: Projections for 2012                                                             and the order is taken
                                                                                                                           while the patron is
                                                                                                                           seated. Patrons pay
				                                              ‘11–’12 %                                                                after they eat.

	  2011 Projected	   2012 Projected	  ‘11–’12 %	 Real Growth                                                             3	 Patrons generally
                                                                                                                            order at a cash
	 F&D Sales ($000)	 F&D Sales ($000)	  Change	     Change                                                                   register or select items
                                                                                                                            from a food bar and
                                                                                                                            pay before they eat.
 GROUP I — COMMERCIAL RESTAURANT SERVICES1
                                                                                                                         4	 Formerly commercial
 EATING PLACES                                                                                                              cafeterias.
 	 Fullservice restaurants2	                                $195,711,168	    $201,386,792		    2.9%	 0.2%                5	 Food-and-drink sales
                                                                                                                            for non-payroll
 	 Limited-service (quickservice) restaurants3	              168,527,095	     173,751,435		    3.1%	 0.4%                   establishments are
 	 Cafeterias, grill-buffets and buffets4	                     8,249,697	       8,472,439		    2.7%	 0.0%                   projected to total
                                                                                                                            $12,615,226,000.
 	 Snack and nonalcoholic beverage bars	                      26,580,519	      27,670,321		    4.1%	 1.4%
                                                                                                                         6	 Also referred to as
 	 Social caterers	                                            7,513,666	       7,934,432		    5.6%	 2.9%                   onsite food-service
 	 TOTAL EATING PLACES	                                     $406,582,145	    $419,215,419		    3.1%	 0.4%                   and food contractors.

 Bars and taverns	                                            18,359,387	      18,910,169		    3.0%	 0.4%                7	 Includes drug- and
                                                                                                                            proprietary-store
 	 TOTAL EATING-AND-DRINKING PLACES	                        $424,941,532	    $438,125,588	 	
                                                                                         5
                                                                                               3.1%	0.4%                    restaurants, general-
                                                                                                                            merchandise-store
 MANAGED SERVICES6                                                                                                          restaurants, variety-
 	 Manufacturing and industrial plants	                       $7,007,302	      $7,340,408		    4.8%	       2.1%             store restaurants,
                                                                                                                            food-store
 	 Commercial and office buildings	                            2,611,070	       2,684,180		    2.8%	       0.1%             restaurants and
 	 Hospitals and nursing homes	                                5,170,569	       5,460,121		    5.6%	       2.7%             grocery-store
                                                                                                                            restaurants
 	 Colleges and universities	                                 13,889,332	      14,418,786		    3.8%	       0.6%             (including a portion
 	 Primary and secondary schools	                              6,041,190	       6,294,920		    4.2%	       1.4%             of delis and all salad
                                                                                                                            bars), gasoline-
 	 In-transit restaurant services (airlines)	                  2,263,753	       2,342,985		    3.5%	       0.8%             service-station
                                                                                                                            restaurants and
 	 Recreation and sports centers	                              5,611,996	       5,875,760		    4.7%	       2.0%             miscellaneous
 	 TOTAL MANAGED SERVICES	                                   $42,595,212	     $44,417,160		    4.3%	       1.4%             retailers.
 LODGING PLACES                                                                                                          8	 Includes movies,
                                                                                                                            bowling lanes,
 	 Hotel restaurants	                                        $29,602,800	     $30,994,132		    4.7%	       2.0%             recreation and sport
 	 Other accommodation restaurants	                              397,166	         419,805		    5.7%	       3.0%             centers.

 	 TOTAL LODGING PLACES	                                     $29,999,966	     $31,413,937		    4.7%	       2.0%          9	 Includes sales of hot
                                                                                                                            food, sandwiches,
 Retail-host restaurants7	                                    33,152,723	      35,111,790		    5.9%	       3.2%             pastries, coffee and
                                                                                                                            other hot beverages.
 Recreation and sports8	                                      12,922,544	      13,496,710		    4.4%	       1.7%
                                                                                                                         10	Business,
 Mobile caterers	                                                628,422	         653,685		    4.0%	       1.3%             educational,
 Vending and nonstore retailers9	                             11,537,834	      11,883,970		    3.0%	       0.7%             governmental or
                                                                                                                            institutional
 TOTAL — GROUP I	                                           $555,778,233	    $575,102,840		    3.5%	       0.8%             organizations that
                                                                                                                            operate their own
                                                                                                                            restaurant services.
 GROUP II — NONCOMMERCIAL RESTAURANT SERVICES10                                                                          11	Includes industrial
 Employee restaurant services11	                         $424,157	               $440,942		    4.0%	       0.9%             and commercial
                                                                                                                            organizations,
 Public and parochial elementary, secondary schools	    6,617,656	              6,844,963		    3.4%	       0.6%             seagoing and inland-
 Colleges and universities	                             7,206,760	              7,478,958		    3.8%	       0.6%             waterway vessels.
                                                                                                                         12	 Includes voluntary and
 Transportation	                                        2,069,914	              2,175,955		    5.1%	       2.3%              proprietary hospitals;
 Hospitals12	                                          15,755,054	             16,375,645		    3.9%	       1.2%              long-term general,
                                                                                                                             TB, nervous and
 Nursing homes, homes for the aged, blind, orphans,                                                                          mental hospitals; and
 and the mentally and physically disabled13	            7,908,212	              8,192,908		    3.6%	       0.8%              sales or commercial
                                                                                                                             equivalent to
 Clubs, sporting and recreational camps	                9,404,611	              9,711,534		    3.3%	       0.6%              employees in state
 Community centers	                                     2,901,663	              3,006,123		    3.6%	       0.8%              and local short-term
                                                                                                                             hospitals and federal
 TOTAL — GROUP II	                                    $52,288,027	            $54,227,028		    3.7%	       0.9%              hospitals.
 TOTAL — GROUPS I AND II	                            $608,066,260	           $629,329,868		    3.5%	       0.8%          13	Sales (commercial
                                                                                                                            equivalent) calculated
                                                                                                                            for nursing homes
 GROUP III — MILITARY RESTAURANT SERVICES14			                                                                              and homes for the
                                                                                                                            aged only. All others
 Officers’ and NCO clubs (Open mess)	      $1,626,203	 $1,722,149		 5.9%	                                  3.2%             in this grouping make
 Military exchanges	                          719,946	    764,583		 6.2%	                                  3.5%             no charge for food
                                                                                                                            served either in cash
 TOTAL — GROUP III	                        $2,346,149	 $2,486,732		 6.0%	                                  3.3%             or in kind.
                                                                                                                         14	Continental United
                                                                                                                            States only.
 GRAND TOTAL	                                              $610,412,409	    $631,816,600	 	    3.5%	       0.8%


4         National Restaurant Association         |   www.restaurant.org
2012 Restaurant Industry Forecast                                                                                                                  Sales Outlook

Major Markets: Projected Sales, 2012
The chart on pages 5–6 provides more detail on the National Restaurant Association’s projections for sales in markets outside the “eating-
and-drinking places” category in 2012, including foodservice sales at schools, worksites, health-care facilities, lodging places and the military.


Educational Sales
What this category includes: Food-and-drink sales by foodservice companies that manage restaurant services in colleges, universities, primary and secondary
schools, as well as food-and-drink sales by schools that operate their own restaurant services.

	                                                                                                 2011 Projected	               2012 Projected	                ‘11–’12 %	 ‘11–’12 % Real
  2012 projected food-and-drink sales                                $35.0 billion
	                                                                                                F&D Sales ($000)	             F&D Sales ($000)	                Change	 Growth Change

  Colleges and universities
  	 Managed services	                                                                                $13,889,332	                  $14,418,786	                    3.8%	              0.6%
  	Noncommercial	                                                                                      7,206,760	                    7,478,958	                    3.8%	              0.6%
  	Subtotal	                                                                                          21,096,092	                   21,897,744	                    3.8%	              0.6%
  Primary and secondary schools
  	 Managed services	                                                                                  6,041,190	                   6,294,920	                     4.2%	              1.4%
  	Noncommercial	                                                                                      6,617,656	                   6,844,963	                     3.4%	              0.6%
  	Subtotal	                                                                                          12,658,846	                  13,139,883	                     3.8%	              1.0%
  TOTAL EDUCATIONAL	                                                                                 $33,754,938	                 $35,037,627	                     3.8%	              0.8%


Employee Sales
What this category includes: Food-and-drink sales by for-profit companies that manage restaurant services for employees at manufacturing and industrial plants
and in commercial office buildings, as well as food-and-drink sales by plants and companies that run their own noncommercial employee restaurant services.

	                                                                                                 2011 Projected	               2012 Projected	                ‘11–’12 %	 ‘11–’12 % Real
  2012 projected food-and-drink sales                                $10.5 billion
	                                                                                                F&D Sales ($000)	             F&D Sales ($000)	                Change	 Growth Change

  Managed services
  	 Manufacturing and industrial plants	                                                              $7,007,302	                  $7,340,408	                     4.8%	              2.1%
  	 Commercial and office buildings	                                                                   2,611,070	                   2,684,180	                     2.8%	              0.1%
  Noncommercial employee restaurant services*	                                                           424,157	                     440,942	                     4.0%	              0.9%
  TOTAL EMPLOYEE	                                                                                    $10,042,529	                 $10,465,530	                     4.2%	              1.5%
 *Includes sales for industrial plants and office buildings, seagoing ships, and inland-waterway vessels


Health-Care Sales
What this category includes: Food-and-drink sales by foodservice companies that manage restaurant services in hospitals and nursing homes, as well as
food-and-drink sales by hospitals and nursing homes that operate their own restaurant services.

	                                                                                                 2011 Projected	               2012 Projected	                ‘11–’12 %	 ‘11–’12 % Real
  2012 projected food-and-drink sales                                $30.0 billion
	                                                                                                F&D Sales ($000)	             F&D Sales ($000)	                Change	 Growth Change

  Managed services in hospitals and nursing homes	                                                    $5,170,569	  $5,460,121	 5.6%	 2.7%
  Hospitals*	                                                                                         15,755,054	 16,375,645	 3.9%	1.2%
  Nursing homes**	                                                                                     7,908,212	   8,192,908	 3.6%	 0.8%
  TOTAL HEALTH CARE	                                                                                 $28,833,835	 $30,028,674	 4.1%	 1.4%
 *Includes voluntary and proprietary hospitals; long-term general, TB, mental hospitals; and sales or commercial equivalent to employees in state and local short-term hospitals and federal hospitals.
 **Includes homes for the aged, blind, orphans, mentally and physically disabled; sales (commercial equivalent) calculated for nursing homes and homes for the aged only. All others in this
 group make no charge — either in cash or in kind for food served.


Lodging-Place Sales
What this category includes: Food-and-drink sales at hotel restaurants and other accommodation restaurants.

	                                                                                                 2011 Projected	               2012 Projected	                ‘11–’12 %	 ‘11–’12 % Real
  2012 projected food-and-drink sales                                $31.4 billion
	                                                                                                F&D Sales ($000)	             F&D Sales ($000)	                Change	 Growth Change

  Hotel restaurants	                                                                                 $29,602,800	                 $30,994,132	                     4.7%	              2.0%
  Other accommodation restaurants	                                                                       397,166	                     419,805	                     5.7%	              3.0%
  TOTAL LODGING PLACES	                                                                              $29,999,966	                 $31,413,937	                     4.7%	              2.0%


                                                                                                      www.restaurant.org                 |   National Restaurant Association                         5
Sales Outlook                                                                                                                                    2012 Restaurant Industry Forecast


Major Markets Continued


Military Sales
What this category includes: Food-and-drink sales at military clubs and exchanges.

	                                                                                                 2011 Projected	               2012 Projected	               ‘11–’12 %	 ‘11–’12 % Real
  2012 projected food-and-drink sales                                $2.5 billion
	                                                                                                F&D Sales ($000)	             F&D Sales ($000)	               Change	 Growth Change

    Officers’ and NCO clubs (Open mess)	                                                               $1,626,203	                  $1,722,149	                   5.9%	               3.2%
    Military exchanges	                                                                                   719,946	                     764,583	                   6.2%	               3.5%
    TOTAL MILITARY*	                                                                                   $2,346,149	                  $2,486,732	                   6.0%	               3.3%
 *Continental United States only.


Recreational Sales
What this category includes: Food-and-drink sales at recreation and sports centers, such as movie theaters, sports arenas and bowling lanes.

	                                                                                                 2011 Projected	               2012 Projected	               ‘11–’12 %	 ‘11–’12 % Real
  2012 projected food-and-drink sales                                $29.1 billion
	                                                                                                F&D Sales ($000)	             F&D Sales ($000)	               Change	 Growth Change

    Recreation and sports centers
    	 Managed services	                                                                               $5,611,996	                  $5,875,760	                    4.7%	              2.0%
    	Noncontractors*	                                                                                 12,922,544	                  13,496,710	                    4.4%	              1.7%
    	Subtotal	                                                                                        18,534,540	                  19,372,470	                    4.5%	              1.8%
    Clubs, sporting and recreational camps**	                                                          9,404,611	                   9,711,534	                    3.3%	              0.6%
    TOTAL RECREATIONAL	                                                                              $27,939,151	                 $29,084,004	                    4.1%	              1.4%
 *Includes sales at movies, bowling lanes, and recreation and sports centers.
 **A portion of food-and-beverage sales in clubs is business-related.


Transportation Sales
What this category includes: Food-and-drink sales on airlines, passenger/cargo liners and railroads.

	                                                                                                 2011 Projected	               2012 Projected	               ‘11–’12 %	 ‘11–’12 % Real
  2012 projected food-and-drink sales                                $4.5 billion
	                                                                                                F&D Sales ($000)	             F&D Sales ($000)	               Change	 Growth Change

    Managed services, in-transit commercial airlines	                                                  $2,263,753	                  $2,342,985	                   3.5%	               0.8%
    Noncommercial transportation	                                                                       2,069,914	                   2,175,955	                   5.1%	               2.3%
    TOTAL TRANSPORTATION	                                                                              $4,333,667	                  $4,518,940	                   4.3%	               1.5%


Other Sales
	                                                                                                 2011 Projected	               2012 Projected	               ‘11–’12 %	 ‘11–’12 % Real
  2012 projected food-and-drink sales                                $50.7 billion
	                                                                                                F&D Sales ($000)	             F&D Sales ($000)	               Change	 Growth Change

    Retail hosts*	                                                                                   $33,152,723	                 $35,111,790	                    5.9%	               3.2%
    Mobile caterers	                                                                                     628,422	                     653,685	                    4.0%	               1.3%
    Vending and non-store retailers**	                                                                11,537,834	                  11,883,970	                    3.0%	               0.7%
    Community centers	                                                                                 2,901,663	                   3,006,123	                    3.6%	               0.8%
 *Includes drug- and proprietary-store, general-merchandise store, variety-store, food-store and grocery-store restaurants (including a portion of delis and all salad bars); gasoline/service-station
 restaurants; and miscellaneous retailers.
 **Includes sales of hot food, sandwiches, pastries, coffee and other hot beverages.


6           National Restaurant Association                 |   www.restaurant.org
2012 Restaurant Industry Forecast                                                                                                                            Sales Outlook

Restaurant-Industry Sales Over Five Years: 2008-2012
	                                                                   2008	2009	   ‘08–’09	2010	‘09–’10	2011	‘10–’11	2012	 ‘11–’12
	                                                                   Sales	 Sales	Change	Sales	Change	Sales	Change	 Sales	Change

COMMERCIAL RESTAURANT SERVICES	             $523,459,092	 $519,554,791	                                  –0.7%	 $535,106,004	 3.0%	 $555,778,233	 3.9%	 $575,102,840	                                   3.5%
  Eating Places	                             388,478,808	 384,111,349	                                   –1.1%	 393,028,164	 2.3%	 406,582,145	 3.4%	 419,215,419	                                      3.1%
     Fullservice restaurants	                191,470,223	 186,109,057	                                   –2.8%	 189,459,020	 1.8%	 195,711,168	 3.3%	 201,386,792	                                      2.9%
     Limited-service restaurants	            157,591,999	 159,010,327	                                    0.9%	 162,985,585	 2.5%	 168,527,095	 3.4%	 173,751,435	                                      3.1%
     Cafeterias, grill-buffets and buffets	    7,691,686	    7,768,603	                                   1.0%	    8,017,198	 3.2%	    8,249,697	 2.9%	    8,472,439	                                   2.7%
     Snack and nonalcoholic beverage bars	 24,652,412	 24,504,498	                                       –0.6%	   25,484,678	 4.0%	   26,580,519	 4.3%	   27,670,321	                                   4.1%
     Social caterers	                          7,072,488	    6,718,864	                                  –5.0%	    7,081,683	 5.4%	    7,513,666	 6.1%	    7,934,432	                                   5.6%
  Bars and taverns	                           17,117,259	 17,305,549	                                     1.1%	   17,790,104	 2.8%	   18,359,387	 3.2%	   18,910,169	                                   3.0%
  TOTAL EATING-AND-DRINKING PLACES	 $405,596,067	 $401,416,898	                                          –1.0%	 $410,818,268	 2.3%	 $424,941,532	 3.4%	 $438,125,588	                                   3.1%
NONCOMMERCIAL RESTAURANT SERVICES	 $47,509,488	 $47,881,491	                                              0.8%	 $49,823,416	 4.1%	 $52,288,027	 4.9%	 $54,227,028	                                      3.7%
MILITARY RESTAURANT SERVICES	                 $2,046,800	 $2,149,353	                                     5.0%	   $2,235,735	 4.0%	   $2,346,149	 4.9%	   $2,486,732	                                   6.0%
TOTAL INDUSTRY SALES	                       $573,015,380	 $569,585,635	                                  –0.6%	 $587,165,155	 3.1%	 $610,412,409	 4.0%	 $631,816,600	                                   3.5%
Source: National Restaurant Association


Restaurant Sales by U.S. Census Region
Growth in the restaurant industry typically varies significantly by region of the country, and is most heavily influenced by gains in employment,
disposable income and population. (Note: The appendix on page 50 offers details on restaurant-sales growth in each state.)


    Regional
    Snapshots


                                           East North Central                         East South Central                         Middle Atlantic                             Mountain
    Restaurant sales1                      2012 projected growth:                     2012 projected growth:                     2012 projected growth:                      2012 projected growth:
     and economic2                         	              Regional	National           	              Regional	National           	              Regional	National            	              Regional	National
    growth projected                       •	 Jobs	         0.6%	       1.3%          •	 Jobs	         1.3%	       1.3%          •	 Jobs	         1.0%	        1.3%          •	 Jobs	         1.5%	     1.3%
     for 2012 in the                       •	 Income	       0.9%	       2.0%          •	 Income	       1.7%	       2.0%          •	 Income	       1.6%	        2.0%          •	 Income	       2.5%	     2.0%
    nine U.S. Census                       •	 Population	 0.3%	         1.0%          •	 Population	 0.8%	         1.0%          •	 Population	 0.3%	          1.0%          •	 Population	 1.9%	       1.0%
         regions                           	Restaurant                                	Restaurant                                	Restaurant                                 	Restaurant
                                           	Sales	          2.9%	       3.2%          	Sales	          3.0%	       3.2%          	Sales	          3.3%	        3.2%          	Sales	          3.4%	     3.2%


New England                                Pacific                                    South Atlantic                             West North Central                          West South Central
2012 projected growth:                     2012 projected growth:                     2012 projected growth:                     2012 projected growth:                      2012 projected growth:
	             Regional	National            	              Regional	National           	              Regional	National           	              Regional	National            	              Regional	National
•	 Jobs	        0.7%	        1.3%          •	 Jobs	         1.1%	       1.3%          •	 Jobs	         1.1%	       1.3%          •	 Jobs	         1.1%	        1.3%          •	 Jobs	         2.1%	     1.3%
•	 Income	      1.4%	        2.0%          •	 Income	       1.7%	       2.0%          •	 Income	       2.2%	       2.0%          •	 Income	       2.2%	        2.0%          •	 Income	       2.4%	     2.0%
•	 Population	 0.2%	         1.0%          •	 Population	 1.2%	         1.0%          •	 Population	 1.3%	         1.0%          •	 Population	 0.7%	          1.0%          •	 Population	 1.4%	       1.0%

	Restaurant                                	Restaurant                                	Restaurant                                	Restaurant                                 	Restaurant
	Sales	         2.5%	        3.2%          	Sales	          3.0%	       3.2%          	Sales	          3.5%	       3.2%          	Sales	          2.8%	        3.2%          	Sales	          3.9%	     3.2%

1 Regional restaurant-sales-growth figures are based on current dollars and not adjusted for menu price inflation. For definition of restaurant sales included in this grouping see page 50 footnote.
2 Economic indicators show growth in region’s total employment, real disposable personal income and total population.


                                                                                                             www.restaurant.org                   |   National Restaurant Association                          7
Sales Outlook                                                                                                                                     2012 Restaurant Industry Forecast


Restaurant Sales Growth in 2012 (projected)
        See state information appendix on page 50 for full sales projections for all states.


                       WA
                     3.3%                                                                                                                                                         NH
                                                                                                                                                                                2.7%        ME
                                                                                                                                                                           VT
                                                        MT
                                                                                    ND                                                                                  2.2%             2.7%
                                                      3.2%                        4.1%
                OR
              3.1%                                                                                                                                                                                 MA
                                     ID                                                                                                                                                          2.4%
                                                                                                        MN              WI                                                   NY
                                  3.2%                                               SD
                                                                                                       3.1%            2.8%                                                3.4%                     RI
                                                           WY                     3.0%
                                                                                                                                             MI                                                    2.3%
                                                         3.7%                                                                            2.7%                                                 CT
                        NV                                                                                   IA                                                       PA                 2.9%
                     3.4%                                                              NE                 2.3%                                                     3.2%
                                                                                    3.0%                                                           OH                                              NJ
                                           UT                                                                                IL         IN                                              DE     3.3%
                                                                                                                                                  3.0%                                 3.1%
         CA                               3.6%                   CO                                                       3.2% 2.6%                       WV
       3.0%                                                     3.5%                        KS                                                           2.2% VA                       MD
                                                                                        2.7%                      MO                          KY             3.3%                      3.7%
                                                                                                              2.5%                           3.3%                                        DC
                                                                                                                                                                      NC               3.3%
                                                                                                                                         TN                          3.3%
                                      AZ                                                         OK
                                                           NM                                                                         2.8%
                                    3.3%                                                    3.4%                  AR
                                                                                                                                                                SC
                                                         3.3%                                                 3.1%                                           3.6%
                                                                                                                            MS
                                                                                                                          2.8%          AL            GA
                                                                                                                                      3.2%          3.1%
                                                                                       TX
                                                                                    4.1%                          LA
                                                                                                               3.3%
                             AK
                           3.5%                                                                                                                                  FL
                                                                                                                                                              3.9%
                                                                                                                              	 3.5% or higher

                                                                                                                              	 3.2% to 3.4%
                                                                HI
                                                            2.9%                                                              	 2.8% to 3.1%

                                                                                                                              	 2.7% or less
*State restaurant-sales figures are in current dollars and not adjusted for menu price inflation. For definition of restaurant sales included in this grouping see page 50 footnote.
National sales for this group are projected to increase at a 3.2 percent rate in 2012.
Source: National Restaurant Association


                               2012 Restaurant                                                        2012 Restaurant
    Top 12 States                                                      Top 12 States
                               Sales Growth                                                           Sales Volume
Projected increase in restaurant sales                                Projected restaurant sales volume
in 2012                                                               in 2012 ($000)
North Dakota	   4.1%                                                  	1	 California	$63,837,084
Texas	4.1%                                                            	2	Texas	           $38,421,874
Florida	3.9%                                                          	3	 New York	       $31,927,145
Wyoming	3.7%                                                          	4	Florida	         $31,463,913
Maryland	3.7%                                                         	5	Illinois	        $20,677,633
South Carolina	 3.6%                                                  	6	Pennsylvania	    $17,084,489
Utah		          3.6%                                                  	7	Ohio	            $16,619,422
Alaska	3.5%                                                           	8	Georgia	         $15,224,418
Colorado	3.5%                                                         	9	 North Carolina	 $14,685,881
New York	       3.4%                                                  	10	 New Jersey	    $13,567,704
Oklahoma	3.4%                                                         	11	Virginia	       $13,263,834
Nevada	3.4%                                                           	12	Massachusetts	  $12,632,894


8            National Restaurant Association                |    www.restaurant.org
Hunkered-down
       u s Optimistic
	 utio
Ca


                          FEATURED 2012 CONSUMER RESEARCH SECTION


        Decoding
        Consumers
            in a
                        Challenging
                         Economy
        W
                     ith the official end of the Great Recession now more than two years in the
                     past, most households expected things would be getting better. Sluggish job
                     growth, persistent high unemployment, stagnant incomes and falling home
        prices were supposed to be in the rear view mirror by now. The good times should have
        returned, giving consumer sentiment a much-needed boost.

            Unfortunately, the reality is quite      economy as either “fair” or “poor.” When
        different from those expectations, accord-   asked the same question in December 2010,
        ing to new National Restaurant Association   an identical 92 percent of adults gave the
        research. In fact, from the perspective of   same assessment of the economy.
        many consumers, the economy didn’t              It can even be argued that consumers’
        improve at all in 2011. According to the     view of the economy worsened over the
        Association’s National Household Survey      last year, as 65 percent gave the economy a
        fielded in December 2011, 92 percent of      “poor” rating in December 2011, an
        adults described the current state of the    increase from 58 percent just a year ago.

                                                                                  Continued …


                                                      www.restaurant.org      |   National Restaurant Association   9
Decoding Consumers                                                                                                                  2012 Restaurant Industry Forecast


   Although the general assessment of           Consumers Still Not Confident in the Economy
the national economy remains negative,          Consumers’ assessment of the economy, December 2011 versus December 2010
consumers are somewhat more positive
                                                December 2011
about their personal financial situation.
                                                                                              65%                                                            27%                7%    1%
Forty-three percent of adults described
their personal finances as “excellent”          December 2010
                                                                                      58%                                                              34%                      8%
(10 percent) or “good” (33 percent),
while 56 percent gave a rating of “fair”
(38 percent) or “poor” (18 percent).            Consumers More Optimistic About Their
   This is generally on par with consumers’     Own Piggy Banks
sentiment a year ago, when four out of 10       Consumers’ assessment of their personal finances, December 2011 versus December 2010
assessed their personal financial situation
as “excellent” or “good,” and six out of 10
                                                December 2011
                                                          18%                                         38%                                          33%                         10%
said it was “fair” or “poor.”
                                                December 2010
Outlook Remains Mixed                                    18%                                           41%                                               34%                     7%

Consumers’ assessment of current                    Poor             Fair         Good                 Excellent
economic conditions is generally bleak,
                                                Source: National Restaurant Association, National Household Survey, 2010 and 2011
but their outlook for the year ahead


                                                                                                                                                         56%
remains mixed. In fact, when compared
to December 2010, consumers are actually        Same Old, Same Old
somewhat less optimistic about an               Outlook for 2011                                      Outlook for 2012
improving economic environment in the           (in December 2010)                                    (in December 2011)
year ahead.                                      Stay About
                                                                                                    Stay About Don’t Know
                                                                                                                                                           Percent of adults
                                                  the Same                  Get Better
    Three out of 10 adults (30 percent) said                                                         the Same
                                                                                                                       2%           Get Better
                                                                                                                                                         who described their
                                                   54%                        29%                     44%                                                 personal finances
they think the nation’s economy will get                                                                                                30%
                                                                                                                                                          as “fair” or “good”
better in 2012, while a solid majority
expect conditions to worsen (24 percent)
or stay the same (44 percent). This outlook
is similar to the view consumers held a year
ago, when 29 percent thought economic                                 Get Worse 17%                                           Get Worse 24%
conditions would improve in 2011 and            Source: National Restaurant Association, National Household Survey, 2010 and 2011
17 percent thought the economy would
get worse.
    On an individual level, consumers           Glass Half Full or Half Empty?
are somewhat more bullish about the             Consumers’ outlook for their household financial situation in 2012, by age group
prospects for their personal finances in the                                                                                                                             70%
                                                         58%                                                57%                                        61%
year ahead. Thirty-three percent of adults                                  48% 49%
                                                                                                                                  53%
expect their household financial situation         33%                                               34%                    34%
to be better in 2012 than it was in 2011.                                                                                                        25%
                                                                                                                                                             13%   13%         16%
                                                                9%                                                                      11%
Meanwhile, just 9 percent said they think                                                2%
                                                                                                                  8%

their financial situation will get worse in
                                                      All Adults               18 to 34                 35 to 44              45 to 54             55 to 64         65 or Older
2012.
    Younger adults are much more optimis-           Better Than 2011                     About the Same as 2011                     Worse Than 2011
tic about their personal economics in 2012.     Source: National Restaurant Association, National Household Survey, 2011
Forty-eight percent of adults between the
ages of 18 and 34 said their household
financial situation will improve in 2012;       Loss of Trust                                                               credit downgrade to Congress’s inability to
2 percent expect it to worsen. In contrast,     Contributing to the general malaise in the                                  reach a compromise on legislation, many
only 13 percent of adults age 65 and            country is the overall lack of confidence in                                consumers have lost trust in the pillars of
older expect their household financial          many of the entities and institutions that                                  American society.
situation to get better in 2012, while a        are expected to be working toward                                               Moreover, research shows that the
higher 16 percent predicted it will get         improving the common good. From the                                         situation is getting worse. In the Associa-
worse.                                          financial meltdown to the nation’s AAA                                      tion’s 2010 and 2011 National Household


10       National Restaurant Association   |   www.restaurant.org
2012 Restaurant Industry Forecast                                                                                        Decoding Consumers

Confidence in Nation’s Pillars Still Challenged Consumers’ Level of
The amount of confidence consumers have in the following institutions and entities Confidence in the
          Congress                                                                 National Economy:
                                   33%                                       36%                              24%               3%
                                                                                                                                        December 2010
                Federal Government                                                                                                              Very Little
                                                                                                                                                                        None at All

                            24%                                31%                                   32%                   8%                                             15%         A Great Deal
                                                                                                                                                  26%
                                                                                                                                                                                          5%
                National News Media                                                                                                                                                        Quite a Bit
                             25%                               30%                                 31%                   6%        6%
                                                                                                                                                                                              9%
                Financial Industry                                                                                                            Some
                          20%                            31%                                         37%                      5%   4%         45%
                Large Corporations
                          20%                          29%                                     36%                       9%        5%   December 2011
                                                                                                                                                                          None at All
                                                                                                                                                 Very Little
                Businesses in Community                                                                                                                                      18%
                 4%      10%                            42%                                      27%                      16%
                                                                                                                                                     33%                                A Great Deal
                                                                                                                                                                                            4%
    None at All             Very Little            Some              Quite a Bit            A Great Deal                                                                                   Quite a Bit

Source: National Restaurant Association, National Household Survey, 2011
                                                                                                                                                                                               8%


69%
                                                                                                                                                                                        Some 36%
                                  Percent of adults who said they had little or no confidence                                           Source: National Restaurant Association, National Household
                                  in Congress, up from 60 percent in December 2010.                                                     Survey, 2010 and 2011


Surveys, consumers were asked how much                               “very little” or “none at all.” In December                        most, while just 10 percent picked Congress
confidence they had in various American                              2010, 14 percent of adults said they had “a                        as the biggest economic problem solver.
institutions and entities. Without fail, their                       great deal” or “quite a bit” of confidence in
responses showed that confidence in most                             the national economy, while 41 percent said                        A Head’s Up on Consumer
of the main institutions and entities is                             they had “very little” or “none at all.”                           Thinking
eroding across the board.                                                                                                               Even during good economic times, one size
    In December 2011, 69 percent of adults                                                                                              does not fit all for consumers. Restaurant
said they had little or no confidence in                             Local Business                                                     operators are well aware that they have
Congress, up from 60 percent in December                             Leading the Way                                                    to tailor their food, service and marketing
2010. Similarly, 55 percent of adults said                           Consumers’ view of who is doing the most to                        to the kind of consumer they want to
they had little or no confidence in the                              help get the economy back on track                                 reach. In today’s challenging economic
federal government or national news                                                   Don’t Know 13%                  Businesses        environment, it is even more important for
media, up from less than half of adults in                                 Congress                                    in Their         operators to know their customers and
                                                                                                                      Community
2010. Roughly one-half of adults said they                                  10%                                                         how to appeal to them.
                                                                                                                         63%
had little or no confidence in large corpora-                           Large                                                              The Association’s 2012 Forecast takes a
tions or the financial industry, which also                          Corporations                                                       detailed look at the mindset, motivations
represented an increase from a year ago.                                14%                                                             and spending patterns of today’s consumers
    There is one exception to consumers’                                                                                                to help restaurant operators create a
                                                                     Source: National Restaurant Association, National Household
declining confidence — they still have faith                                                                                            forward-thinking business plan that will
                                                                     Survey, 2011
in their communities’ businesses. Forty-                                                                                                enable them to effectively compete for
three percent of adults said they have “a                                                                                               consumers’ limited dollars.
great deal” or “quite a bit” of confidence in                        Searching for Problem Solvers                                         Based on the Association’s 2011
businesses in their community, matching the                          With all the challenges facing the country,                        National Household Survey, consumers are
proportion that reported similarly in 2010.                          where are consumers looking for solutions?                         divided into the following three segments
    Taken as a whole, the result is a shortage                       They are turning to their local businesses.                        based on their financial situation, current
in confidence in the overall economy — a                             Nearly two-thirds of adults (63 percent) said                      spending behavior and economic outlook:
trend that is worsening. Only 12 percent of                          they think businesses in their community                              • Optimistic Consumers: 21 percent of
adults said they had “a great deal” or                               are doing the most to get the economy                              adults said they are confident in their
“quite a bit” of confidence in the national                          moving again. Fourteen percent said they                           financial situation and have not cut back
economy, while 51 percent said they had                              think large corporations are doing the                             on spending.


                                                                                                           www.restaurant.org             |   National Restaurant Association                         11
Decoding Consumers                                                                                                                             2012 Restaurant Industry Forecast


   • Cautious Consumers: 42 percent of                              A Closer Look at                                                      Not surprisingly, Optimistic Consumers
adults said they are taking a wait-and-see                          Today’s Consumers                                                 have the highest average household
approach and have cut back somewhat on                                                                                                income out of the three groups. Sixty-three
                                                                     Optimistic           Cautious             Hunkered-down
spending until the economy improves.                                 Consumers           Consumers               Consumers            percent of Optimistic Consumers have an
   • Hunkered-Down Consumers: 37                                                                                                      annual household income of $50,000 or
                                                                           21%              42%                      37%
percent of adults said they are very                                                                                                  more, and the average income for the
concerned about the economy and have                                Source: National Restaurant Association, National Household       group is $72,600. Cautious Consumers have
                                                                    Survey, 2011
cut back significantly on spending.                                                                                                   an average household income of $63,800,
                                                                                                                                      while Hunkered-Down Consumers have an
The Inside Scoop on Today’s                                         Optimistic Consumers are age 65 or                                average income of $49,800.
Consumer                                                            older, higher than the other two groups.                              On the national level, Cautious
The demographic profiles of the three                               Conversely, 43 percent of Hunkered-Down                           Consumers are the largest category, with
consumer groups are quite diverse. Nearly                           Consumers are between the ages of 45 and                          42 percent of adults identifying themselves
two-thirds of Optimistic Consumers (63                              64, compared with 33 percent of Cautious                          with this group. The same holds true
percent) are men, while 57 percent of                               Consumers and 25 percent of Optimistic                            regionally—the Cautious group represents
Hunkered-Down Consumers are women.                                  Consumers.                                                        the largest number of consumers in each
The Cautious group is almost evenly split                               A majority of individuals in each of the                      of the four U.S. regions.
between men and women.                                              three consumer groups are employed, led by                            The Midwest region is home to the
   Optimistic Consumers have the highest                            56 percent of Cautious Consumers. Seven-                          highest proportion of Optimistic Consumers
representation of younger and older                                 teen percent of Hunkered-Down Consumers                           (27 percent), well above this group’s share
adults. Fifty-three percent of Optimistic                           are currently not employed, compared with                         in the South (20 percent), West (20
Consumers are between the ages of 18 and                            8 percent of individuals in the Optimistic and                    percent) and Northeast (18 percent). The
44, compared with 48 percent of Cautious                            Cautious groups. Optimistic Consumers are                         West (39 percent) and South (38 percent)
Consumers and 40 percent of Hunkered-                               slightly more likely to be retired than those                     regions have the highest proportion of
Down Consumers. Twenty-one percent of                               in the other two groups.                                          Hunkered-Down Consumers.


Consumer
Consumption

 Consumers who describe themselves as …                                                  OPTIMISTIC                               CAUTIOUS                  HUNKERED-DOWN

 Percent of all consumers	                                                                      21%	                                  42%	                             37%

 DEMOGRAPHIC CHARACTERISTICS

 Gender	Male...................... 63%	Male...................... 49%	Male......................43%
 	Female.................. 37%	Female................... 51%	Female...................57%

 Age	                                                                              18 to 44................. 53%	          18 to 44................. 48%	   18 to 44.................40%
 	                                                                                 45 to 64................. 25%	          45 to 64 ................ 33%	   45 to 64.................43%
 	                                                                                 65 and Older........ 21%	               65 and Older......... 16%	       65 and Older.........15%

 Employment status	 Employed.............. 53%	Employed.............. 56%	Employed..............51%
 	                  Not Employed........ 8%	   Not Employed......... 8%	  Not Employed.......17%
 	Retired.................. 24%	Retired.................. 20%	Retired...................21%

 Household income	                                                                 Less Than $50k..... 29%	                Less Than $50k...... 39%	        Less Than $50k......56%
 	                                                                                 $50k or More........ 63%	               $50k or More........ 53%	        $50k or More........37%
 	                                                                                 Avg. Income.....$72,600	                Avg. Income.....$63,800	         Avg. Income.... $49,800
Source: National Restaurant Association, National Household Survey, 2011


12           National Restaurant Association                 |   www.restaurant.org
2012 Restaurant Industry Forecast                                                                                       Decoding Consumers

An Economic Profile of                                              Mapping Consumers’ Mindset
Today’s Consumer                                                    Regional breakdown of the three consumer categories                                        Optimistic............. 18%
All three consumer groups share the same                                                                                                                       Cautious................ 45%
cloudy current assessment of the nation’s                                                                              Optimistic............. 27%             Hunkered-Down... 37%
economy, but Optimistic Consumers and                                                                                  Cautious................ 40%
                                                                                                                       Hunkered-Down... 33%
Cautious Consumers have a more optimis-
tic outlook for 2012. Forty-four percent of
Optimistic Consumers and 32 percent of
                                                                           Optimistic............. 20%
Cautious Consumers expect the economy
                                                                           Cautious................ 41%
to get better in 2012, while less than one                                 Hunkered-Down... 39%
out of five think the economy will get
worse. Among Hunkered-Down Consumers,
only 20 percent expect the economy to get
                                                                                                                                                               Optimistic............. 20%
better in 2012, while 36 percent expect
                                                                                                                                                               Cautious................ 42%
economic conditions to worsen.                                                                                                                                 Hunkered-Down... 38%
    Optimistic Consumers also are much
more upbeat and optimistic than the other
two groups about their personal financial                           Source: National Restaurant Association, National Household Survey, 2011
situation. Seventy-three percent of Optimis-
tic Consumers describe their current
personal finances as “excellent” or “good,”                         financial situation will improve in 2012.                           Seventy-two percent of Optimistic Consum-
compared with 48 percent of Cautious                                   The most striking economic difference                            ers said their current spending levels on
Consumers and just 20 percent of Hunkered-                          between the three consumer categories is                            things like restaurants, entertainment,
Down Consumers. All three groups are                                their discretionary spending levels com-                            clothing and travel are about the same as
generally optimistic that their personal                            pared with before the recession began.                              they were before the recession began. Only


Who’s Seeing Green:
An Economic Profile of Today’s Consumers


 Consumers who describe themselves as …                                                  OPTIMISTIC                                CAUTIOUS                  HUNKERED-DOWN

 Percent of all consumers	                                                                      21%	                                    42%	                            37%

 ECONOMIC CHARACTERISTICS

 Current state of the nation’s economy	 Excellent/Good..... 13%	Excellent/Good....... 8%	Excellent/Good........4%
 	Fair/Poor............... 87%	Fair/Poor................ 92%	Fair/Poor................96%

 Outlook for economy in 2012	                                                      Get Better............. 44%	            Get Better............. 32%	      Get Better.............20%
 	                                                                                 Get Worse............. 19%	             Get Worse............. 18%	       Get Worse.............36%

 Current state of personal finances	 Excellent/Good..... 73%	Excellent/Good..... 48%	Excellent/Good......20%
 	Fair/Poor............... 26%	Fair/Poor................ 52%	Fair/Poor................80%

 Outlook for personal financial situation in 2012	                                 Get Better............. 41%	            Get Better............. 30%	      Get Better.............31%
 	                                                                                 Get Worse............... 1%	            Get Worse............... 5%	      Get Worse.............17%

 Current spending levels on things like restaurants,	                              Higher................... 12%	Higher..................... 8%	Higher...................11%
 entertainment, clothing and travel compared	                                      Lower.................... 16%	Lower.................... 51%	Lower....................67%
 with before the recession	                                                        About the Same.... 72%	       About the Same.... 40%	        About the Same....20%
Source: National Restaurant Association, National Household Survey, 2011


                                                                                                       www.restaurant.org                 |    National Restaurant Association           13
Decoding Consumers                                                                                                          2012 Restaurant Industry Forecast


16 percent of Optimistic Consumers said                             spending, Cautious Consumers still have             This is reflected in the sizable propor-
their current spending levels are lower than                        restaurant patronage levels above the           tion of consumers who said they would
they were before the recession began.                               overall average. In a typical month,            like to patronize the restaurant industry
   In contrast, 51 percent of Cautious                              Cautious Consumers average 7.8 quickser-        more frequently — particularly in the
Consumers and 67 percent of Hunkered-                               vice occasions, 5.0 fullservice occasions and   Hunkered-Down group. Fifty-six percent of
Down Consumers said their current                                   4.6 off-premises dinner occasions.              Hunkered-Down Consumers said they are
spending levels on those discretionary                                 Although their spending levels are           not eating on premises at restaurants and
items are lower than they were before the                           reduced in the current economic environ-        fast-food places as often as they would
recession began.                                                    ment, Hunkered-Down Consumers haven’t           like, while 54 percent reported similarly
                                                                    completely dropped off the restaurant radar.    about ordering takeout or delivery.
Consumers Still Hungry to                                           Hunkered-Down Consumers average 4.3                 This pent-up demand for restaurant
Dine Out                                                            quickservice occasions, 2.8 fullservice         services also extends to the better-positioned
The good news for restaurant operators is                           occasions and 2.8 off-premises dinner           groups, with more than one-third of Cautious
that Optimistic Consumers are above-aver-                           occasions in a typical month, somewhat          Consumers and roughly three out of 10
age restaurant customers across the three                           below the national average in each category.    Optimistic Consumers saying they are not
major spending categories tracked in the                               Regardless of the economic challenges        using on-premises or off-premises options as
2012 Forecast. In a typical month, Optimis-                         and their impact on restaurant behavior in      often as they would like. In addition, nearly
tic Consumers average 7.9 quickservice                              the current environment, the most positive      seven out of 10 Hunkered-Down Consumers
occasions, 6.2 fullservice occasions and 5.2                        news is that the vast majority of consumers     (68 percent) and 53 percent of Cautious
off-premises dinner occasions. In compari-                          across all categories have positive feelings    Consumers said they would eat out more
son, the overall adult population reported                          toward the restaurant industry. Ninety-         often if they were financially able.
averages of 6.0 quickservice occasions, 3.9                         seven percent of Optimistic Consumers,              These responses indicate that once the
fullservice occasions and 3.4 off-premises                          93 percent of Cautious Consumers and 89         economic environment improves, individuals in
dinner occasions in a typical month.                                percent of Hunkered-Down Consumers              these consumer groups will eagerly resume
    Despite their partial pullback on                               said they enjoy going to restaurants.           dining on premises, ordering in and taking out.


Most Consumers Still
Enjoy Going to Restaurants

 Consumers who describe themselves as …                                            OPTIMISTIC                   CAUTIOUS                HUNKERED-DOWN

 Percent of all consumers	                                                              21%	                        42%	                         37%

 RESTAURANT BEHAVIOR

 Average quickservice occasions per month	                                               7.9	                        7.8	                         4.3

 Average fullservice occasions per month	                                                6.2	                        5.0	                         2.8

 Average off-premises dinner occasions per month	                                        5.2	                        4.6	                         2.8

 Not eating on premises as often as they would like	                                    28%	                        35%	                         56%

 Not ordering takeout/delivery as often as they would like	                             29%	                        34%	                         54%

 Would eat out more often if they were financially able	                                38%	                        53%	                         68%

 Enjoy going to restaurants	                                                            97%	                        93%	                         89%
Source: National Restaurant Association, National Household Survey, 2011


14           National Restaurant Association                 |   www.restaurant.org
SECTION 1


2012
Economic
Outlook
With many consumers remaining on the sidelines and other options for
economic engines limited, the road ahead will be one of moderate
growth.
2012 Restaurant Industry Forecast

Mais conteúdo relacionado

Destaque

Sentrana ifma board_meeting_final
Sentrana ifma board_meeting_finalSentrana ifma board_meeting_final
Sentrana ifma board_meeting_finalifmaworld
 
Stirpot version
Stirpot version Stirpot version
Stirpot version huiyezheng
 
elliotts insights: UK Trends 2015 (Global Restaurant Investment Forum)
elliotts insights: UK Trends 2015 (Global Restaurant Investment Forum)elliotts insights: UK Trends 2015 (Global Restaurant Investment Forum)
elliotts insights: UK Trends 2015 (Global Restaurant Investment Forum)elliotts Agency
 
Restaurant Trends: Aaron Allen & Associates
Restaurant Trends:  Aaron Allen & AssociatesRestaurant Trends:  Aaron Allen & Associates
Restaurant Trends: Aaron Allen & AssociatesAaron Allen
 
David Rubenstein's SuperReturn Presentation
David Rubenstein's SuperReturn PresentationDavid Rubenstein's SuperReturn Presentation
David Rubenstein's SuperReturn Presentationdanprimack
 
Restaurant Monthly Update - January 2017
Restaurant Monthly Update - January 2017Restaurant Monthly Update - January 2017
Restaurant Monthly Update - January 2017Duff & Phelps
 
Chipotle Market Potential Analysis Part 1
Chipotle Market Potential Analysis Part 1Chipotle Market Potential Analysis Part 1
Chipotle Market Potential Analysis Part 1Mollye Peters
 
Restaurants Industry: Social Media Benchmarks & Impact Report
Restaurants Industry: Social Media Benchmarks & Impact ReportRestaurants Industry: Social Media Benchmarks & Impact Report
Restaurants Industry: Social Media Benchmarks & Impact ReportTrackMaven
 
Chapter 1 - The Foodservice Industry
Chapter 1 - The Foodservice IndustryChapter 1 - The Foodservice Industry
Chapter 1 - The Foodservice IndustryPavit Tansakul
 
Tracxn - FoodTech Startup Landscape
Tracxn - FoodTech Startup LandscapeTracxn - FoodTech Startup Landscape
Tracxn - FoodTech Startup LandscapeTracxn
 
Food service industry
Food service industryFood service industry
Food service industrykellimccabe
 
Zomato: Transforming the Global Restaurant Business
Zomato: Transforming the Global Restaurant BusinessZomato: Transforming the Global Restaurant Business
Zomato: Transforming the Global Restaurant BusinessJeffrey Funk Business Models
 
Gap analysis of Mc donalds with respect to fast food industry
 Gap analysis of Mc donalds with respect to fast food industry Gap analysis of Mc donalds with respect to fast food industry
Gap analysis of Mc donalds with respect to fast food industryShashi Kumar
 

Destaque (15)

Sentrana ifma board_meeting_final
Sentrana ifma board_meeting_finalSentrana ifma board_meeting_final
Sentrana ifma board_meeting_final
 
Stirpot version
Stirpot version Stirpot version
Stirpot version
 
elliotts insights: UK Trends 2015 (Global Restaurant Investment Forum)
elliotts insights: UK Trends 2015 (Global Restaurant Investment Forum)elliotts insights: UK Trends 2015 (Global Restaurant Investment Forum)
elliotts insights: UK Trends 2015 (Global Restaurant Investment Forum)
 
Restaurant Trends: Aaron Allen & Associates
Restaurant Trends:  Aaron Allen & AssociatesRestaurant Trends:  Aaron Allen & Associates
Restaurant Trends: Aaron Allen & Associates
 
David Rubenstein's SuperReturn Presentation
David Rubenstein's SuperReturn PresentationDavid Rubenstein's SuperReturn Presentation
David Rubenstein's SuperReturn Presentation
 
QSR Columbia 2015
QSR Columbia 2015QSR Columbia 2015
QSR Columbia 2015
 
Restaurant Monthly Update - January 2017
Restaurant Monthly Update - January 2017Restaurant Monthly Update - January 2017
Restaurant Monthly Update - January 2017
 
Chipotle Market Potential Analysis Part 1
Chipotle Market Potential Analysis Part 1Chipotle Market Potential Analysis Part 1
Chipotle Market Potential Analysis Part 1
 
Restaurants Industry: Social Media Benchmarks & Impact Report
Restaurants Industry: Social Media Benchmarks & Impact ReportRestaurants Industry: Social Media Benchmarks & Impact Report
Restaurants Industry: Social Media Benchmarks & Impact Report
 
Chapter 1 - The Foodservice Industry
Chapter 1 - The Foodservice IndustryChapter 1 - The Foodservice Industry
Chapter 1 - The Foodservice Industry
 
Tracxn - FoodTech Startup Landscape
Tracxn - FoodTech Startup LandscapeTracxn - FoodTech Startup Landscape
Tracxn - FoodTech Startup Landscape
 
Food service industry
Food service industryFood service industry
Food service industry
 
Chipotle
ChipotleChipotle
Chipotle
 
Zomato: Transforming the Global Restaurant Business
Zomato: Transforming the Global Restaurant BusinessZomato: Transforming the Global Restaurant Business
Zomato: Transforming the Global Restaurant Business
 
Gap analysis of Mc donalds with respect to fast food industry
 Gap analysis of Mc donalds with respect to fast food industry Gap analysis of Mc donalds with respect to fast food industry
Gap analysis of Mc donalds with respect to fast food industry
 

Semelhante a 2012 Restaurant Industry Forecast

Mega Trends 2010
Mega Trends 2010Mega Trends 2010
Mega Trends 2010mveracion
 
Essential Ingredients: Growing the Food and Beverage Cluster in the Milwaukee...
Essential Ingredients: Growing the Food and Beverage Cluster in the Milwaukee...Essential Ingredients: Growing the Food and Beverage Cluster in the Milwaukee...
Essential Ingredients: Growing the Food and Beverage Cluster in the Milwaukee...Goetschh
 
MacDonald SWOT Analysis.docx
MacDonald SWOT Analysis.docxMacDonald SWOT Analysis.docx
MacDonald SWOT Analysis.docxWaseelsultan
 
2014 Canadian Chain Restaurant Industry Review
2014  Canadian Chain Restaurant Industry Review2014  Canadian Chain Restaurant Industry Review
2014 Canadian Chain Restaurant Industry ReviewOrie Berlasso
 
Eight30 Luxury.pdf
Eight30 Luxury.pdfEight30 Luxury.pdf
Eight30 Luxury.pdfJanaGough
 
WikiFRESH Marketing Plan (FINAL)
WikiFRESH Marketing Plan (FINAL)WikiFRESH Marketing Plan (FINAL)
WikiFRESH Marketing Plan (FINAL)Jazzle Paraiso
 
Food and Beverages Business Plan
Food and Beverages Business PlanFood and Beverages Business Plan
Food and Beverages Business PlanInfocrest
 
Food and Beverage Sector Report
Food and Beverage Sector ReportFood and Beverage Sector Report
Food and Beverage Sector ReportVimarsh Bajpai
 
Catering Trends in U.S. Foodservice
Catering Trends in U.S. FoodserviceCatering Trends in U.S. Foodservice
Catering Trends in U.S. FoodserviceMarketResearch.com
 
2013 Canadian Chain Restaurant Industry Review (partial version)
2013  Canadian Chain Restaurant Industry Review (partial version)2013  Canadian Chain Restaurant Industry Review (partial version)
2013 Canadian Chain Restaurant Industry Review (partial version)Orie Berlasso
 
Tfp 2012 Food Trends
Tfp 2012 Food TrendsTfp 2012 Food Trends
Tfp 2012 Food TrendsWayne Edwards
 
Synergetics-IIF-Food-and-Beverage
Synergetics-IIF-Food-and-BeverageSynergetics-IIF-Food-and-Beverage
Synergetics-IIF-Food-and-BeverageNathan Louque
 
Hvs restaurant industry in india - trends opportunities
Hvs   restaurant industry in india - trends  opportunitiesHvs   restaurant industry in india - trends  opportunities
Hvs restaurant industry in india - trends opportunitiesVarun Talukdar
 
Hvs restaurant industry in india - trends opportunities
Hvs   restaurant industry in india - trends  opportunitiesHvs   restaurant industry in india - trends  opportunities
Hvs restaurant industry in india - trends opportunitiesadityan_k
 
Hvs restaurant industry in india - trends opportunities
Hvs   restaurant industry in india - trends  opportunitiesHvs   restaurant industry in india - trends  opportunities
Hvs restaurant industry in india - trends opportunitiesadityan1_k
 
Vegetable producer - problems and solutions
Vegetable producer - problems and solutionsVegetable producer - problems and solutions
Vegetable producer - problems and solutionsFAO
 
Food and beverage_services_global market report_2018_sample
Food and beverage_services_global market report_2018_sampleFood and beverage_services_global market report_2018_sample
Food and beverage_services_global market report_2018_sampleGUDURUSRIKANTH1
 

Semelhante a 2012 Restaurant Industry Forecast (20)

Mega Trends 2010
Mega Trends 2010Mega Trends 2010
Mega Trends 2010
 
Essential Ingredients: Growing the Food and Beverage Cluster in the Milwaukee...
Essential Ingredients: Growing the Food and Beverage Cluster in the Milwaukee...Essential Ingredients: Growing the Food and Beverage Cluster in the Milwaukee...
Essential Ingredients: Growing the Food and Beverage Cluster in the Milwaukee...
 
Sdmimd mm report (2)
Sdmimd mm report (2)Sdmimd mm report (2)
Sdmimd mm report (2)
 
MacDonald SWOT Analysis.docx
MacDonald SWOT Analysis.docxMacDonald SWOT Analysis.docx
MacDonald SWOT Analysis.docx
 
2014 Canadian Chain Restaurant Industry Review
2014  Canadian Chain Restaurant Industry Review2014  Canadian Chain Restaurant Industry Review
2014 Canadian Chain Restaurant Industry Review
 
08_chapter 1.pdf
08_chapter 1.pdf08_chapter 1.pdf
08_chapter 1.pdf
 
McDonald's Sustainability Recommendations
McDonald's Sustainability RecommendationsMcDonald's Sustainability Recommendations
McDonald's Sustainability Recommendations
 
Eight30 Luxury.pdf
Eight30 Luxury.pdfEight30 Luxury.pdf
Eight30 Luxury.pdf
 
WikiFRESH Marketing Plan (FINAL)
WikiFRESH Marketing Plan (FINAL)WikiFRESH Marketing Plan (FINAL)
WikiFRESH Marketing Plan (FINAL)
 
Food and Beverages Business Plan
Food and Beverages Business PlanFood and Beverages Business Plan
Food and Beverages Business Plan
 
Food and Beverage Sector Report
Food and Beverage Sector ReportFood and Beverage Sector Report
Food and Beverage Sector Report
 
Catering Trends in U.S. Foodservice
Catering Trends in U.S. FoodserviceCatering Trends in U.S. Foodservice
Catering Trends in U.S. Foodservice
 
2013 Canadian Chain Restaurant Industry Review (partial version)
2013  Canadian Chain Restaurant Industry Review (partial version)2013  Canadian Chain Restaurant Industry Review (partial version)
2013 Canadian Chain Restaurant Industry Review (partial version)
 
Tfp 2012 Food Trends
Tfp 2012 Food TrendsTfp 2012 Food Trends
Tfp 2012 Food Trends
 
Synergetics-IIF-Food-and-Beverage
Synergetics-IIF-Food-and-BeverageSynergetics-IIF-Food-and-Beverage
Synergetics-IIF-Food-and-Beverage
 
Hvs restaurant industry in india - trends opportunities
Hvs   restaurant industry in india - trends  opportunitiesHvs   restaurant industry in india - trends  opportunities
Hvs restaurant industry in india - trends opportunities
 
Hvs restaurant industry in india - trends opportunities
Hvs   restaurant industry in india - trends  opportunitiesHvs   restaurant industry in india - trends  opportunities
Hvs restaurant industry in india - trends opportunities
 
Hvs restaurant industry in india - trends opportunities
Hvs   restaurant industry in india - trends  opportunitiesHvs   restaurant industry in india - trends  opportunities
Hvs restaurant industry in india - trends opportunities
 
Vegetable producer - problems and solutions
Vegetable producer - problems and solutionsVegetable producer - problems and solutions
Vegetable producer - problems and solutions
 
Food and beverage_services_global market report_2018_sample
Food and beverage_services_global market report_2018_sampleFood and beverage_services_global market report_2018_sample
Food and beverage_services_global market report_2018_sample
 

Mais de Mark Moreno

Understanding the Different Kinds of Beef in the Marketplace
Understanding the Different Kinds of Beef in the MarketplaceUnderstanding the Different Kinds of Beef in the Marketplace
Understanding the Different Kinds of Beef in the MarketplaceMark Moreno
 
The Facts; Busting the Grass-fed Beef Myths
The Facts; Busting the Grass-fed Beef MythsThe Facts; Busting the Grass-fed Beef Myths
The Facts; Busting the Grass-fed Beef MythsMark Moreno
 
Memorandum Opinion Sysco US Foods Merger / Acquisition
Memorandum Opinion Sysco US Foods Merger / AcquisitionMemorandum Opinion Sysco US Foods Merger / Acquisition
Memorandum Opinion Sysco US Foods Merger / AcquisitionMark Moreno
 
Order Granting Preliminary Injunction Sysco US Foods
Order Granting Preliminary Injunction Sysco US FoodsOrder Granting Preliminary Injunction Sysco US Foods
Order Granting Preliminary Injunction Sysco US FoodsMark Moreno
 
Sysco - US Foods PROPOSED FINDINGS OF FACT AND CONCLUSIONS OF LAW
Sysco - US Foods PROPOSED FINDINGS OF FACT AND CONCLUSIONS OF LAWSysco - US Foods PROPOSED FINDINGS OF FACT AND CONCLUSIONS OF LAW
Sysco - US Foods PROPOSED FINDINGS OF FACT AND CONCLUSIONS OF LAWMark Moreno
 
Affordable Care Act - Next Steps for Restaurateurs
Affordable Care Act - Next Steps for RestaurateursAffordable Care Act - Next Steps for Restaurateurs
Affordable Care Act - Next Steps for RestaurateursMark Moreno
 
Out of Scope Whitepaper
Out of Scope WhitepaperOut of Scope Whitepaper
Out of Scope WhitepaperMark Moreno
 
FTC Complaint Sysco US Foods Acquisition
FTC Complaint Sysco US Foods AcquisitionFTC Complaint Sysco US Foods Acquisition
FTC Complaint Sysco US Foods AcquisitionMark Moreno
 
MEET THE REVOLUTIONARY VENDING MACHINE WITH TOUCHSCREEN TECHNOLOGY
MEET THE REVOLUTIONARY VENDING MACHINE WITH TOUCHSCREEN TECHNOLOGYMEET THE REVOLUTIONARY VENDING MACHINE WITH TOUCHSCREEN TECHNOLOGY
MEET THE REVOLUTIONARY VENDING MACHINE WITH TOUCHSCREEN TECHNOLOGYMark Moreno
 
Pos Purchasing Tools
Pos Purchasing ToolsPos Purchasing Tools
Pos Purchasing ToolsMark Moreno
 
Bermar America Put a Sparkle into Wine by the Glass Sales
Bermar America Put a Sparkle into Wine by the Glass SalesBermar America Put a Sparkle into Wine by the Glass Sales
Bermar America Put a Sparkle into Wine by the Glass SalesMark Moreno
 
Restaurant Trends 2014 by Restaurant Briefing
Restaurant Trends 2014 by Restaurant BriefingRestaurant Trends 2014 by Restaurant Briefing
Restaurant Trends 2014 by Restaurant BriefingMark Moreno
 
Food & Water Watch Comment on Proposed Sysco US Foods Merger
Food & Water Watch Comment on Proposed Sysco US Foods MergerFood & Water Watch Comment on Proposed Sysco US Foods Merger
Food & Water Watch Comment on Proposed Sysco US Foods MergerMark Moreno
 
Opt4 Mobile Flyer
Opt4 Mobile FlyerOpt4 Mobile Flyer
Opt4 Mobile FlyerMark Moreno
 
SYSCO AND US FOODS MERGER
SYSCO AND US FOODS MERGERSYSCO AND US FOODS MERGER
SYSCO AND US FOODS MERGERMark Moreno
 
What Makes a Great Cheap Knife?
What Makes a Great Cheap Knife?What Makes a Great Cheap Knife?
What Makes a Great Cheap Knife?Mark Moreno
 
Therma-Tek Range Corporation
Therma-Tek Range CorporationTherma-Tek Range Corporation
Therma-Tek Range CorporationMark Moreno
 
Mercer Cutlery Catalog
Mercer Cutlery CatalogMercer Cutlery Catalog
Mercer Cutlery CatalogMark Moreno
 
Know your knives
Know your knivesKnow your knives
Know your knivesMark Moreno
 

Mais de Mark Moreno (20)

Understanding the Different Kinds of Beef in the Marketplace
Understanding the Different Kinds of Beef in the MarketplaceUnderstanding the Different Kinds of Beef in the Marketplace
Understanding the Different Kinds of Beef in the Marketplace
 
The Facts; Busting the Grass-fed Beef Myths
The Facts; Busting the Grass-fed Beef MythsThe Facts; Busting the Grass-fed Beef Myths
The Facts; Busting the Grass-fed Beef Myths
 
Memorandum Opinion Sysco US Foods Merger / Acquisition
Memorandum Opinion Sysco US Foods Merger / AcquisitionMemorandum Opinion Sysco US Foods Merger / Acquisition
Memorandum Opinion Sysco US Foods Merger / Acquisition
 
Order Granting Preliminary Injunction Sysco US Foods
Order Granting Preliminary Injunction Sysco US FoodsOrder Granting Preliminary Injunction Sysco US Foods
Order Granting Preliminary Injunction Sysco US Foods
 
Sysco - US Foods PROPOSED FINDINGS OF FACT AND CONCLUSIONS OF LAW
Sysco - US Foods PROPOSED FINDINGS OF FACT AND CONCLUSIONS OF LAWSysco - US Foods PROPOSED FINDINGS OF FACT AND CONCLUSIONS OF LAW
Sysco - US Foods PROPOSED FINDINGS OF FACT AND CONCLUSIONS OF LAW
 
Affordable Care Act - Next Steps for Restaurateurs
Affordable Care Act - Next Steps for RestaurateursAffordable Care Act - Next Steps for Restaurateurs
Affordable Care Act - Next Steps for Restaurateurs
 
Out of Scope Whitepaper
Out of Scope WhitepaperOut of Scope Whitepaper
Out of Scope Whitepaper
 
FTC Complaint Sysco US Foods Acquisition
FTC Complaint Sysco US Foods AcquisitionFTC Complaint Sysco US Foods Acquisition
FTC Complaint Sysco US Foods Acquisition
 
MEET THE REVOLUTIONARY VENDING MACHINE WITH TOUCHSCREEN TECHNOLOGY
MEET THE REVOLUTIONARY VENDING MACHINE WITH TOUCHSCREEN TECHNOLOGYMEET THE REVOLUTIONARY VENDING MACHINE WITH TOUCHSCREEN TECHNOLOGY
MEET THE REVOLUTIONARY VENDING MACHINE WITH TOUCHSCREEN TECHNOLOGY
 
Pos Purchasing Tools
Pos Purchasing ToolsPos Purchasing Tools
Pos Purchasing Tools
 
Bermar America Put a Sparkle into Wine by the Glass Sales
Bermar America Put a Sparkle into Wine by the Glass SalesBermar America Put a Sparkle into Wine by the Glass Sales
Bermar America Put a Sparkle into Wine by the Glass Sales
 
EnerG² Concept
EnerG² ConceptEnerG² Concept
EnerG² Concept
 
Restaurant Trends 2014 by Restaurant Briefing
Restaurant Trends 2014 by Restaurant BriefingRestaurant Trends 2014 by Restaurant Briefing
Restaurant Trends 2014 by Restaurant Briefing
 
Food & Water Watch Comment on Proposed Sysco US Foods Merger
Food & Water Watch Comment on Proposed Sysco US Foods MergerFood & Water Watch Comment on Proposed Sysco US Foods Merger
Food & Water Watch Comment on Proposed Sysco US Foods Merger
 
Opt4 Mobile Flyer
Opt4 Mobile FlyerOpt4 Mobile Flyer
Opt4 Mobile Flyer
 
SYSCO AND US FOODS MERGER
SYSCO AND US FOODS MERGERSYSCO AND US FOODS MERGER
SYSCO AND US FOODS MERGER
 
What Makes a Great Cheap Knife?
What Makes a Great Cheap Knife?What Makes a Great Cheap Knife?
What Makes a Great Cheap Knife?
 
Therma-Tek Range Corporation
Therma-Tek Range CorporationTherma-Tek Range Corporation
Therma-Tek Range Corporation
 
Mercer Cutlery Catalog
Mercer Cutlery CatalogMercer Cutlery Catalog
Mercer Cutlery Catalog
 
Know your knives
Know your knivesKnow your knives
Know your knives
 

Último

Cyber Security Training in Office Environment
Cyber Security Training in Office EnvironmentCyber Security Training in Office Environment
Cyber Security Training in Office Environmentelijahj01012
 
Kenya Coconut Production Presentation by Dr. Lalith Perera
Kenya Coconut Production Presentation by Dr. Lalith PereraKenya Coconut Production Presentation by Dr. Lalith Perera
Kenya Coconut Production Presentation by Dr. Lalith Pereraictsugar
 
The-Ethical-issues-ghhhhhhhhjof-Byjus.pptx
The-Ethical-issues-ghhhhhhhhjof-Byjus.pptxThe-Ethical-issues-ghhhhhhhhjof-Byjus.pptx
The-Ethical-issues-ghhhhhhhhjof-Byjus.pptxmbikashkanyari
 
Marketplace and Quality Assurance Presentation - Vincent Chirchir
Marketplace and Quality Assurance Presentation - Vincent ChirchirMarketplace and Quality Assurance Presentation - Vincent Chirchir
Marketplace and Quality Assurance Presentation - Vincent Chirchirictsugar
 
8447779800, Low rate Call girls in Shivaji Enclave Delhi NCR
8447779800, Low rate Call girls in Shivaji Enclave Delhi NCR8447779800, Low rate Call girls in Shivaji Enclave Delhi NCR
8447779800, Low rate Call girls in Shivaji Enclave Delhi NCRashishs7044
 
PSCC - Capability Statement Presentation
PSCC - Capability Statement PresentationPSCC - Capability Statement Presentation
PSCC - Capability Statement PresentationAnamaria Contreras
 
Organizational Structure Running A Successful Business
Organizational Structure Running A Successful BusinessOrganizational Structure Running A Successful Business
Organizational Structure Running A Successful BusinessSeta Wicaksana
 
Flow Your Strategy at Flight Levels Day 2024
Flow Your Strategy at Flight Levels Day 2024Flow Your Strategy at Flight Levels Day 2024
Flow Your Strategy at Flight Levels Day 2024Kirill Klimov
 
Darshan Hiranandani [News About Next CEO].pdf
Darshan Hiranandani [News About Next CEO].pdfDarshan Hiranandani [News About Next CEO].pdf
Darshan Hiranandani [News About Next CEO].pdfShashank Mehta
 
8447779800, Low rate Call girls in Uttam Nagar Delhi NCR
8447779800, Low rate Call girls in Uttam Nagar Delhi NCR8447779800, Low rate Call girls in Uttam Nagar Delhi NCR
8447779800, Low rate Call girls in Uttam Nagar Delhi NCRashishs7044
 
Investment in The Coconut Industry by Nancy Cheruiyot
Investment in The Coconut Industry by Nancy CheruiyotInvestment in The Coconut Industry by Nancy Cheruiyot
Investment in The Coconut Industry by Nancy Cheruiyotictsugar
 
Market Sizes Sample Report - 2024 Edition
Market Sizes Sample Report - 2024 EditionMarket Sizes Sample Report - 2024 Edition
Market Sizes Sample Report - 2024 EditionMintel Group
 
Ten Organizational Design Models to align structure and operations to busines...
Ten Organizational Design Models to align structure and operations to busines...Ten Organizational Design Models to align structure and operations to busines...
Ten Organizational Design Models to align structure and operations to busines...Seta Wicaksana
 
Guide Complete Set of Residential Architectural Drawings PDF
Guide Complete Set of Residential Architectural Drawings PDFGuide Complete Set of Residential Architectural Drawings PDF
Guide Complete Set of Residential Architectural Drawings PDFChandresh Chudasama
 
Buy gmail accounts.pdf Buy Old Gmail Accounts
Buy gmail accounts.pdf Buy Old Gmail AccountsBuy gmail accounts.pdf Buy Old Gmail Accounts
Buy gmail accounts.pdf Buy Old Gmail AccountsBuy Verified Accounts
 
Unlocking the Future: Explore Web 3.0 Workshop to Start Earning Today!
Unlocking the Future: Explore Web 3.0 Workshop to Start Earning Today!Unlocking the Future: Explore Web 3.0 Workshop to Start Earning Today!
Unlocking the Future: Explore Web 3.0 Workshop to Start Earning Today!Doge Mining Website
 
8447779800, Low rate Call girls in New Ashok Nagar Delhi NCR
8447779800, Low rate Call girls in New Ashok Nagar Delhi NCR8447779800, Low rate Call girls in New Ashok Nagar Delhi NCR
8447779800, Low rate Call girls in New Ashok Nagar Delhi NCRashishs7044
 
Traction part 2 - EOS Model JAX Bridges.
Traction part 2 - EOS Model JAX Bridges.Traction part 2 - EOS Model JAX Bridges.
Traction part 2 - EOS Model JAX Bridges.Anamaria Contreras
 
Chapter 9 PPT 4th edition.pdf internal audit
Chapter 9 PPT 4th edition.pdf internal auditChapter 9 PPT 4th edition.pdf internal audit
Chapter 9 PPT 4th edition.pdf internal auditNhtLNguyn9
 

Último (20)

Cyber Security Training in Office Environment
Cyber Security Training in Office EnvironmentCyber Security Training in Office Environment
Cyber Security Training in Office Environment
 
Kenya Coconut Production Presentation by Dr. Lalith Perera
Kenya Coconut Production Presentation by Dr. Lalith PereraKenya Coconut Production Presentation by Dr. Lalith Perera
Kenya Coconut Production Presentation by Dr. Lalith Perera
 
The-Ethical-issues-ghhhhhhhhjof-Byjus.pptx
The-Ethical-issues-ghhhhhhhhjof-Byjus.pptxThe-Ethical-issues-ghhhhhhhhjof-Byjus.pptx
The-Ethical-issues-ghhhhhhhhjof-Byjus.pptx
 
Marketplace and Quality Assurance Presentation - Vincent Chirchir
Marketplace and Quality Assurance Presentation - Vincent ChirchirMarketplace and Quality Assurance Presentation - Vincent Chirchir
Marketplace and Quality Assurance Presentation - Vincent Chirchir
 
8447779800, Low rate Call girls in Shivaji Enclave Delhi NCR
8447779800, Low rate Call girls in Shivaji Enclave Delhi NCR8447779800, Low rate Call girls in Shivaji Enclave Delhi NCR
8447779800, Low rate Call girls in Shivaji Enclave Delhi NCR
 
PSCC - Capability Statement Presentation
PSCC - Capability Statement PresentationPSCC - Capability Statement Presentation
PSCC - Capability Statement Presentation
 
Enjoy ➥8448380779▻ Call Girls In Sector 18 Noida Escorts Delhi NCR
Enjoy ➥8448380779▻ Call Girls In Sector 18 Noida Escorts Delhi NCREnjoy ➥8448380779▻ Call Girls In Sector 18 Noida Escorts Delhi NCR
Enjoy ➥8448380779▻ Call Girls In Sector 18 Noida Escorts Delhi NCR
 
Organizational Structure Running A Successful Business
Organizational Structure Running A Successful BusinessOrganizational Structure Running A Successful Business
Organizational Structure Running A Successful Business
 
Flow Your Strategy at Flight Levels Day 2024
Flow Your Strategy at Flight Levels Day 2024Flow Your Strategy at Flight Levels Day 2024
Flow Your Strategy at Flight Levels Day 2024
 
Darshan Hiranandani [News About Next CEO].pdf
Darshan Hiranandani [News About Next CEO].pdfDarshan Hiranandani [News About Next CEO].pdf
Darshan Hiranandani [News About Next CEO].pdf
 
8447779800, Low rate Call girls in Uttam Nagar Delhi NCR
8447779800, Low rate Call girls in Uttam Nagar Delhi NCR8447779800, Low rate Call girls in Uttam Nagar Delhi NCR
8447779800, Low rate Call girls in Uttam Nagar Delhi NCR
 
Investment in The Coconut Industry by Nancy Cheruiyot
Investment in The Coconut Industry by Nancy CheruiyotInvestment in The Coconut Industry by Nancy Cheruiyot
Investment in The Coconut Industry by Nancy Cheruiyot
 
Market Sizes Sample Report - 2024 Edition
Market Sizes Sample Report - 2024 EditionMarket Sizes Sample Report - 2024 Edition
Market Sizes Sample Report - 2024 Edition
 
Ten Organizational Design Models to align structure and operations to busines...
Ten Organizational Design Models to align structure and operations to busines...Ten Organizational Design Models to align structure and operations to busines...
Ten Organizational Design Models to align structure and operations to busines...
 
Guide Complete Set of Residential Architectural Drawings PDF
Guide Complete Set of Residential Architectural Drawings PDFGuide Complete Set of Residential Architectural Drawings PDF
Guide Complete Set of Residential Architectural Drawings PDF
 
Buy gmail accounts.pdf Buy Old Gmail Accounts
Buy gmail accounts.pdf Buy Old Gmail AccountsBuy gmail accounts.pdf Buy Old Gmail Accounts
Buy gmail accounts.pdf Buy Old Gmail Accounts
 
Unlocking the Future: Explore Web 3.0 Workshop to Start Earning Today!
Unlocking the Future: Explore Web 3.0 Workshop to Start Earning Today!Unlocking the Future: Explore Web 3.0 Workshop to Start Earning Today!
Unlocking the Future: Explore Web 3.0 Workshop to Start Earning Today!
 
8447779800, Low rate Call girls in New Ashok Nagar Delhi NCR
8447779800, Low rate Call girls in New Ashok Nagar Delhi NCR8447779800, Low rate Call girls in New Ashok Nagar Delhi NCR
8447779800, Low rate Call girls in New Ashok Nagar Delhi NCR
 
Traction part 2 - EOS Model JAX Bridges.
Traction part 2 - EOS Model JAX Bridges.Traction part 2 - EOS Model JAX Bridges.
Traction part 2 - EOS Model JAX Bridges.
 
Chapter 9 PPT 4th edition.pdf internal audit
Chapter 9 PPT 4th edition.pdf internal auditChapter 9 PPT 4th edition.pdf internal audit
Chapter 9 PPT 4th edition.pdf internal audit
 

2012 Restaurant Industry Forecast

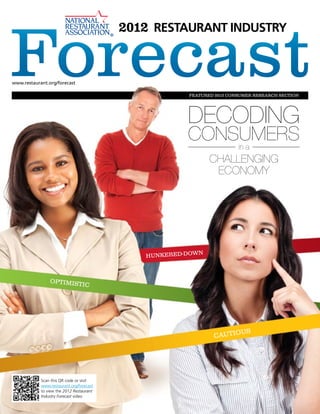
  • 1. www.restaurant.org/forecast FEATURED 2012 CONSUMER RESEARCH SECTION Decoding Consumers in a Challenging ECONOMY n Hunkered-dow Op timistic Cautious Scan this QR code or visit www.restaurant.org/forecast to view the 2012 Restaurant Industry Forecast video
  • 2. Shared Vision of the National Restaurant Association, National Restaurant Association Educational Foundation and State Restaurant Associations: We will lead America’s restaurant industry into a new era of prosperity, prominence and participation, enhancing the quality of life for all we serve. FOLLOW www.twitter.com/ WeRRestaurants MISSION MISSION We exist to help our members As the philanthropic foundation JOIN — the cornerstone of their of the National Restaurant www.facebook.com/ communities — build customer Association, we exist to enhance NationalRestaurantAssociation loyalty, rewarding careers and the restaurant industry’s service financial success. to the public through education, community engagement and the promotion of career opportunities. WATCH www.youtube.com/ restaurantdotorg We create value for our members in five ways: • Advocacy and representation Building and sustaining positive public opinion and a favorable political environment. CONNECT www.linkedin.com/ • Tools and solutions groups?gid=37937 Helping grow revenues, increase profitability and develop employees. • Education and networking Providing opportunities to connect and learn from each other. • Research and insights Anticipating and preparing for emerging trends that could impact VIEW restaurants. www.flickr.com/photos/ • Responsible stewardship restaurantdotorg Providing thought leadership to inspire community involvement and impact. www.restaurant.org
  • 3. Inside The National Restaurant Association is pleased to provide the 2012 Restaurant Industry Forecast, our 43rd annual profile of restaurant-industry opportunities and challenges for the year ahead. The research and insights are based on analysis of the latest economic data, as well as extensive surveys of restaurateurs and consumers. The National Restaurant Association will closely monitor incoming industry and economic data in the months ahead and provide updates to this Forecast at www.restaurant.org/research. The 2012 Restaurant Industry Forecast was prepared by the National Restaurant Association Research and Knowledge Group: Hudson Riehle Senior Vice President, Research and Knowledge Bruce Grindy Chief Economist Tim Smith Art Director 2012 Sales Projections....................................................................................................2 Annika Stensson Public Relations Decoding Consumers in a Challenging Economy.........................................................9 Jennifer Batty Editor Economic Outlook..........................................................................................................15 Fullservice Outlook.........................................................................................................21 Limited-Service Outlook................................................................................................27 Other Foodservice Segments.........................................................................................33 1200 17th St., NW, Washington, DC 20036 (800) 424-5156 | www.restaurant.org Food and Menu Trends..................................................................................................35 © 2012 National Restaurant Association Workforce Outlook........................................................................................................41 ISBN 978-1-931400-74-9 Supply-Chain Outlook....................................................................................................47 Thank you to our National Restaurant Appendix........................................................................................................................50 Association 2012 Restaurant Industry Forecast sponsor: www.restaurant.org | National Restaurant Association 1
  • 4. Sales Outlook 2012 Restaurant Industry Forecast 2012: Achieving Growth in a Challenging Environment 2012 Restaurant Industry Forecast D riven by the continued national choose one restaurant over another. To rants in the current environment. economic recovery and consumers’ help operators better attract and retain The second segment looks at frequent pent-up demand for the food, customers, the 2012 Forecast analyzes restaurant customers. These consumers are service and social outlet that restaurants consumers by creating two segments. critical to the restaurant industry in good provide, the U.S. restaurant industry is One segment looks at consumers by economic times, and are even more projected to expand in 2012. According to their financial situation and spending important in the current environment. The the National Restaurant Association’s 2012 patterns. The result is the creation of three three categories analyzed are: Frequent Restaurant Industry Forecast, total distinct consumer categories: Optimistic Fullservice Customers, Frequent Quickser- restaurant-industry sales are projected to Consumers, Cautious Consumers and vice Customers and Frequent Off-Premises reach a record high of $631.8 billion in Hunkered-Down Consumers. Each group Dinner Customers. Each frequent customer 2012, a 3.5 percent increase over 2011 and has a different mindset about the econo- uses his or her respective segment more the second consecutive year that industry my, and a different way of using restau- than once a week, on average. sales topped the $600 billion level. In inflation-adjusted terms, total restaurant sales are projected to grow 0.8 percent in 2012, down slightly from a 1.3 percent gain in 2011. Although both the Adding It All Up: $631.8 billion nominal and real growth rates will be Projected restaurant-industry sales in 2012 somewhat below the 2011 gains, industry growth will remain in positive territory for Commercial Restaurant Services $575.1 billion the third consecutive year. This follows the unprecedented two straight years of real Eating places*: $419.2 billion sales declines in 2008 and 2009. Bars and taverns: $18.9 billion Anticipating Consumers’ Managed services: $44.4 billion Needs In addition to revealing the Association’s Lodging places: $31.4 billion sales and economic projections on the national and state levels, the 2012 Forecast Retail, vending, recreation, mobile: $61.2 billion also takes a detailed look at the mindset and spending patterns of consumers. Noncommercial Restaurant Services $54.2 billion To be successful in today’s challenging business environment, restaurant opera- *Eating places include fullservice restaurants and limited- tors need to understand what makes service (quickservice) restaurants, cafeterias and buffets, Military Restaurant Services $2.5 billion social caterers, and snack and nonalcoholic beverage bars. customers tick and what motivates them to 2 National Restaurant Association | www.restaurant.org
  • 5. 2012 Restaurant Industry Forecast Sales Outlook Restaurant-Industry Restaurant-Industry Restaurant-Industry Share of the Food Dollar Sales Employment $ $ (Billions of Current Dollars) 14.3 million $631.8 12.9 million 11.4 million 25% 48% $379.0 $239.3 $119.6 $42.8 1955 Present 1970 1980 1990 2000 2012* 2002 2012* 2022* *Projected *Projected 42 Years of Restaurant-Industry Sales This chart shows sales growth for the restaurant industry since 1971, when the National Restaurant Association began issuing its annual forecast. The chart shows growth in the number of dollars spent each year in restaurants as well as real (inflation-adjusted) sales growth. 12.8% 12.4% 11.8% 12.3% 11.6% 11.5% 9.9% 10.8% 2012 Current dollar growth: 3.5% 9.2% 8.0% 7.9% 8.3% Real (inflation-adjusted) growth: 0.8% 8.4% 7.2% 7.7% 6.6% 6.2% 6.9% 5.8% 6.1% 5.5% 5.8% 5.3% 5.3% 5.3% 5.1% 5.0% 5.0% 4.8% 4.7% 4.6% 4.4% 4.2% 5.3% 4.2% 4.0% 3.8% 3.8% 4.0% 4.6% 4.7% 4.4% 4.5% 3.2% 4.2% 3.5% 3.0% 3.0% 3.4% 2.9% 3.0% 2.9% 3.0% 3.0% 2.8% 2.7% 3.1% 3.5% 2.5% 2.3% 2.1% 2.1% 2.0% 2.1% 2.2% 1.6% 1.6% 1.5% 1.6% 1.2% 1.2% 1.2% 1.3% 1.0% 0.8% 0.8% 0.6% 0.5% –0.2% –0.1% –0.2% –0.9%–0.6% –2.8% 1971 1975 1980 1985 1990 1995 2000 2005 2010 2012 Current dollar growth Real (inflation-adjusted) growth Growth rates are estimated for 2008 to 2010 and projected for 2011 and 2012. Providing final estimates for restaurant-industry sales from previous years is an ongoing process. The National Restaurant Association’s Restaurant TrendMapper offers updated sales estimates as they become available. Visit www.restaurant.org/trendmapper to learn more. Source: National Restaurant Association www.restaurant.org | National Restaurant Association 3
  • 6. Sales Outlook 2012 Restaurant Industry Forecast What’s in Store for Footnotes: Restaurant-Industry Sales 1 Data are given only for establishments with payroll. 2 Waiter/waitress service is provided, Restaurant-industry food-and-drink sales: Projections for 2012 and the order is taken while the patron is seated. Patrons pay ‘11–’12 % after they eat. 2011 Projected 2012 Projected ‘11–’12 % Real Growth 3 Patrons generally order at a cash F&D Sales ($000) F&D Sales ($000) Change Change register or select items from a food bar and pay before they eat. GROUP I — COMMERCIAL RESTAURANT SERVICES1 4 Formerly commercial EATING PLACES cafeterias. Fullservice restaurants2 $195,711,168 $201,386,792 2.9% 0.2% 5 Food-and-drink sales for non-payroll Limited-service (quickservice) restaurants3 168,527,095 173,751,435 3.1% 0.4% establishments are Cafeterias, grill-buffets and buffets4 8,249,697 8,472,439 2.7% 0.0% projected to total $12,615,226,000. Snack and nonalcoholic beverage bars 26,580,519 27,670,321 4.1% 1.4% 6 Also referred to as Social caterers 7,513,666 7,934,432 5.6% 2.9% onsite food-service TOTAL EATING PLACES $406,582,145 $419,215,419 3.1% 0.4% and food contractors. Bars and taverns 18,359,387 18,910,169 3.0% 0.4% 7 Includes drug- and proprietary-store TOTAL EATING-AND-DRINKING PLACES $424,941,532 $438,125,588 5 3.1% 0.4% restaurants, general- merchandise-store MANAGED SERVICES6 restaurants, variety- Manufacturing and industrial plants $7,007,302 $7,340,408 4.8% 2.1% store restaurants, food-store Commercial and office buildings 2,611,070 2,684,180 2.8% 0.1% restaurants and Hospitals and nursing homes 5,170,569 5,460,121 5.6% 2.7% grocery-store restaurants Colleges and universities 13,889,332 14,418,786 3.8% 0.6% (including a portion Primary and secondary schools 6,041,190 6,294,920 4.2% 1.4% of delis and all salad bars), gasoline- In-transit restaurant services (airlines) 2,263,753 2,342,985 3.5% 0.8% service-station restaurants and Recreation and sports centers 5,611,996 5,875,760 4.7% 2.0% miscellaneous TOTAL MANAGED SERVICES $42,595,212 $44,417,160 4.3% 1.4% retailers. LODGING PLACES 8 Includes movies, bowling lanes, Hotel restaurants $29,602,800 $30,994,132 4.7% 2.0% recreation and sport Other accommodation restaurants 397,166 419,805 5.7% 3.0% centers. TOTAL LODGING PLACES $29,999,966 $31,413,937 4.7% 2.0% 9 Includes sales of hot food, sandwiches, Retail-host restaurants7 33,152,723 35,111,790 5.9% 3.2% pastries, coffee and other hot beverages. Recreation and sports8 12,922,544 13,496,710 4.4% 1.7% 10 Business, Mobile caterers 628,422 653,685 4.0% 1.3% educational, Vending and nonstore retailers9 11,537,834 11,883,970 3.0% 0.7% governmental or institutional TOTAL — GROUP I $555,778,233 $575,102,840 3.5% 0.8% organizations that operate their own restaurant services. GROUP II — NONCOMMERCIAL RESTAURANT SERVICES10 11 Includes industrial Employee restaurant services11 $424,157 $440,942 4.0% 0.9% and commercial organizations, Public and parochial elementary, secondary schools 6,617,656 6,844,963 3.4% 0.6% seagoing and inland- Colleges and universities 7,206,760 7,478,958 3.8% 0.6% waterway vessels. 12 Includes voluntary and Transportation 2,069,914 2,175,955 5.1% 2.3% proprietary hospitals; Hospitals12 15,755,054 16,375,645 3.9% 1.2% long-term general, TB, nervous and Nursing homes, homes for the aged, blind, orphans, mental hospitals; and and the mentally and physically disabled13 7,908,212 8,192,908 3.6% 0.8% sales or commercial equivalent to Clubs, sporting and recreational camps 9,404,611 9,711,534 3.3% 0.6% employees in state Community centers 2,901,663 3,006,123 3.6% 0.8% and local short-term hospitals and federal TOTAL — GROUP II $52,288,027 $54,227,028 3.7% 0.9% hospitals. TOTAL — GROUPS I AND II $608,066,260 $629,329,868 3.5% 0.8% 13 Sales (commercial equivalent) calculated for nursing homes GROUP III — MILITARY RESTAURANT SERVICES14 and homes for the aged only. All others Officers’ and NCO clubs (Open mess) $1,626,203 $1,722,149 5.9% 3.2% in this grouping make Military exchanges 719,946 764,583 6.2% 3.5% no charge for food served either in cash TOTAL — GROUP III $2,346,149 $2,486,732 6.0% 3.3% or in kind. 14 Continental United States only. GRAND TOTAL $610,412,409 $631,816,600 3.5% 0.8% 4 National Restaurant Association | www.restaurant.org
  • 7. 2012 Restaurant Industry Forecast Sales Outlook Major Markets: Projected Sales, 2012 The chart on pages 5–6 provides more detail on the National Restaurant Association’s projections for sales in markets outside the “eating- and-drinking places” category in 2012, including foodservice sales at schools, worksites, health-care facilities, lodging places and the military. Educational Sales What this category includes: Food-and-drink sales by foodservice companies that manage restaurant services in colleges, universities, primary and secondary schools, as well as food-and-drink sales by schools that operate their own restaurant services. 2011 Projected 2012 Projected ‘11–’12 % ‘11–’12 % Real 2012 projected food-and-drink sales $35.0 billion F&D Sales ($000) F&D Sales ($000) Change Growth Change Colleges and universities Managed services $13,889,332 $14,418,786 3.8% 0.6% Noncommercial 7,206,760 7,478,958 3.8% 0.6% Subtotal 21,096,092 21,897,744 3.8% 0.6% Primary and secondary schools Managed services 6,041,190 6,294,920 4.2% 1.4% Noncommercial 6,617,656 6,844,963 3.4% 0.6% Subtotal 12,658,846 13,139,883 3.8% 1.0% TOTAL EDUCATIONAL $33,754,938 $35,037,627 3.8% 0.8% Employee Sales What this category includes: Food-and-drink sales by for-profit companies that manage restaurant services for employees at manufacturing and industrial plants and in commercial office buildings, as well as food-and-drink sales by plants and companies that run their own noncommercial employee restaurant services. 2011 Projected 2012 Projected ‘11–’12 % ‘11–’12 % Real 2012 projected food-and-drink sales $10.5 billion F&D Sales ($000) F&D Sales ($000) Change Growth Change Managed services Manufacturing and industrial plants $7,007,302 $7,340,408 4.8% 2.1% Commercial and office buildings 2,611,070 2,684,180 2.8% 0.1% Noncommercial employee restaurant services* 424,157 440,942 4.0% 0.9% TOTAL EMPLOYEE $10,042,529 $10,465,530 4.2% 1.5% *Includes sales for industrial plants and office buildings, seagoing ships, and inland-waterway vessels Health-Care Sales What this category includes: Food-and-drink sales by foodservice companies that manage restaurant services in hospitals and nursing homes, as well as food-and-drink sales by hospitals and nursing homes that operate their own restaurant services. 2011 Projected 2012 Projected ‘11–’12 % ‘11–’12 % Real 2012 projected food-and-drink sales $30.0 billion F&D Sales ($000) F&D Sales ($000) Change Growth Change Managed services in hospitals and nursing homes $5,170,569 $5,460,121 5.6% 2.7% Hospitals* 15,755,054 16,375,645 3.9% 1.2% Nursing homes** 7,908,212 8,192,908 3.6% 0.8% TOTAL HEALTH CARE $28,833,835 $30,028,674 4.1% 1.4% *Includes voluntary and proprietary hospitals; long-term general, TB, mental hospitals; and sales or commercial equivalent to employees in state and local short-term hospitals and federal hospitals. **Includes homes for the aged, blind, orphans, mentally and physically disabled; sales (commercial equivalent) calculated for nursing homes and homes for the aged only. All others in this group make no charge — either in cash or in kind for food served. Lodging-Place Sales What this category includes: Food-and-drink sales at hotel restaurants and other accommodation restaurants. 2011 Projected 2012 Projected ‘11–’12 % ‘11–’12 % Real 2012 projected food-and-drink sales $31.4 billion F&D Sales ($000) F&D Sales ($000) Change Growth Change Hotel restaurants $29,602,800 $30,994,132 4.7% 2.0% Other accommodation restaurants 397,166 419,805 5.7% 3.0% TOTAL LODGING PLACES $29,999,966 $31,413,937 4.7% 2.0% www.restaurant.org | National Restaurant Association 5
  • 8. Sales Outlook 2012 Restaurant Industry Forecast Major Markets Continued Military Sales What this category includes: Food-and-drink sales at military clubs and exchanges. 2011 Projected 2012 Projected ‘11–’12 % ‘11–’12 % Real 2012 projected food-and-drink sales $2.5 billion F&D Sales ($000) F&D Sales ($000) Change Growth Change Officers’ and NCO clubs (Open mess) $1,626,203 $1,722,149 5.9% 3.2% Military exchanges 719,946 764,583 6.2% 3.5% TOTAL MILITARY* $2,346,149 $2,486,732 6.0% 3.3% *Continental United States only. Recreational Sales What this category includes: Food-and-drink sales at recreation and sports centers, such as movie theaters, sports arenas and bowling lanes. 2011 Projected 2012 Projected ‘11–’12 % ‘11–’12 % Real 2012 projected food-and-drink sales $29.1 billion F&D Sales ($000) F&D Sales ($000) Change Growth Change Recreation and sports centers Managed services $5,611,996 $5,875,760 4.7% 2.0% Noncontractors* 12,922,544 13,496,710 4.4% 1.7% Subtotal 18,534,540 19,372,470 4.5% 1.8% Clubs, sporting and recreational camps** 9,404,611 9,711,534 3.3% 0.6% TOTAL RECREATIONAL $27,939,151 $29,084,004 4.1% 1.4% *Includes sales at movies, bowling lanes, and recreation and sports centers. **A portion of food-and-beverage sales in clubs is business-related. Transportation Sales What this category includes: Food-and-drink sales on airlines, passenger/cargo liners and railroads. 2011 Projected 2012 Projected ‘11–’12 % ‘11–’12 % Real 2012 projected food-and-drink sales $4.5 billion F&D Sales ($000) F&D Sales ($000) Change Growth Change Managed services, in-transit commercial airlines $2,263,753 $2,342,985 3.5% 0.8% Noncommercial transportation 2,069,914 2,175,955 5.1% 2.3% TOTAL TRANSPORTATION $4,333,667 $4,518,940 4.3% 1.5% Other Sales 2011 Projected 2012 Projected ‘11–’12 % ‘11–’12 % Real 2012 projected food-and-drink sales $50.7 billion F&D Sales ($000) F&D Sales ($000) Change Growth Change Retail hosts* $33,152,723 $35,111,790 5.9% 3.2% Mobile caterers 628,422 653,685 4.0% 1.3% Vending and non-store retailers** 11,537,834 11,883,970 3.0% 0.7% Community centers 2,901,663 3,006,123 3.6% 0.8% *Includes drug- and proprietary-store, general-merchandise store, variety-store, food-store and grocery-store restaurants (including a portion of delis and all salad bars); gasoline/service-station restaurants; and miscellaneous retailers. **Includes sales of hot food, sandwiches, pastries, coffee and other hot beverages. 6 National Restaurant Association | www.restaurant.org
  • 9. 2012 Restaurant Industry Forecast Sales Outlook Restaurant-Industry Sales Over Five Years: 2008-2012 2008 2009 ‘08–’09 2010 ‘09–’10 2011 ‘10–’11 2012 ‘11–’12 Sales Sales Change Sales Change Sales Change Sales Change COMMERCIAL RESTAURANT SERVICES $523,459,092 $519,554,791 –0.7% $535,106,004 3.0% $555,778,233 3.9% $575,102,840 3.5% Eating Places 388,478,808 384,111,349 –1.1% 393,028,164 2.3% 406,582,145 3.4% 419,215,419 3.1% Fullservice restaurants 191,470,223 186,109,057 –2.8% 189,459,020 1.8% 195,711,168 3.3% 201,386,792 2.9% Limited-service restaurants 157,591,999 159,010,327 0.9% 162,985,585 2.5% 168,527,095 3.4% 173,751,435 3.1% Cafeterias, grill-buffets and buffets 7,691,686 7,768,603 1.0% 8,017,198 3.2% 8,249,697 2.9% 8,472,439 2.7% Snack and nonalcoholic beverage bars 24,652,412 24,504,498 –0.6% 25,484,678 4.0% 26,580,519 4.3% 27,670,321 4.1% Social caterers 7,072,488 6,718,864 –5.0% 7,081,683 5.4% 7,513,666 6.1% 7,934,432 5.6% Bars and taverns 17,117,259 17,305,549 1.1% 17,790,104 2.8% 18,359,387 3.2% 18,910,169 3.0% TOTAL EATING-AND-DRINKING PLACES $405,596,067 $401,416,898 –1.0% $410,818,268 2.3% $424,941,532 3.4% $438,125,588 3.1% NONCOMMERCIAL RESTAURANT SERVICES $47,509,488 $47,881,491 0.8% $49,823,416 4.1% $52,288,027 4.9% $54,227,028 3.7% MILITARY RESTAURANT SERVICES $2,046,800 $2,149,353 5.0% $2,235,735 4.0% $2,346,149 4.9% $2,486,732 6.0% TOTAL INDUSTRY SALES $573,015,380 $569,585,635 –0.6% $587,165,155 3.1% $610,412,409 4.0% $631,816,600 3.5% Source: National Restaurant Association Restaurant Sales by U.S. Census Region Growth in the restaurant industry typically varies significantly by region of the country, and is most heavily influenced by gains in employment, disposable income and population. (Note: The appendix on page 50 offers details on restaurant-sales growth in each state.) Regional Snapshots East North Central East South Central Middle Atlantic Mountain Restaurant sales1 2012 projected growth: 2012 projected growth: 2012 projected growth: 2012 projected growth: and economic2 Regional National Regional National Regional National Regional National growth projected • Jobs 0.6% 1.3% • Jobs 1.3% 1.3% • Jobs 1.0% 1.3% • Jobs 1.5% 1.3% for 2012 in the • Income 0.9% 2.0% • Income 1.7% 2.0% • Income 1.6% 2.0% • Income 2.5% 2.0% nine U.S. Census • Population 0.3% 1.0% • Population 0.8% 1.0% • Population 0.3% 1.0% • Population 1.9% 1.0% regions Restaurant Restaurant Restaurant Restaurant Sales 2.9% 3.2% Sales 3.0% 3.2% Sales 3.3% 3.2% Sales 3.4% 3.2% New England Pacific South Atlantic West North Central West South Central 2012 projected growth: 2012 projected growth: 2012 projected growth: 2012 projected growth: 2012 projected growth: Regional National Regional National Regional National Regional National Regional National • Jobs 0.7% 1.3% • Jobs 1.1% 1.3% • Jobs 1.1% 1.3% • Jobs 1.1% 1.3% • Jobs 2.1% 1.3% • Income 1.4% 2.0% • Income 1.7% 2.0% • Income 2.2% 2.0% • Income 2.2% 2.0% • Income 2.4% 2.0% • Population 0.2% 1.0% • Population 1.2% 1.0% • Population 1.3% 1.0% • Population 0.7% 1.0% • Population 1.4% 1.0% Restaurant Restaurant Restaurant Restaurant Restaurant Sales 2.5% 3.2% Sales 3.0% 3.2% Sales 3.5% 3.2% Sales 2.8% 3.2% Sales 3.9% 3.2% 1 Regional restaurant-sales-growth figures are based on current dollars and not adjusted for menu price inflation. For definition of restaurant sales included in this grouping see page 50 footnote. 2 Economic indicators show growth in region’s total employment, real disposable personal income and total population. www.restaurant.org | National Restaurant Association 7
  • 10. Sales Outlook 2012 Restaurant Industry Forecast Restaurant Sales Growth in 2012 (projected) See state information appendix on page 50 for full sales projections for all states. WA 3.3% NH 2.7% ME VT MT ND 2.2% 2.7% 3.2% 4.1% OR 3.1% MA ID 2.4% MN WI NY 3.2% SD 3.1% 2.8% 3.4% RI WY 3.0% MI 2.3% 3.7% 2.7% CT NV IA PA 2.9% 3.4% NE 2.3% 3.2% 3.0% OH NJ UT IL IN DE 3.3% 3.0% 3.1% CA 3.6% CO 3.2% 2.6% WV 3.0% 3.5% KS 2.2% VA MD 2.7% MO KY 3.3% 3.7% 2.5% 3.3% DC NC 3.3% TN 3.3% AZ OK NM 2.8% 3.3% 3.4% AR SC 3.3% 3.1% 3.6% MS 2.8% AL GA 3.2% 3.1% TX 4.1% LA 3.3% AK 3.5% FL 3.9% 3.5% or higher 3.2% to 3.4% HI 2.9% 2.8% to 3.1% 2.7% or less *State restaurant-sales figures are in current dollars and not adjusted for menu price inflation. For definition of restaurant sales included in this grouping see page 50 footnote. National sales for this group are projected to increase at a 3.2 percent rate in 2012. Source: National Restaurant Association 2012 Restaurant 2012 Restaurant Top 12 States Top 12 States Sales Growth Sales Volume Projected increase in restaurant sales Projected restaurant sales volume in 2012 in 2012 ($000) North Dakota 4.1% 1 California $63,837,084 Texas 4.1% 2 Texas $38,421,874 Florida 3.9% 3 New York $31,927,145 Wyoming 3.7% 4 Florida $31,463,913 Maryland 3.7% 5 Illinois $20,677,633 South Carolina 3.6% 6 Pennsylvania $17,084,489 Utah 3.6% 7 Ohio $16,619,422 Alaska 3.5% 8 Georgia $15,224,418 Colorado 3.5% 9 North Carolina $14,685,881 New York 3.4% 10 New Jersey $13,567,704 Oklahoma 3.4% 11 Virginia $13,263,834 Nevada 3.4% 12 Massachusetts $12,632,894 8 National Restaurant Association | www.restaurant.org
  • 11. Hunkered-down u s Optimistic utio Ca FEATURED 2012 CONSUMER RESEARCH SECTION Decoding Consumers in a Challenging Economy W ith the official end of the Great Recession now more than two years in the past, most households expected things would be getting better. Sluggish job growth, persistent high unemployment, stagnant incomes and falling home prices were supposed to be in the rear view mirror by now. The good times should have returned, giving consumer sentiment a much-needed boost. Unfortunately, the reality is quite economy as either “fair” or “poor.” When different from those expectations, accord- asked the same question in December 2010, ing to new National Restaurant Association an identical 92 percent of adults gave the research. In fact, from the perspective of same assessment of the economy. many consumers, the economy didn’t It can even be argued that consumers’ improve at all in 2011. According to the view of the economy worsened over the Association’s National Household Survey last year, as 65 percent gave the economy a fielded in December 2011, 92 percent of “poor” rating in December 2011, an adults described the current state of the increase from 58 percent just a year ago. Continued … www.restaurant.org | National Restaurant Association 9
  • 12. Decoding Consumers 2012 Restaurant Industry Forecast Although the general assessment of Consumers Still Not Confident in the Economy the national economy remains negative, Consumers’ assessment of the economy, December 2011 versus December 2010 consumers are somewhat more positive December 2011 about their personal financial situation. 65% 27% 7% 1% Forty-three percent of adults described their personal finances as “excellent” December 2010 58% 34% 8% (10 percent) or “good” (33 percent), while 56 percent gave a rating of “fair” (38 percent) or “poor” (18 percent). Consumers More Optimistic About Their This is generally on par with consumers’ Own Piggy Banks sentiment a year ago, when four out of 10 Consumers’ assessment of their personal finances, December 2011 versus December 2010 assessed their personal financial situation as “excellent” or “good,” and six out of 10 December 2011 18% 38% 33% 10% said it was “fair” or “poor.” December 2010 Outlook Remains Mixed 18% 41% 34% 7% Consumers’ assessment of current Poor Fair Good Excellent economic conditions is generally bleak, Source: National Restaurant Association, National Household Survey, 2010 and 2011 but their outlook for the year ahead 56% remains mixed. In fact, when compared to December 2010, consumers are actually Same Old, Same Old somewhat less optimistic about an Outlook for 2011 Outlook for 2012 improving economic environment in the (in December 2010) (in December 2011) year ahead. Stay About Stay About Don’t Know Percent of adults the Same Get Better Three out of 10 adults (30 percent) said the Same 2% Get Better who described their 54% 29% 44% personal finances they think the nation’s economy will get 30% as “fair” or “good” better in 2012, while a solid majority expect conditions to worsen (24 percent) or stay the same (44 percent). This outlook is similar to the view consumers held a year ago, when 29 percent thought economic Get Worse 17% Get Worse 24% conditions would improve in 2011 and Source: National Restaurant Association, National Household Survey, 2010 and 2011 17 percent thought the economy would get worse. On an individual level, consumers Glass Half Full or Half Empty? are somewhat more bullish about the Consumers’ outlook for their household financial situation in 2012, by age group prospects for their personal finances in the 70% 58% 57% 61% year ahead. Thirty-three percent of adults 48% 49% 53% expect their household financial situation 33% 34% 34% to be better in 2012 than it was in 2011. 25% 13% 13% 16% 9% 11% Meanwhile, just 9 percent said they think 2% 8% their financial situation will get worse in All Adults 18 to 34 35 to 44 45 to 54 55 to 64 65 or Older 2012. Younger adults are much more optimis- Better Than 2011 About the Same as 2011 Worse Than 2011 tic about their personal economics in 2012. Source: National Restaurant Association, National Household Survey, 2011 Forty-eight percent of adults between the ages of 18 and 34 said their household financial situation will improve in 2012; Loss of Trust credit downgrade to Congress’s inability to 2 percent expect it to worsen. In contrast, Contributing to the general malaise in the reach a compromise on legislation, many only 13 percent of adults age 65 and country is the overall lack of confidence in consumers have lost trust in the pillars of older expect their household financial many of the entities and institutions that American society. situation to get better in 2012, while a are expected to be working toward Moreover, research shows that the higher 16 percent predicted it will get improving the common good. From the situation is getting worse. In the Associa- worse. financial meltdown to the nation’s AAA tion’s 2010 and 2011 National Household 10 National Restaurant Association | www.restaurant.org
  • 13. 2012 Restaurant Industry Forecast Decoding Consumers Confidence in Nation’s Pillars Still Challenged Consumers’ Level of The amount of confidence consumers have in the following institutions and entities Confidence in the Congress National Economy: 33% 36% 24% 3% December 2010 Federal Government Very Little None at All 24% 31% 32% 8% 15% A Great Deal 26% 5% National News Media Quite a Bit 25% 30% 31% 6% 6% 9% Financial Industry Some 20% 31% 37% 5% 4% 45% Large Corporations 20% 29% 36% 9% 5% December 2011 None at All Very Little Businesses in Community 18% 4% 10% 42% 27% 16% 33% A Great Deal 4% None at All Very Little Some Quite a Bit A Great Deal Quite a Bit Source: National Restaurant Association, National Household Survey, 2011 8% 69% Some 36% Percent of adults who said they had little or no confidence Source: National Restaurant Association, National Household in Congress, up from 60 percent in December 2010. Survey, 2010 and 2011 Surveys, consumers were asked how much “very little” or “none at all.” In December most, while just 10 percent picked Congress confidence they had in various American 2010, 14 percent of adults said they had “a as the biggest economic problem solver. institutions and entities. Without fail, their great deal” or “quite a bit” of confidence in responses showed that confidence in most the national economy, while 41 percent said A Head’s Up on Consumer of the main institutions and entities is they had “very little” or “none at all.” Thinking eroding across the board. Even during good economic times, one size In December 2011, 69 percent of adults does not fit all for consumers. Restaurant said they had little or no confidence in Local Business operators are well aware that they have Congress, up from 60 percent in December Leading the Way to tailor their food, service and marketing 2010. Similarly, 55 percent of adults said Consumers’ view of who is doing the most to to the kind of consumer they want to they had little or no confidence in the help get the economy back on track reach. In today’s challenging economic federal government or national news Don’t Know 13% Businesses environment, it is even more important for media, up from less than half of adults in Congress in Their operators to know their customers and Community 2010. Roughly one-half of adults said they 10% how to appeal to them. 63% had little or no confidence in large corpora- Large The Association’s 2012 Forecast takes a tions or the financial industry, which also Corporations detailed look at the mindset, motivations represented an increase from a year ago. 14% and spending patterns of today’s consumers There is one exception to consumers’ to help restaurant operators create a Source: National Restaurant Association, National Household declining confidence — they still have faith forward-thinking business plan that will Survey, 2011 in their communities’ businesses. Forty- enable them to effectively compete for three percent of adults said they have “a consumers’ limited dollars. great deal” or “quite a bit” of confidence in Searching for Problem Solvers Based on the Association’s 2011 businesses in their community, matching the With all the challenges facing the country, National Household Survey, consumers are proportion that reported similarly in 2010. where are consumers looking for solutions? divided into the following three segments Taken as a whole, the result is a shortage They are turning to their local businesses. based on their financial situation, current in confidence in the overall economy — a Nearly two-thirds of adults (63 percent) said spending behavior and economic outlook: trend that is worsening. Only 12 percent of they think businesses in their community • Optimistic Consumers: 21 percent of adults said they had “a great deal” or are doing the most to get the economy adults said they are confident in their “quite a bit” of confidence in the national moving again. Fourteen percent said they financial situation and have not cut back economy, while 51 percent said they had think large corporations are doing the on spending. www.restaurant.org | National Restaurant Association 11
  • 14. Decoding Consumers 2012 Restaurant Industry Forecast • Cautious Consumers: 42 percent of A Closer Look at Not surprisingly, Optimistic Consumers adults said they are taking a wait-and-see Today’s Consumers have the highest average household approach and have cut back somewhat on income out of the three groups. Sixty-three Optimistic Cautious Hunkered-down spending until the economy improves. Consumers Consumers Consumers percent of Optimistic Consumers have an • Hunkered-Down Consumers: 37 annual household income of $50,000 or 21% 42% 37% percent of adults said they are very more, and the average income for the concerned about the economy and have Source: National Restaurant Association, National Household group is $72,600. Cautious Consumers have Survey, 2011 cut back significantly on spending. an average household income of $63,800, while Hunkered-Down Consumers have an The Inside Scoop on Today’s Optimistic Consumers are age 65 or average income of $49,800. Consumer older, higher than the other two groups. On the national level, Cautious The demographic profiles of the three Conversely, 43 percent of Hunkered-Down Consumers are the largest category, with consumer groups are quite diverse. Nearly Consumers are between the ages of 45 and 42 percent of adults identifying themselves two-thirds of Optimistic Consumers (63 64, compared with 33 percent of Cautious with this group. The same holds true percent) are men, while 57 percent of Consumers and 25 percent of Optimistic regionally—the Cautious group represents Hunkered-Down Consumers are women. Consumers. the largest number of consumers in each The Cautious group is almost evenly split A majority of individuals in each of the of the four U.S. regions. between men and women. three consumer groups are employed, led by The Midwest region is home to the Optimistic Consumers have the highest 56 percent of Cautious Consumers. Seven- highest proportion of Optimistic Consumers representation of younger and older teen percent of Hunkered-Down Consumers (27 percent), well above this group’s share adults. Fifty-three percent of Optimistic are currently not employed, compared with in the South (20 percent), West (20 Consumers are between the ages of 18 and 8 percent of individuals in the Optimistic and percent) and Northeast (18 percent). The 44, compared with 48 percent of Cautious Cautious groups. Optimistic Consumers are West (39 percent) and South (38 percent) Consumers and 40 percent of Hunkered- slightly more likely to be retired than those regions have the highest proportion of Down Consumers. Twenty-one percent of in the other two groups. Hunkered-Down Consumers. Consumer Consumption Consumers who describe themselves as … OPTIMISTIC CAUTIOUS HUNKERED-DOWN Percent of all consumers 21% 42% 37% DEMOGRAPHIC CHARACTERISTICS Gender Male...................... 63% Male...................... 49% Male......................43% Female.................. 37% Female................... 51% Female...................57% Age 18 to 44................. 53% 18 to 44................. 48% 18 to 44.................40% 45 to 64................. 25% 45 to 64 ................ 33% 45 to 64.................43% 65 and Older........ 21% 65 and Older......... 16% 65 and Older.........15% Employment status Employed.............. 53% Employed.............. 56% Employed..............51% Not Employed........ 8% Not Employed......... 8% Not Employed.......17% Retired.................. 24% Retired.................. 20% Retired...................21% Household income Less Than $50k..... 29% Less Than $50k...... 39% Less Than $50k......56% $50k or More........ 63% $50k or More........ 53% $50k or More........37% Avg. Income.....$72,600 Avg. Income.....$63,800 Avg. Income.... $49,800 Source: National Restaurant Association, National Household Survey, 2011 12 National Restaurant Association | www.restaurant.org
  • 15. 2012 Restaurant Industry Forecast Decoding Consumers An Economic Profile of Mapping Consumers’ Mindset Today’s Consumer Regional breakdown of the three consumer categories Optimistic............. 18% All three consumer groups share the same Cautious................ 45% cloudy current assessment of the nation’s Optimistic............. 27% Hunkered-Down... 37% economy, but Optimistic Consumers and Cautious................ 40% Hunkered-Down... 33% Cautious Consumers have a more optimis- tic outlook for 2012. Forty-four percent of Optimistic Consumers and 32 percent of Optimistic............. 20% Cautious Consumers expect the economy Cautious................ 41% to get better in 2012, while less than one Hunkered-Down... 39% out of five think the economy will get worse. Among Hunkered-Down Consumers, only 20 percent expect the economy to get Optimistic............. 20% better in 2012, while 36 percent expect Cautious................ 42% economic conditions to worsen. Hunkered-Down... 38% Optimistic Consumers also are much more upbeat and optimistic than the other two groups about their personal financial Source: National Restaurant Association, National Household Survey, 2011 situation. Seventy-three percent of Optimis- tic Consumers describe their current personal finances as “excellent” or “good,” financial situation will improve in 2012. Seventy-two percent of Optimistic Consum- compared with 48 percent of Cautious The most striking economic difference ers said their current spending levels on Consumers and just 20 percent of Hunkered- between the three consumer categories is things like restaurants, entertainment, Down Consumers. All three groups are their discretionary spending levels com- clothing and travel are about the same as generally optimistic that their personal pared with before the recession began. they were before the recession began. Only Who’s Seeing Green: An Economic Profile of Today’s Consumers Consumers who describe themselves as … OPTIMISTIC CAUTIOUS HUNKERED-DOWN Percent of all consumers 21% 42% 37% ECONOMIC CHARACTERISTICS Current state of the nation’s economy Excellent/Good..... 13% Excellent/Good....... 8% Excellent/Good........4% Fair/Poor............... 87% Fair/Poor................ 92% Fair/Poor................96% Outlook for economy in 2012 Get Better............. 44% Get Better............. 32% Get Better.............20% Get Worse............. 19% Get Worse............. 18% Get Worse.............36% Current state of personal finances Excellent/Good..... 73% Excellent/Good..... 48% Excellent/Good......20% Fair/Poor............... 26% Fair/Poor................ 52% Fair/Poor................80% Outlook for personal financial situation in 2012 Get Better............. 41% Get Better............. 30% Get Better.............31% Get Worse............... 1% Get Worse............... 5% Get Worse.............17% Current spending levels on things like restaurants, Higher................... 12% Higher..................... 8% Higher...................11% entertainment, clothing and travel compared Lower.................... 16% Lower.................... 51% Lower....................67% with before the recession About the Same.... 72% About the Same.... 40% About the Same....20% Source: National Restaurant Association, National Household Survey, 2011 www.restaurant.org | National Restaurant Association 13
  • 16. Decoding Consumers 2012 Restaurant Industry Forecast 16 percent of Optimistic Consumers said spending, Cautious Consumers still have This is reflected in the sizable propor- their current spending levels are lower than restaurant patronage levels above the tion of consumers who said they would they were before the recession began. overall average. In a typical month, like to patronize the restaurant industry In contrast, 51 percent of Cautious Cautious Consumers average 7.8 quickser- more frequently — particularly in the Consumers and 67 percent of Hunkered- vice occasions, 5.0 fullservice occasions and Hunkered-Down group. Fifty-six percent of Down Consumers said their current 4.6 off-premises dinner occasions. Hunkered-Down Consumers said they are spending levels on those discretionary Although their spending levels are not eating on premises at restaurants and items are lower than they were before the reduced in the current economic environ- fast-food places as often as they would recession began. ment, Hunkered-Down Consumers haven’t like, while 54 percent reported similarly completely dropped off the restaurant radar. about ordering takeout or delivery. Consumers Still Hungry to Hunkered-Down Consumers average 4.3 This pent-up demand for restaurant Dine Out quickservice occasions, 2.8 fullservice services also extends to the better-positioned The good news for restaurant operators is occasions and 2.8 off-premises dinner groups, with more than one-third of Cautious that Optimistic Consumers are above-aver- occasions in a typical month, somewhat Consumers and roughly three out of 10 age restaurant customers across the three below the national average in each category. Optimistic Consumers saying they are not major spending categories tracked in the Regardless of the economic challenges using on-premises or off-premises options as 2012 Forecast. In a typical month, Optimis- and their impact on restaurant behavior in often as they would like. In addition, nearly tic Consumers average 7.9 quickservice the current environment, the most positive seven out of 10 Hunkered-Down Consumers occasions, 6.2 fullservice occasions and 5.2 news is that the vast majority of consumers (68 percent) and 53 percent of Cautious off-premises dinner occasions. In compari- across all categories have positive feelings Consumers said they would eat out more son, the overall adult population reported toward the restaurant industry. Ninety- often if they were financially able. averages of 6.0 quickservice occasions, 3.9 seven percent of Optimistic Consumers, These responses indicate that once the fullservice occasions and 3.4 off-premises 93 percent of Cautious Consumers and 89 economic environment improves, individuals in dinner occasions in a typical month. percent of Hunkered-Down Consumers these consumer groups will eagerly resume Despite their partial pullback on said they enjoy going to restaurants. dining on premises, ordering in and taking out. Most Consumers Still Enjoy Going to Restaurants Consumers who describe themselves as … OPTIMISTIC CAUTIOUS HUNKERED-DOWN Percent of all consumers 21% 42% 37% RESTAURANT BEHAVIOR Average quickservice occasions per month 7.9 7.8 4.3 Average fullservice occasions per month 6.2 5.0 2.8 Average off-premises dinner occasions per month 5.2 4.6 2.8 Not eating on premises as often as they would like 28% 35% 56% Not ordering takeout/delivery as often as they would like 29% 34% 54% Would eat out more often if they were financially able 38% 53% 68% Enjoy going to restaurants 97% 93% 89% Source: National Restaurant Association, National Household Survey, 2011 14 National Restaurant Association | www.restaurant.org
  • 17. SECTION 1 2012 Economic Outlook With many consumers remaining on the sidelines and other options for economic engines limited, the road ahead will be one of moderate growth.