2012 RAMS Establishing Effective ORT Requirements

Short paper on tradeoffs involved with designing an appropriate on going reliability test. Given at RAMS 2012. In some cases the use of reliability testing to sample the products at the end of assembly provides an effective means to detect shifts in materials and processes that adversely impact product reliability. Ongoing Reliability Test (ORT) design is a balance considering cost, timeliness, resolution, and accuracy. A poor ORT is costly and may increase the risk of significant field failure by falsely building management confidence. Or, the testing may be unable to detect even major adverse changes in the field failure rates by not evaluating the appropriate risks or with insufficient sampling. This paper steps through the design of an effective product ORT program for a high volume consumer product. The analysis includes business objectives, design risk, vendor variability, and accelerated life testing considerations, while also considering the real factory constraints concerning equipment, skill, and time. Considering the constraints and the major decisions based on the testing results permits the ORT to become an effective part of process control while providing protection from unwanted field failures. An effective ORT evaluates sufficient number of samples, with a set of stresses that accelerate the appropriate failure mechanisms and produces test results in a timely and informative manner

Recommended
More Related Content
Viewers also liked
More from Accendo Reliability
More from Accendo Reliability (20)
Recently uploaded
Recently uploaded (20)
2012 RAMS Establishing Effective ORT Requirements
- 1. Establishing Effective ORT Requirements Fred Schenkelberg, Ops A La Carte, LLC Key Words: Ongoing Reliability Testing (ORT), Reliability Testing, Applied Reliability SUMMARY & CONCLUSIONS While working with a small team designing and producing a high volume consumer product, one of the stage In some cases the use of reliability testing to sample the gate criteria was the publication of the ORT plan for hand off products at the end of assembly provides an effective means to to the manufacturing facility for execution. While this was detect shifts in materials and processes that adversely impact standard practice for each product, there did not exist a set of product reliability. Ongoing Reliability Test (ORT) design is a criteria or instruction on how to create the ORT plan. This balance considering cost, timeliness, resolution, and accuracy. paper steps through the process of creating that ORT plan. It A poor ORT is costly and may increase the risk of significant illustrates a real situation, including constraints, expectations field failure by falsely building management confidence. Or, and capabilities. While this process outline may not work in the testing may be unable to detect even major adverse every situation, it is intended to further the practice for the changes in the field failure rates by not evaluating the creation of effective ORT requirements. appropriate risks or with insufficient sampling. This paper steps through the design of an effective product ORT program for a high volume consumer product. 2 EXISTING & PROPOSED APPROACH The analysis includes business objectives, design risk, vendor As the new reliability engineering within the group, the variability, and accelerated life testing considerations, while task of developing the ORT plan was naturally added to my also considering the real factory constraints concerning list of tasks to accomplish prior to the release of the design to equipment, skill, and time. production. Naturally seeking guidance concerning the Considering the constraints and the major decisions based expectations and definitions of ORT within the organization, on the testing results permits the ORT to become an effective found two sets of conflicting information. One from the part of process control while providing protection from experience a test-engineering manager that had prepared a unwanted field failures. An effective ORT evaluates sufficient dozen or more ORT plans for previous projects. The second number of samples, with a set of stresses that accelerate the set of guidance from the new reliability engineering group appropriate failure mechanisms and produces test results in a manager with no experience developing ORT plans within this timely and informative manner particular organization. 2.1 Existing ORT Practice 1 INTRODUCTION One of the final tasks for the test engineering manager The best post-production testing is the testing the does not was the creation of the ORT plan for execution by the have to occur. When the design, supply chain and manufacturing quality department. The test engineering team manufacturing processes are robust, in control and the has worked closely with the design team to verify and validate likelihood of a product incurring a field failure is sufficient every aspect of the products functionality and durability. And, low the benefit of on-going reliability testing is minimal. as is common with a tight time-line product development When the design has elements close to their apportioned schedule it seemed a Herculean task to accomplish all the final reliability goals, or when the supply chain may provide highly product verification and validation testing, documentation and variable materials, or when the manufacturing process is not in reports, plus the myriad of details required for the handoff of statically process control, then the use of ORT may provide the product to the overseas manufacturing facility. The ORT significant benefit. was often just one more task and not the most important when ORT provides a means to detect shifts in the materials, compared to finalizing the product for launch. supplied components or assembly process that adversely The common practice was to replicate portions of the affects the field reliability performance. The ORT is useful if verification testing most related to reliability. Drop testing, it meets two criteria. First, it must cost less than the potential temperature & humidity exposure, thermal cycling, etc. and cost of the field failures adverted. Second, it must effectively most were done to fixed standard based set of criteria. For detect the desired defect rate threshold or the presence of an example, the temperature & humidity exposure was set for unwanted high defect rate within the population. Key aspects 85°C and 85%RH for 168 hours. It was from a consumer of the ORT design include effectiveness, timely, accurate and product or military handbook standard and was routinely done sensitive. © IEEE 2012 Proceedings – Annual Reliability and Maintainability Symposium
- 2. on every project. Failures never occurred, so it was considered follows: a ‘good’ test. Each day – shipment from factory to distribution centers It was expensive, it took a week to accomplish and the (DC) sample size/acceleration factor combination suggested the testing could at best detect a 50% failure rate with 60% At 2 weeks – shipment from DC to retailers confidence. There were no failures because the product was At 1 month – sold from retailer to customer relatively robust or the sampling plan was not likely to detect a 10% failure rate after multiple rounds of testing. Many of the At 1 year – end of warranty period tests in previous ORT plans had similar issues. They didn’t Of course the production and distribution assumptions have sufficient samples, were not timely, failed to provide above are simplifications. For the purpose of this paper we are sufficient failure mechanism acceleration or didn’t address ignoring production and distribution variations and areas of highest risk at all. Yet, the organization mandated that complexities in order to focus on the process of designing an every product have an ORT plan executed during ORT that is cost effective. Adding the actual complexity of manufacturing. production and distribution would further refine the test plan. 2.2 Recommended ORT Practice The reliability engineering manager recommend the ORT 3 DECISION CONTRAINTS plan should be cost effective and able to detect unwanted high failure rates within the product prior to it’s shipping to the There are a few key decisions related to the design of an customer. Continuing the discussion with colleagues, the ORT. These decisions impact the overall design of the test design team project manager and the engineering manager, we plan, plus shape the decisions that occur during testing. First, developed the following approach to develop an effective what is the risk we are willing to take shipping this product? ORT. Another way to phrase this question is; what defect level are we trying to detect with this test? This may or may not be the Define the product reliability goals and the apportionment same as the associated reliability goal. The goal may be the of those goals to each major element of the product. And, target, yet due to time or budget constraints we are willing to define maximum acceptable defect levels. invest in the ORT enough to detect a ‘do not ship’ threshold. Review the product shipping timeline from the time the Also, the acceptable risk may be variable and related to the product is ready for shipment till it reaches the final customer. cost of the failure. For example, a product failure that leads to For example, how long would the finished goods be within the liability lawsuits are much more expensive then a customer manufacturing site? complaint or product return. Review product development testing results for process or Assuming the product design is safe, we can focus the supply chain variability, or for design elements with little ORT design to detect an acceptably high field failure rate that margin. Prioritize on areas of highest possibility for field would result in high warranty costs due to product returns. failures. Before considering the effects of different product failure rates, consider that when a failure is caught in the lifecycle Review the manufacturing site’s capabilities for incurs different cost. After final assembly, the product performing ongoing reliability testing such has environmental accumulates additional costs that contribute to the cost of chamber capacities. Estimate the cost per unit tested for each failure. test. Assume a product failure caught at the factory simply 2.3 Example information incurs the cost of the materials and labor to produce the To illustrate the ORT design approach let’s use an product. At each stage, the cost of failure increases, due to the example situation. A high volume consumer product that additional costs for retesting, sorting, repackaging, etc. And, retails for $50 has an expected production schedule of four once with the customer and under warranty the costs include a million units over eight months. Using a linear production replacement unit. For the purpose of this paper’s example let’s schedule (assumed for simplicity) that translates to production use the following cost of failure estimates associated with each totals in a 3 shift, 7 days a week, factory to approximately: stage (when the failures are identified): 6,000 units per shift Factory - $25/unit 18,000 units per day DC - $30/unit 125,000 units per week Retailer - $50/unit 500,000 units per month Customer - $100/unit Furthermore, a unit moves along a life cycle starting with Costs may include labor, shipping, packaging, testing, distribution channels till the end of the warranty period, as sorting, scrap, repairs and are dependent on the nature of the © IEEE 2012 Proceedings – Annual Reliability and Maintainability Symposium
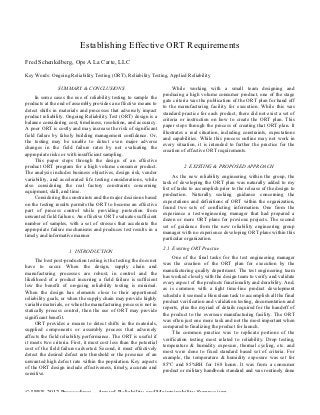
- 3. failure. For planning purposes using estimates or historical when the failure rate is detected. If the ORT detects a 2% cost information for similar products provides a starting point failure rate in one day, the cost of failure would be 18,000 to determine the balance between the test time to detect a units (one day’s production) times the failure rate time the failure and the cost of a failure exposure. $25/unit (cost of failure while still in the factory), or, 18,000 x 0.02 x $25 = $9,000. Whereas, if the same 2% failure rate was Naturally, detecting failures earlier is less expensive to detected after one month of testing, the cost could be resolve. This is due to both the additional expenses for estimated as follows: shipping, testing, and so on, yet is also includes the If it takes two months to detect the 2% failure rate, add to consideration of how many units are at risk. The longer the the total above the cost of the 2% failures of the 500,000 units ORT takes to detect an unwanted high failure rate, the more in customer hands, for an additional cost of 500,000 x 0.02 x units have been produced and in route to the customer. In the $100 = $1,000,000 for a total of $1,398,200. See Table 1 for example outlined above, if the ORT takes a month to indicate results of all the calculations. an issue, there are approximately 500,000 units across the distribution channel from the factory pending today’s Compare this cost to the expected cost of failure shipment to the retail store shelves. These units could be generated by the acceptable 1% failure rate. The cost would quarantined, retested and defective units removed. Add an only be incurred by customer returns, therefore the returns and additional month to the time to detect an issue, and there cost would be 5,000 units at a cost per month of $500,000. For would be an additional half million units in customer’s hands. a direct comparison recall that the units take a month to reach the customer, so the cost of a 1% failure rate over the same The number of units exposed is a function of the ORT two months as the example above, would be $500,000, duration or time required to detect an unacceptable failure compared to the $1,398,200 for the 2% failure rate. rate. Figure 1 shows the relationship between the test duration and number of units exposed. Figure 2 shows the relationship between test duration, cost of failure using select failure rates. Figure 1 Plot of time versus number of units at risk Location #Exposed #failed Failure Cost Figure 2 Cost of failures versus time Cost/unit This brings up two related questions to resolve when Factory 18,000 360 $25 $9,000 building the ORT plan. What are the time constraints? And, what is the budget? The time constraint is in part a function of DC 232,000 4,640 $30 $139,200 the ability to detect changes in failure rate. The next section using existing development testing results to build the ORT Retail 250,000 5,000 $50 $250,000 plan will include the detection consideration. The section on sample size directly relates to the testing budget. Total $398,200 4 DEVELOPMENT TESTING TO ORT PLAN Table 1 Cost of Failure The development process includes the discovery of what elements of the design will limit the useful life of the product. From risk analysis to design verification, the design team The cost of failures is related to the actual failure rate and learns about weaknesses in the product and production process including the supply chain. © IEEE 2012 Proceedings – Annual Reliability and Maintainability Symposium
- 4. The ORT plan takes shape as the product moves to during sample size determination, is the expected life production and we can use the information from past products, distribution is a Weibull distribution with a shape parameter, new product testing, and process and supply chain β, equal to 3. assessments. The idea is to select testing for the ORT that will For the overall ORT plan, continue the analysis of failure illuminate product life issues that will occur over a period of information along with product design, supply chain, and time of interest. This period maybe the warranty period or the process changes. Look for evidence that process or material expected useful life of the product, in some cases, we may variation would lead to a final product that is at risk for field want to know the time to end of life. Whichever period is failure. This provides the guide to selecting specific testing determined of interest, the selected testing should identify that will stress the product such that it will reveal product failures over that period of time. It is beyond the scope of this failures over the period of time of interest. It is this linkage paper to discuss the range of accelerated life testing that may between areas of greatest risk, the failure mechanism and the be employed for this testing plan. selected test that permits the ORT to detect the effect of With duration in mind, now review the history of similar assembled product variations on the product life. products, if available, for the Pareto of field failures. The historical field returns reflect a similar product population’s 5 SAMPLE SIZE DETERMINATION performance with actual customers and in their environment in real time, which is very difficult to replicate in the lab. They The question of sample size includes consideration of the types of failures reflect the areas of possible weakness in the failure rate to detect, sampling confidence, test duration which current design. is directly related to the acceleration factor above, and testing For example, let’s consider a one-year warranty period capacity. It is rare that an ORT will test as many samples for Pareto from a similar product produced over the past two as long as desired to detect a small failure rate with high years. Figure 3 shows an example Pareto based on field confidence. The practical limits of the cost of samples, testing returns. facilities capacities, and the cost penalty of finding the unacceptable failure rate late. A particular failure mechanism is only one way a system Historical Field Returns can fail. One way to use reliability apportionment is to consider the major failure mechanisms of a system and 40 allocated a reliability target for each failure mechanism. This % of total returns is like a reliability block diagram for system elements and 30 major components, just along the lines of failure mechanisms. 20 The results would be the same if each major element of a 10 system has a single dominate failure mechanism. 0 5.1 Initial Calculations For the purpose of the example, let’s assume the reliability allocation for corrosion failures is 99% reliable over one year, or a 1% failure rate over the first year. Furthermore, Figure 3 Historical Field Return information let’s assume the local policy concerning sampling a population is to use a confidence value of 90%. To get an estimate of the sample size, we can use the Success Run In this example, let’s assume the design team changed the sample size formula [1] based on the binomial distribution. type and robustness of the connectors among other design changes. And, product testing has shown significant improvement in avoiding bent pins thus reducing the risk for ln(1−C) (1) n= field failures. And, for this example, let’s assume the new ln(R) design addresses the corrosion issue with a new coating step in the process. Furthermore, the coating process window is small Where, and even small variation in the process or materials results in n is the sample size an unacceptable coating, which would lead to premature C is the statistical confidence product failure due to corrosion. R is the reliability During product development the design verification testing for the new coating found that using a specific Fixing confidence at three levels and plotting sample size temperature, humidity and bias test (again beyond the scope of versus reliability shows the increase in sample size needed for this paper to discuss the creation of a specific ALT) resulted in higher confidence and reliability. For a confidence of 90% to an acceleration factor of 12. In other words a 12-day test at show at least 90% reliability, we need 22 samples. For higher accelerated conditions would replicate a year’s worth of stress reliability the sample size increases dramatically as is apparent as seen in the field. Another piece of information, useful in Figure 4. © IEEE 2012 Proceedings – Annual Reliability and Maintainability Symposium
- 5. a higher cost per unit, plus, more total units exposed. One way to judge the two ORT plans is to assume the unknown true failure rate is 1%, 2.5% and 5%, then estimate the cost of unreliability based on the ability to detect the failure. For the 1% failure rate, the test would confirm the acceptable low failure rate and no action is taken to isolate and inspect products. If the failure rate is 5%, both test plans would find the unacceptably high defect rate, and we can assume it would be just as the test ends, thus 12 and 24 days. For the 2.5% defect rate, let’s assume the longer test takes the full 24 days to spot the higher than acceptable failure rate. And, let’s assume the 12 day test would take at least two cycles to make the detection. To fully analyze the tradeoff, construct OC curves or run simulations may be useful. Of course the units under test may fail at any point during the test Figure 4 Sample size versus reliability by confidence level period, according to the probability governed by the associated Weibull distribution. If the failure occurs earlier than just at Therefore, in order to detect a 1% defect rate that is the end of the testing, we would receive an indication of an introduced into the product, we would need to run 229 unacceptable failure rate and enjoy fewer units exposed. samples for two weeks under the determined test conditions to Another factor to consider is statistical error. approximate one year of use. The acceptable field failure rate is 1%, thus any failures over that rate we can consider as additional cost that has 5.2 Compromise Calculations gotten past the ORT. Therefore, for the cost calculations, we For the purpose of the example, let’s assume the testing subtract the cost of the associated returns from the first 1%. capacity is 50 units at any one time. Therefore, given 50 units, The following tables illustrate the comparison and and solving equation 1 for reliability, we find we could detect associated costs assuming two failure rates, of 1.2% and 4.5% a reliably of 95.5% over an approximate test time of two that are detected by the tests just as the test period ends. weeks. Another option is to the samples longer to achieve a better Actual Cost of Marginal Cost resolution on reliability. Using a Weibayes formulation of the Failure Rate Unreliability ($) of Unreliability ($) success run [2] to accommodate the Weibull distribution β = 1% 253,700 3, the formula is equation 2. 1.2% 304,440 50,740 4.5% 1,141,650 887,950 ln(1−C) Total 938,690 n= (2) Table 2 ORT plan with 24 day duration and 25 samples m β ln(R) Furthermore, let’s assume it takes 4 2-week test periods to Where, detect the 1.2% defect using the shorter test plan. Thus, there m is the number of lifetimes raised by β are 6 weeks of 1.2% defect rate product in the field producing β is the Weibull distribution shape parameter 0.2% higher than acceptable returns at $100 per return. This and, the other terms are the same as in equation 1. Note: results in an additional cost for 6 weeks x 125,000 units per that when m=1 the equation reduces to that found in equation week x 0.002 failure rate x $100 per return for an additional 1. cost of $150,000. Running the test twice as long sets m = 2, with a β = 3, we Actual Cost of Marginal Cost find the 24 day test can detect a reliability of 99.4%. This is Failure Rate Unreliability ($) of Unreliability ($) just over the desired goal of 99%, yet the testing takes twice as 1% 63,900 long, thus increasing the exposed number of units. Every 12 1.2% 76,680 12,780 days add another 25 samples, such that every two weeks the 6-weeks of 0.2% additional failures 150,000 month long results are available. 4.5% 287,550 223,650 For this simple example, the tradeoff becomes detecting Total 386,430 about a 4.5% defect rate in 12 days, or detecting a 1.2% defect Table 3 ORT plan with 12 day duration and 50 samples rate in 24 days. The number of units exposed is 18,000 per day, or 216,000 and 432,000, respectively. The shorter test plan, while designed to catch 4.5% failure The cost of unreliability is slightly different since the rates, reduces the total number of samples exposed to return longer duration test of 24 days will have some units exposed at over the target of 1%. The longer plan, in this simple © IEEE 2012 Proceedings – Annual Reliability and Maintainability Symposium
- 6. calculation, possibly costs nearly 3x as much in field returns, yet is much more capable to detect small changes in the failure rate. REFERENCES 1. Wasserman, Gary S. Reliability Verification, Testing and 6 CONCLUSIONS Analysis in Engineering Design. New York: Marcel The shorter test plan has fewer exposed units, which in Dekker, 2003, pg. 209. this simple case has a total lower expected cost than the longer 2. Wasserman, Gary S. Reliability Verification, Testing and test. The longer test exposes more units to higher levels of the Analysis in Engineering Design. New York: Marcel cost of unreliability, thus costs more. Of course, this is only Dekker, 2003, pg. 228. based a very rudimentary calculation. Accounting for when the test actually has a failure and then calculating the exposure BIOGRAPHIES and associated costs would be a significant improvement. In general, for ORT’s evaluating an increase failure rate Fred Schenkelberg failure mechanism, the longer the test runs the better the Ops A La Carte, LLC ability to detect small changes in failure rate. Calculating the 990 Richard Avenue, Suite 101 number of exposed units and the associated cost of Santa Clara, CA 95050, USA unreliability for those units, provides a means to compare e-mail: fms@opsalacarte.com ORT plans. Often we are constrained by test capabilities, and using alternative test plans that fit within the constraints may Fred Schenkelberg is a reliability engineering and management increase the risk for higher than expected returns. consultant with Ops A La Carte, with areas of focus including reliability engineering management training and accelerated life 7 FURTHER WORK testing. Previously, he co-founded and built the HP corporate reliability program, including consulting on a broad range of HP Here are a few of ideas for further work to improve the products. He is a lecturer with the University of Maryland teaching a process to design an effective and efficient ORT. graduate level course on reliability engineering management. He Simulate various perturbations in the underlying failure earned a Master of Science degree in statistics at Stanford University in 1996. He earned his bachelors degrees in Physics at the United rate and determine the time for the various test plans to State Military Academy in 1983. Fred is an active volunteer with the actually detect the change in failure rate. management committee of RAMS, currently the Chair of the Extend work to degradation ALT plans and to failure American Society of Quality Reliability Division, active at the local truncated plans. level with the Society of Reliability Engineers and IEEE’s Reliability Evaluate various failure mechanism patterns, such as wear Society, IEEE reliability standards development teams and recently joined the US delegation as a voting member of the IEC TAG 56 - out and infant mortality patterns. Durability. He is a Senior Member of ASQ and IEEE. He is an ASQ Simulate the effect of various production schedules. Certified Quality and Reliability Engineer. © IEEE 2012 Proceedings – Annual Reliability and Maintainability Symposium