More Related Content
Similar to Net Income and EPS Bridge 2002
Similar to Net Income and EPS Bridge 2002 (20)
Net Income and EPS Bridge 2002
- 1. 2002 GAAP to Non-GAAP Bridge
Net Income and EPS
®
®
Net
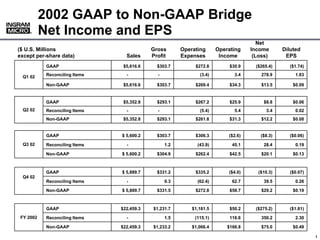
($ U.S. Millions Gross Operating Operating Income Diluted
except per-share data) Sales Profit Expenses Income (Loss) EPS
GAAP $5,616.6 $303.7 $272.8 $30.9 ($265.4) ($1.74)
Reconciling Items - - (3.4) 3.4 278.9 1.83
Q1 02
Non-GAAP $5,616.6 $303.7 $269.4 $34.3 $13.5 $0.09
GAAP $5,352.8 $293.1 $267.2 $25.9 $8.8 $0.06
Q2 02 Reconciling Items - - (5.4) 5.4 3.4 0.02
Non-GAAP $5,352.8 $293.1 $261.8 $31.3 $12.2 $0.08
GAAP $ 5,600.2 $303.7 $306.3 ($2.6) ($8.3) ($0.06)
Q3 02 Reconciling Items - 1.2 (43.9) 45.1 28.4 0.19
Non-GAAP $ 5,600.2 $304.9 $262.4 $42.5 $20.1 $0.13
GAAP $ 5,889.7 $331.2 $335.2 ($4.0) ($10.3) ($0.07)
Q4 02
Reconciling Items - 0.3 (62.4) 62.7 39.5 0.26
Non-GAAP $ 5,889.7 $331.5 $272.8 $58.7 $29.2 $0.19
GAAP $22,459.3 $1,231.7 $1,181.5 $50.2 ($275.2) ($1.81)
FY 2002 Reconciling Items - 1.5 (115.1) 116.6 350.2 2.30
Non-GAAP $22,459.3 $1,233.2 $1,066.4 $166.8 $75.0 $0.49
000000_1
1