SlideShare uma empresa Scribd logo
1 de 10
Baixar para ler offline
MARATHON OIL CORPORATION REPORTS FIRST QUARTER 2005 RESULTS

HOUSTON, April 28, 2005 –Marathon Oil Corporation (NYSE: MRO) today reported first quarter 2005 net
income of $324 million, or $0.93 per diluted share. Net income in the first quarter 2004 was $258 million, or
$0.83 per diluted share. For the first quarter of 2005, net income adjusted for special items was $357 million,
or $1.02 per diluted share. For the first quarter of 2004, net income adjusted for special items was $250
million, or $0.80 per diluted share.


Earnings Highlights
                                                                                          Quarter ended March 31
(Dollars in millions, except per diluted share data)                                       2005           2004

Net income adjusted for special items*                                                     $357           $250
Adjustments for special items (After tax):
  Gain (loss) on U.K. long-term gas contracts                                               (33)              8
Net income                                                                                 $324           $258
Net income adjusted for special items* - per diluted
   share                                                                                   $1.02        $0.80
Net income - per diluted share                                                             $0.93        $0.83
Revenues and other income                                                                $13,010      $10,693
Weighted average shares, in thousands - diluted                                          348,645      311,685

* See page 5 for a discussion of net income adjusted for special items.


Key First Quarter Events
  • Strengthened Exploration and Production Business
                 Petronius back online and at full pre-Hurricane Ivan production rates
             −
                 Equatorial Guinea condensate expansion project ramped up to full production
             −
                 Equatorial Guinea liquefied petroleum gas (LPG) expansion project commissioning continues
             −
                 on track for mid-year start-up
                 Alvheim development offshore Norway on schedule with all remaining major contracts
             −
                 awarded during first quarter
                 Vilje Plan of Development and Operation (PDO) approved by Norwegian Government
             −
                 Continued to deliver exploration success with three discoveries
             −

  • Strengthened MAP Assets
                 Achieved record first quarter refinery throughput rates
             −
                 Continued industry leading growth of same store merchandise sales
             −
                 Recently announced agreement to purchase Ft. Lauderdale, Florida, light products terminal will
             −
                 enhance MAP’s refined products distribution network

  • Advanced Integrated Gas Strategy
                 Equatorial Guinea liquefied natural gas (LNG) project construction continues on schedule
             −
Integrated Technology Project at Port of Catoosa, Oklahoma, gas-to-liquids (GTL)
            −
                 demonstration plant moving forward to further develop gas commercialization technology


“Our first quarter results were positively influenced by a number of key factors including continued high oil
and natural gas prices, solid production from our upstream business, record refinery throughputs, and a
strong refining and wholesale marketing margin,” said Clarence P. Cazalot, Jr., Marathon president and CEO.
“In addition, each of the business segments within Marathon’s fully integrated structure continued to make
progress in executing our strategies that are delivering sustainable value growth.”


Segment Results

Total segment income was $772 million in first quarter 2005, compared with $528 million in first quarter
2004.

                                                                                            1st Quarter Ended March 31

(Dollars in millions)                                                                          2005           2004
Segment Income
  Exploration & Production
    United States                                                                              $305           $306
                                                                                                250            158
     International
        E&P Segment Income                                                                       555            464
   Refining, Marketing & Transportation                                                          210             49
                                                                                                   7             15
   Integrated Gas
        Segment Income**                                                                       $772           $528


** See Preliminary Supplemental Statistics on page 8 for a reconcilement of segment income to income from operations as
reported under generally accepted accounting principles.


Exploration and Production

Upstream segment income totaled $555 million in first quarter 2005, compared to $464 million in first quarter
2004. The increase was primarily due to higher liquid hydrocarbon and natural gas prices, partially offset by
lower liquid hydrocarbon and natural gas sales volumes in the current quarter.

United States upstream income was $305 million in first quarter 2005, compared to $306 million in first
quarter 2004. Higher liquid hydrocarbon and natural gas prices and business interruption insurance
recoveries of $46 million related to Hurricane Ivan storm-related damage claims were offset by lower liquid
hydrocarbon and natural gas sales volumes. These lower volumes resulted primarily from storm-related
downtime at Petronius and Camden Hills in the Gulf of Mexico and natural field declines.

International upstream income was $250 million in first quarter 2005, compared to $158 million in first
quarter 2004. The increase is primarily a result of higher liquid hydrocarbon and natural gas prices.

Marathon continues to estimate its 2005 production available for sale will average between 325,000 and
350,000 barrels of oil equivalent per day, excluding the effect of any acquisitions or dispositions. Reported
volumes are based upon sales volumes which may vary from production available for sale primarily due to the
timing of liftings of certain of the company’s international liquid hydrocarbon volumes.


                                                      Marathon Oil Corporation Reports First Quarter 2005 Results page 2
1st Quarter Ended March 31

                                                                                             2005           2004
Key Production Statistics
Sales
   United States – Liquids (mbpd)                                                            71.6           91.8
   United States – Gas (mmcfpd)                                                             570.3          701.4
   International – Liquids (mbpd)                                                            91.5           92.1
   International – Gas (mmcfpd)                                                             455.2          434.9
Total Sales (mboepd)                                                                        334.0          373.3


A key contributor to Marathon’s first quarter upstream performance was strong overall production available for
sale during the quarter which, at an average of approximately 347,000 boepd, slightly exceeded previous
guidance of between 330,000 and 340,000 boepd. Reported crude oil and natural gas sales during the
quarter averaged 334,000 boepd. This period’s variance between production available for sale and reported
sales volumes is primarily attributable to the timing of liquid hydrocarbon liftings from the company’s
operations in Gabon and the UK.

Also during the first quarter, Marathon’s production operations benefited from the restart of the Petronius
platform in the Gulf of Mexico following extensive repairs necessitated by damage caused by Hurricane Ivan.
Petronius came back online in early March, quickly ramping up to pre-Ivan levels of approximately 25,000 net
boepd.

In addition, the company’s condensate expansion project in Equatorial Guinea ramped up to full production,
with total liquids production averaging approximately 47,000 gross barrels per day (bpd) for the quarter
(26,500 net to Marathon), but exiting March at a rate of approximately 62,000 gross bpd (35,000 net to
Marathon). Commissioning of the Equatorial Guinea LPG expansion project continued during the first quarter
with start-up on schedule for mid-year. With the LPG expansion at full production, total Equatorial Guinea
liquids production is expected to exceed 80,000 gross bpd.

Sales volumes in Russia also improved during the quarter averaging approximately 24,000 bpd compared to
approximately 16,000 bpd during the same period in 2004. The increase is a result of the East Kamennoye
development program.

In Norway, Marathon made progress in advancing the Alvheim development with the award of the two
remaining major contracts for conversion of the MST Odin to a floating production, storage and offloading
(FPSO) vessel. At this time, all the major contracts for the Alvheim development have been placed. MST Odin
hull modifications have been initiated and development drilling will commence in the third quarter of 2005.
Project development is on schedule with first production expected in 2007. In addition, the nearby Vilje field
received PDO approval from the Norwegian Government. Vilje will be tied back to Alvheim and will also begin
producing in 2007.

Marathon also announced two discoveries in Angola during the quarter. The Palas-1 and Ceres-1 discoveries
are both located on Block 31 offshore Angola and mark the fifth and sixth deepwater discoveries the company
has announced on the Block. The Palas-1 and Ceres-1 wells are located approximately 37 and 20 miles
southeast, respectively, of the planned Northeast Development Area and provide the potential for a second
development area on Block 31. In addition, Marathon is currently participating in a well on the Juno Prospect.
Marathon holds a 10 percent interest in Block 31.


                                                    Marathon Oil Corporation Reports First Quarter 2005 Results page 3
In the Gulf of Mexico, Marathon participated in the Stones well, in which it holds a 15 percent working
interest, located on Walker Ridge Block 508. The well has reached total depth and encountered hydrocarbons
in the Lower Tertiary section. Marathon and its partners are currently analyzing data from the well to
determine next steps.


Refining, Marketing and Transportation

Downstream segment income was $210 million in first quarter 2005 versus segment income of $49 million in
first quarter 2004. The improvement was primarily due to a higher refining and wholesale marketing margin
and increased refinery throughputs. Marathon Ashland Petroleum LLC (MAP) benefited from wider sweet/sour
crude differentials in general and was able to run more sour crudes during the period, taking advantage of the
substantial discounts on these feedstocks. In addition, as a result of a relatively light maintenance schedule
during the first quarter, MAP crude oil throughput was 17 percent higher than the same 2004 period. During
the quarter MAP achieved record first quarter crude runs that averaged 922,200 bpd, with total throughput
averaging a first quarter record of 1,093,600 bpd. This strong operating performance positioned the company
to help meet rising demand for motor fuels, while capturing the benefits of the strong refining margins in the
Midwest and Gulf Coast during the quarter.

During the first quarter, MAP recorded a $73 million charge for crack spread derivative contracts,
approximately $61 million of which related to mark-to-market losses on derivative contracts primarily for #2
high sulfur fuel oil crack spreads that expire over the remainder of 2005.


                                                                                          1st Quarter Ended March 31

                                                                                             2005           2004
Key Refining, Marketing & Transportation Statistics
    Crude Oil Refined (mbpd)                                                                922.2          788.6
                                                                                            171.4          196.2
     Other Charge and Blend Stocks (mbpd)
       Total Refinery Inputs (mbpd)                                                       1,093.6         984.8
   Refined Product Sales Volumes (mbpd)                                                   1,369.7       1,307.3
   Refining and Wholesale Marketing Margin ($/gallon)                                     $0.0685       $0.0344


During the quarter, Speedway SuperAmerica LLC (SSA) continued to realize strong same store merchandise
sales with an increase of approximately 11.5 percent. SSA also increased same store gasoline sales volume
by 1.2 percent when compared to the first quarter of 2004.

MAP continued to make progress on its Detroit refinery expansion project during the quarter. This $300
million project, which remains on schedule for completion during the fourth quarter of this year, will increase
the refinery’s crude processing capacity from 74,000 bpd to 100,000 bpd and enable it to meet the Federal
Tier II low-sulfur fuels regulations which become fully effective in 2006.

MAP also announced an agreement with Motiva Enterprises LLC to purchase a terminal in Ft. Lauderdale,
Florida. The 388,000 barrel light product terminal will increase MAP's storage capacity at Ft. Lauderdale by
more than 70 percent, enabling MAP to better serve the growing Florida market, improve logistics, and add
flexibility to its product sourcing. The transaction is expected to close in June 2005.


                                                    Marathon Oil Corporation Reports First Quarter 2005 Results page 4
Integrated Gas

Integrated gas segment income was $7 million in first quarter 2005 compared with $15 million in first quarter
2004. The decrease was due to mark-to-market changes in the value of derivatives used to support gas
marketing activities, partially offset by increased earnings from Marathon’s equity investment in the AMPCO
methanol plant in Equatorial Guinea. During the first quarter, the methanol plant operated at a 94 percent
on-stream factor and prices have remained strong averaging nearly $260 per ton during the quarter.

Marathon’s integrated gas activities during the quarter were marked by continued progress in constructing the
company’s LNG project in Equatorial Guinea. Project expenditures totaled approximately $675 million as of
March 31, 2005. Construction remains on schedule with first shipments of LNG expected in late 2007.

Also during the quarter, Marathon took delivery of two cargos of LNG under its long term delivery rights at the
Elba Island (Georgia) regasification terminal.   In the second half of 2005, the company will begin taking
delivery of LNG at Elba Island under terms of a supply agreement reached with BP Energy Company last year
under which BP will supply Marathon with 58 billion cubic feet of natural gas per year, as LNG, for a minimum
period of five years.

Following the successful demonstration of GTL technology at Marathon’s and Syntroleum Corporation’s Port of
Catoosa (Oklahoma) GTL facility last year, Marathon intends to further develop this important technology
through an Integrated Technology Project (ITP).    The ITP, also at the Port of Catoosa, will combine higher
efficiency syngas processing and liquid products treatment with the Syntroleum FT reactor.        This project will
build upon last year’s successful demonstration with the objective of producing ultra-clean, low-sulfur fuels
from stranded and flared natural gas at a range of economic plant sizes.

Marathon and its partners have been advised by Qatar’s Energy Minister that the company’s proposed Qatar
GTL project will be delayed. The principal reason for the delay is Qatar Petroleum’s desire to ensure that they
manage the giant North Field gas resources in the most effective manner and they are currently reviewing
their long-term gas production delivery plans.    In addition, they are examining the industry’s capacity to
manage the design and construction of the large number of gas projects in a compressed time frame in a
single location, which Marathon believes to be a reasonable and responsible approach.          Despite this delay,
Marathon remains committed to fully exploring the potential of GTL technology. Additionally, the company
continues to examine a variety of gas projects to apply the company’s GTL technology package, as well as
compressed natural gas and methanol processes which are ready for commercial application.

The company will conduct a conference call today, April 28, 2005, at 2 p.m. EDT during which it will discuss
first quarter results, as well as the modified agreement Marathon and Ashland Inc. have reached regarding
Marathon’s purchase of Ashland’s interest in MAP announced earlier this morning. To listen to the Web cast of
the conference call, visit the Marathon Web site at www.marathon.com. Replays of the Web cast will be
available through May 12, 2005. Quarterly financial and operational information is also provided on Marathon’s
Web site at http://www.marathon.com/Investor_Center/Investor_Relations/ in the Quarterly Investor Packet.

                                                    - xxx -


In addition to net income determined in accordance with generally accepted accounting principles (GAAP),
Marathon has provided supplementally “net income adjusted for special items”, a non-GAAP financial measure
which facilitates comparisons to earnings forecasts prepared by stock analysts and other third parties. Such
forecasts generally exclude the effects of items that are difficult to predict or to measure in advance and are
not directly related to Marathon's ongoing operations. A reconciliation between GAAP net income and “net
                                                  Marathon Oil Corporation Reports First Quarter 2005 Results page 5
income adjusted for special items” is provided in a table on page 1. “Net income adjusted for special items”
should not be considered a substitute for net income as reported in accordance with GAAP.

Management, as well as certain investors, uses “net income adjusted for special items” to evaluate Marathon's
financial performance between periods. Management also uses “net income adjusted for special items” to
compare Marathon's performance to certain competitors.

This release contains forward-looking statements with respect to the timing and levels of the company’s
worldwide liquid hydrocarbon and natural gas and condensate production and sales, future exploration and
drilling activity, the Alvheim/Vilje development, an LPG expansion project, a LNG project, the Detroit refinery
expansion project, and the proposed acquisition of a Ft. Lauderdale terminal. Some factors that could
potentially affect worldwide liquid hydrocarbon and natural gas and condensate production and sales, the
exploration and drilling activities and the Alvheim/Vilje development include pricing, supply and demand for
petroleum products, amount of capital available for exploration and development, occurrence of
acquisitions/dispositions of oil and gas properties, regulatory constraints, timing of commencing production
from new wells, drilling rig availability, unforeseen hazards such as weather conditions, acts of war or terrorist
acts and the governmental or military response thereto, and other geological, operating and economic
considerations. Some factors that could affect the LPG expansion project include unforeseen problems arising
from construction and unforeseen hazards such as weather conditions. Factors that could affect the LNG
project include unforeseen problems arising from construction, inability or delay in obtaining necessary
government and third party approvals, unanticipated changes in market demand or supply, environmental
issues, availability or construction of sufficient LNG vessels, and unforeseen hazards such as weather
conditions. The Detroit refinery expansion project could be affected by unforeseen problems arising from
construction, availability of materials and labor, and unforeseen hazards such as weather conditions. Factors
that could affect the acquisition of the terminal include satisfaction of closing conditions. The foregoing factors
(among others) could cause actual results to differ materially from those set forth in the forward-looking
statements. In accordance with the quot;safe harborquot; provisions of the Private Securities Litigation Reform Act of
1995, Marathon Oil Corporation has included in its Annual Report on Form 10-K for the year ended December
31, 2004 and subsequent Forms 8-K, cautionary language identifying other important factors, though not
necessarily all such factors, that could cause future outcomes to differ materially from those set forth in the
forward-looking statements.


Media Relations Contact:                    Paul Weeditz                  713-296-3910

Investor Relations Contacts:                Ken Matheny                   713-296-4114
                                           Howard Thill                   713-296-4140


                                                    Marathon Oil Corporation Reports First Quarter 2005 Results page 6
Condensed Consolidated Statement of Income (unaudited)
                                                                                         1st Quarter Ended March 31
(Dollars in millions, except per diluted share data)                                        2005           2004

Revenues and Other Income:
Sales and other operating revenues (including
  consumer excise taxes)                                                                  $9,840         $8,392
Revenue from matching buy/sell transactions                                                2,809          2,045
Sales to related parties                                                                     283            215
Income from equity method investments                                                          40             27
Net gains on disposal of assets                                                                11              2
Other income                                                                                   27             12
  Total revenues and other income                                                         13,010         10,693

Costs and Expenses:
Cost of revenues (excludes items shown below)                                              7,692          6,435
Purchases related to matching buy/sell transactions                                        2,832          2,065
Purchases from related parties                                                                 56             31
Consumer excise taxes                                                                      1,084          1,052
Depreciation, depletion and amortization                                                     323            299
Selling, general and administrative expenses                                                 260            222
Other taxes                                                                                  105              83
Exploration expenses                                                                           34             28
  Total costs and expenses                                                                12,386         10,215

Income from Operations                                                                       624            478
Net interest and other financial costs                                                         32             38
Minority interest in income (loss) of:
  Marathon Ashland Petroleum LLC                                                               70             17
  Equatorial Guinea LNG Holdings Limited                                                      (1)             —

Income before Income Taxes                                                                   523            423
Provision for income taxes                                                                   199            165

Net Income                                                                                  $324           $258


Net income
  Per share - basic                                                                        $0.94          $0.83
  Per share - diluted                                                                      $0.93          $0.83

Dividends paid per share                                                                   $0.28          $0.25

Weighted average shares, in thousands
 Basic                                                                                  346,006         310,196
 Diluted                                                                                348,645         311,685


                                                   Marathon Oil Corporation Reports First Quarter 2005 Results page 7
Preliminary Supplemental Statistics (unaudited)
                                                                                      1st Quarter Ended March 31

(Dollars in millions, except as noted)                                                   2005           2004
Income from Operations
  Exploration & Production
    United States                                                                       $305            $306
                                                                                         250             158
    International
       E&P Segment Income                                                                 555            464
  Refining, Marketing & Transportation(a)                                                 210             49
                                                                                            7             15
   Integrated Gas(b)
        Segment Income                                                                  $772            $528
Items not allocated to segments:
   Administrative Expenses                                                              $(91)           $(64)
                                                                                         (57)             14
  Gain (loss) on U.K. long-term gas contracts
       Income From Operations                                                           $624            $478
Capital Expenditures
  Exploration & Production                                                              $293            $172
  Refining, Marketing & Transportation(a)                                                134             135
  Integrated Gas(b)                                                                      126              35
                                                                                           1               2
  Corporate
    Total                                                                               $554            $344
Exploration Expense
  United States                                                                           $17              $8
                                                                                           17              17
  International
     Total                                                                                $34            $25
Operating Statistics
  Liquid Hydrocarbon Sales (mbpd)(c)
     United States                                                                       71.6           91.8

    Europe                                                                               31.2           45.0
    Other International                                                                  24.1           16.1
                                                                                         36.2           31.0
    West Africa
                                                                                         91.5           92.1
       Total International
                                                                                        163.1          183.9
      Worldwide
  Natural Gas Sales (mmcfd)(c)(d)
    United States                                                                       570.3          701.4

    Europe                                                                              371.8          358.6
                                                                                         83.4           76.3
    West Africa
                                                                                        455.2          434.9
       Total International
                                                                                     1,025.5         1,136.3
      Worldwide
    Total Sales (mboepd)                                                                334.0          373.3


                                                Marathon Oil Corporation Reports First Quarter 2005 Results page 8
Preliminary Supplemental Statistics (unaudited) (continued)
                                                                                       1st Quarter Ended March 31
(Dollars in millions, except as noted)                                                    2005           2004

Operating Statistics (continued)
  Average Sales Prices (excluding derivative gains and losses)
    Liquid Hydrocarbons ($ per bbl)
       United States                                                                    $38.47         $29.74


       Europe                                                                            45.34          31.10
       Other International                                                               24.79          17.71
       West Africa                                                                       43.23          29.48
         Total International                                                             39.10          28.22
         Worldwide                                                                      $38.82         $28.98


    Natural Gas ($ per mcf)
      United States                                                                      $4.95          $4.71


       Europe                                                                             5.05            4.14
       West Africa                                                                          .24            .24
         Total International                                                              4.17            3.46
         Worldwide                                                                       $4.60          $4.23


  Average Sales Prices (including derivative gains and losses)
    Liquid Hydrocarbons ($ per bbl)
       United States                                                                    $38.47         $28.09


       Europe                                                                            45.34          30.11
       Other International                                                               24.79          17.59
       West Africa                                                                       43.23          29.48
         Total International                                                             39.10          27.71
         Worldwide                                                                      $38.82         $27.90


    Natural Gas ($ per mcf)
      United States                                                                      $4.92          $4.66


       Europe(e)                                                                          5.05            4.14
       West Africa                                                                          .24            .24
         Total International                                                              4.17            3.46
         Worldwide                                                                       $4.59          $4.20


                                                 Marathon Oil Corporation Reports First Quarter 2005 Results page 9
Preliminary Supplemental Statistics (unaudited) (continued)
                                                                                                         1st Quarter Ended March 31
 (Dollars in millions, except as noted)                                                                     2005             2004

 MAP
      Refinery Runs (mbpd)
        Crude Oil Refined                                                                                  922.2            788.6
                                                                                                           171.4            196.2
        Other Charge and Blend Stocks
           Total                                                                                         1,093.6            984.8

      Refined Product Yields(mbpd)
        Gasoline                                                                                           576.3            552.2
        Distillates                                                                                        291.5            234.8
        Propane                                                                                              19.2            19.8
        Feedstocks and Special Products                                                                    116.4            108.0
        Heavy Fuel Oil                                                                                       32.8            26.8
                                                                                                             72.0            57.0
        Asphalt
           Total                                                                                         1,108.2            998.6
                                                         (f)
      Refined Product Sales Volumes(mbpd)                                                                1,369.7           1,307.3
        Matching buy/sell volumes included in refined
        product sales volumes (mbpd)                                                                         80.3            79.6
                                                               (g)(h)
      Refining and Wholesale Marketing Margin                                                           $0.0685          $0.0344
      Speedway SuperAmerica LLC
        Number of SSA retail outlets                                                                       1,659            1,773
        SSA Gasoline and Distillate Sales(i)                                                                 745              763
        SSA Gasoline and Distillate Gross Margin(g)                                                     $0.1058          $0.1145
        SSA Merchandise Sales                                                                               $560             $521
        SSA Merchandise Gross Margin                                                                        $143             $132


(a)
      Includes MAP at 100%. RM&T segment income includes Ashland’s 38% interest in MAP of $76 million and $18 million in the first
      quarter 2005 and 2004.
(b)
      Includes Equatorial Guinea LNG Holdings at 100%.
(c)
      Amounts reflect sales after royalties, excluding the U.K. and Ireland where amounts are before royalties.
(d)
      Includes gas acquired for injection and subsequent resale of 20.5 mmcfd and 22.0 mmcfd in the first quarter 2005 and 2004.
(e)
      Excludes the effects of the U.K. long-term gas contracts that are accounted for as derivatives.
(f)
      Total average daily volumes of all refined product sales to MAP’s wholesale, branded and retail (SSA) customers.
(g)
      Per gallon
(h)
      Sales revenue less cost of refinery inputs, purchased products and manufacturing expenses, including depreciation.
(i)
      Millions of gallons


                                                               Marathon Oil Corporation Reports First Quarter 2005 Results page 10

Mais conteúdo relacionado

Mais procurados

marathon oil 4th Quarter 2003
marathon oil   	  4th Quarter 2003marathon oil   	  4th Quarter 2003
marathon oil 4th Quarter 2003finance4
 
marathon oil 2nd Quarter 2007
marathon oil   2nd Quarter 2007marathon oil   2nd Quarter 2007
marathon oil 2nd Quarter 2007finance4
 
marathon oil 2nd Quarter 2004
marathon oil   	  2nd Quarter 2004marathon oil   	  2nd Quarter 2004
marathon oil 2nd Quarter 2004finance4
 
marathon oil 3rd Quarter 2002
marathon oil   	  3rd Quarter 2002marathon oil   	  3rd Quarter 2002
marathon oil 3rd Quarter 2002finance4
 
marathon oil 4th Quarter 2006
marathon oil  	  4th Quarter 2006marathon oil  	  4th Quarter 2006
marathon oil 4th Quarter 2006finance4
 
marathon oil 2nd Quarter 2002
 marathon oil   	  2nd Quarter 2002 marathon oil   	  2nd Quarter 2002
marathon oil 2nd Quarter 2002finance4
 
Webcast: Results Announcement - 1st Quarter 2006 (Brazilian Corporate Law)
Webcast: Results Announcement - 1st Quarter 2006 (Brazilian Corporate Law)Webcast: Results Announcement - 1st Quarter 2006 (Brazilian Corporate Law)
Webcast: Results Announcement - 1st Quarter 2006 (Brazilian Corporate Law)Petrobras
 
Chevron2008 4Q Earnings Release
Chevron2008  4Q Earnings ReleaseChevron2008  4Q Earnings Release
Chevron2008 4Q Earnings Releasefinance1
 
Webcast ingles final 2
Webcast ingles final 2Webcast ingles final 2
Webcast ingles final 2Petrobras
 
marathon oil 3rd Quarter 2007
marathon oil    	  3rd Quarter 2007 marathon oil    	  3rd Quarter 2007
marathon oil 3rd Quarter 2007 finance4
 
marathon oil 4th Quarter 2002
marathon oil   	  4th Quarter 2002marathon oil   	  4th Quarter 2002
marathon oil 4th Quarter 2002finance4
 
Teekay Corporation Third Quarter 2013 Earnings Presentation
Teekay Corporation Third Quarter 2013 Earnings PresentationTeekay Corporation Third Quarter 2013 Earnings Presentation
Teekay Corporation Third Quarter 2013 Earnings PresentationTeekay Corporation
 
marathon oil 1st Quarter 2003
marathon oil   	  1st Quarter 2003 marathon oil   	  1st Quarter 2003
marathon oil 1st Quarter 2003 finance4
 
marathon oil 3rd Quarter 2003
marathon oil   	  3rd Quarter 2003marathon oil   	  3rd Quarter 2003
marathon oil 3rd Quarter 2003finance4
 
Webcast 2 q12
Webcast 2 q12Webcast 2 q12
Webcast 2 q12Petrobras
 
TK Q1-21 Earnings Presentation
TK Q1-21 Earnings PresentationTK Q1-21 Earnings Presentation
TK Q1-21 Earnings PresentationTeekay Corporation
 
Webcast 2Q10 IFRS
Webcast 2Q10 IFRSWebcast 2Q10 IFRS
Webcast 2Q10 IFRSPetrobras
 
Webcast 1Q09 BR GAAP
Webcast 1Q09 BR GAAPWebcast 1Q09 BR GAAP
Webcast 1Q09 BR GAAPPetrobras
 
progress energy Q1 05 earnings release
progress energy Q1 05 earnings releaseprogress energy Q1 05 earnings release
progress energy Q1 05 earnings releasefinance25
 
Webcast 1Q10
Webcast 1Q10Webcast 1Q10
Webcast 1Q10Petrobras
 

Mais procurados (20)

marathon oil 4th Quarter 2003
marathon oil   	  4th Quarter 2003marathon oil   	  4th Quarter 2003
marathon oil 4th Quarter 2003
 
marathon oil 2nd Quarter 2007
marathon oil   2nd Quarter 2007marathon oil   2nd Quarter 2007
marathon oil 2nd Quarter 2007
 
marathon oil 2nd Quarter 2004
marathon oil   	  2nd Quarter 2004marathon oil   	  2nd Quarter 2004
marathon oil 2nd Quarter 2004
 
marathon oil 3rd Quarter 2002
marathon oil   	  3rd Quarter 2002marathon oil   	  3rd Quarter 2002
marathon oil 3rd Quarter 2002
 
marathon oil 4th Quarter 2006
marathon oil  	  4th Quarter 2006marathon oil  	  4th Quarter 2006
marathon oil 4th Quarter 2006
 
marathon oil 2nd Quarter 2002
 marathon oil   	  2nd Quarter 2002 marathon oil   	  2nd Quarter 2002
marathon oil 2nd Quarter 2002
 
Webcast: Results Announcement - 1st Quarter 2006 (Brazilian Corporate Law)
Webcast: Results Announcement - 1st Quarter 2006 (Brazilian Corporate Law)Webcast: Results Announcement - 1st Quarter 2006 (Brazilian Corporate Law)
Webcast: Results Announcement - 1st Quarter 2006 (Brazilian Corporate Law)
 
Chevron2008 4Q Earnings Release
Chevron2008  4Q Earnings ReleaseChevron2008  4Q Earnings Release
Chevron2008 4Q Earnings Release
 
Webcast ingles final 2
Webcast ingles final 2Webcast ingles final 2
Webcast ingles final 2
 
marathon oil 3rd Quarter 2007
marathon oil    	  3rd Quarter 2007 marathon oil    	  3rd Quarter 2007
marathon oil 3rd Quarter 2007
 
marathon oil 4th Quarter 2002
marathon oil   	  4th Quarter 2002marathon oil   	  4th Quarter 2002
marathon oil 4th Quarter 2002
 
Teekay Corporation Third Quarter 2013 Earnings Presentation
Teekay Corporation Third Quarter 2013 Earnings PresentationTeekay Corporation Third Quarter 2013 Earnings Presentation
Teekay Corporation Third Quarter 2013 Earnings Presentation
 
marathon oil 1st Quarter 2003
marathon oil   	  1st Quarter 2003 marathon oil   	  1st Quarter 2003
marathon oil 1st Quarter 2003
 
marathon oil 3rd Quarter 2003
marathon oil   	  3rd Quarter 2003marathon oil   	  3rd Quarter 2003
marathon oil 3rd Quarter 2003
 
Webcast 2 q12
Webcast 2 q12Webcast 2 q12
Webcast 2 q12
 
TK Q1-21 Earnings Presentation
TK Q1-21 Earnings PresentationTK Q1-21 Earnings Presentation
TK Q1-21 Earnings Presentation
 
Webcast 2Q10 IFRS
Webcast 2Q10 IFRSWebcast 2Q10 IFRS
Webcast 2Q10 IFRS
 
Webcast 1Q09 BR GAAP
Webcast 1Q09 BR GAAPWebcast 1Q09 BR GAAP
Webcast 1Q09 BR GAAP
 
progress energy Q1 05 earnings release
progress energy Q1 05 earnings releaseprogress energy Q1 05 earnings release
progress energy Q1 05 earnings release
 
Webcast 1Q10
Webcast 1Q10Webcast 1Q10
Webcast 1Q10
 

Destaque

walgreen Raymond James Institutional Investors Conference
walgreen Raymond James Institutional Investors Conference  walgreen Raymond James Institutional Investors Conference
walgreen Raymond James Institutional Investors Conference finance4
 
Third Quarter 2008 Earnings Conference Call Transcript
Third Quarter 2008 Earnings Conference Call Transcript Third Quarter 2008 Earnings Conference Call Transcript
Third Quarter 2008 Earnings Conference Call Transcript finance4
 
Second Quarter 2006 Earnings Conference Call Transcript
Second Quarter 2006 Earnings Conference Call TranscriptSecond Quarter 2006 Earnings Conference Call Transcript
Second Quarter 2006 Earnings Conference Call Transcriptfinance4
 
johnson & johnson 2007 Annual Report
johnson & johnson 2007 Annual Reportjohnson & johnson 2007 Annual Report
johnson & johnson 2007 Annual Reportfinance4
 
Second Quarter Reconciliation of Non-GAAP Financial Measures & Earnings Outlook
	Second Quarter Reconciliation of Non-GAAP Financial Measures & Earnings Outlook	Second Quarter Reconciliation of Non-GAAP Financial Measures & Earnings Outlook
Second Quarter Reconciliation of Non-GAAP Financial Measures & Earnings Outlookfinance4
 
Fourth Quarter 2001 Conference Call Transcript
Fourth Quarter 2001 Conference Call TranscriptFourth Quarter 2001 Conference Call Transcript
Fourth Quarter 2001 Conference Call Transcriptfinance4
 

Destaque (6)

walgreen Raymond James Institutional Investors Conference
walgreen Raymond James Institutional Investors Conference  walgreen Raymond James Institutional Investors Conference
walgreen Raymond James Institutional Investors Conference
 
Third Quarter 2008 Earnings Conference Call Transcript
Third Quarter 2008 Earnings Conference Call Transcript Third Quarter 2008 Earnings Conference Call Transcript
Third Quarter 2008 Earnings Conference Call Transcript
 
Second Quarter 2006 Earnings Conference Call Transcript
Second Quarter 2006 Earnings Conference Call TranscriptSecond Quarter 2006 Earnings Conference Call Transcript
Second Quarter 2006 Earnings Conference Call Transcript
 
johnson & johnson 2007 Annual Report
johnson & johnson 2007 Annual Reportjohnson & johnson 2007 Annual Report
johnson & johnson 2007 Annual Report
 
Second Quarter Reconciliation of Non-GAAP Financial Measures & Earnings Outlook
	Second Quarter Reconciliation of Non-GAAP Financial Measures & Earnings Outlook	Second Quarter Reconciliation of Non-GAAP Financial Measures & Earnings Outlook
Second Quarter Reconciliation of Non-GAAP Financial Measures & Earnings Outlook
 
Fourth Quarter 2001 Conference Call Transcript
Fourth Quarter 2001 Conference Call TranscriptFourth Quarter 2001 Conference Call Transcript
Fourth Quarter 2001 Conference Call Transcript
 

Semelhante a Marathon Oil Reports 21% Rise in Q1 Profits

marathon oil 1st Quarter 2008
marathon oil 1st Quarter 2008marathon oil 1st Quarter 2008
marathon oil 1st Quarter 2008finance4
 
marathon oil 3rd Quarter 2008
marathon oil  	  3rd Quarter 2008   marathon oil  	  3rd Quarter 2008
marathon oil 3rd Quarter 2008 finance4
 
marathon oil 3rd Quarter 2004
marathon oil   	  3rd Quarter 2004marathon oil   	  3rd Quarter 2004
marathon oil 3rd Quarter 2004finance4
 
Chevron Corp_Events & Presentations_Earnings Release_2008 4Q
Chevron Corp_Events & Presentations_Earnings Release_2008 4QChevron Corp_Events & Presentations_Earnings Release_2008 4Q
Chevron Corp_Events & Presentations_Earnings Release_2008 4QManya Mohan
 
marathon oil 2nd Quarter 2008
marathon oil  	  2nd Quarter 2008  marathon oil  	  2nd Quarter 2008
marathon oil 2nd Quarter 2008 finance4
 
Duke Energy 04-29-04_PMA_DLH_1Q04_Earnings_Review
Duke Energy 04-29-04_PMA_DLH_1Q04_Earnings_ReviewDuke Energy 04-29-04_PMA_DLH_1Q04_Earnings_Review
Duke Energy 04-29-04_PMA_DLH_1Q04_Earnings_Reviewfinance21
 
occidental petroleum 2008
occidental petroleum 2008occidental petroleum 2008
occidental petroleum 2008finance13
 
Duke Energy 3Q 05_Slides2
Duke Energy 3Q 05_Slides2Duke Energy 3Q 05_Slides2
Duke Energy 3Q 05_Slides2finance21
 
Duke Energy 1Q/2005/earnings_FINAL
Duke Energy 1Q/2005/earnings_FINALDuke Energy 1Q/2005/earnings_FINAL
Duke Energy 1Q/2005/earnings_FINALfinance21
 
Duke Energy 08/03/05_webslides
Duke Energy 08/03/05_webslidesDuke Energy 08/03/05_webslides
Duke Energy 08/03/05_webslidesfinance21
 
DEC_2Q04_Earnings_Review_Slides
DEC_2Q04_Earnings_Review_SlidesDEC_2Q04_Earnings_Review_Slides
DEC_2Q04_Earnings_Review_Slidesfinance21
 
05/01/06_Slides
05/01/06_Slides05/01/06_Slides
05/01/06_Slidesfinance21
 
4Q/06_Slides
4Q/06_Slides4Q/06_Slides
4Q/06_Slidesfinance21
 
occidental petroleum Slide Presentation
occidental petroleum Slide Presentationoccidental petroleum Slide Presentation
occidental petroleum Slide Presentationfinance13
 
progress energy Q4 04 earnings release
progress energy Q4 04 earnings releaseprogress energy Q4 04 earnings release
progress energy Q4 04 earnings releasefinance25
 
Exxon Mobil Corporation 1Q'06 Press Release
Exxon Mobil Corporation 1Q'06 Press ReleaseExxon Mobil Corporation 1Q'06 Press Release
Exxon Mobil Corporation 1Q'06 Press Releasefinance1
 
bnsf 1Q_2005_Investors_Report
bnsf 1Q_2005_Investors_Reportbnsf 1Q_2005_Investors_Report
bnsf 1Q_2005_Investors_Reportfinance16
 

Semelhante a Marathon Oil Reports 21% Rise in Q1 Profits (20)

marathon oil 1st Quarter 2008
marathon oil 1st Quarter 2008marathon oil 1st Quarter 2008
marathon oil 1st Quarter 2008
 
marathon oil 3rd Quarter 2008
marathon oil  	  3rd Quarter 2008   marathon oil  	  3rd Quarter 2008
marathon oil 3rd Quarter 2008
 
marathon oil 3rd Quarter 2004
marathon oil   	  3rd Quarter 2004marathon oil   	  3rd Quarter 2004
marathon oil 3rd Quarter 2004
 
Chevron Corp_Events & Presentations_Earnings Release_2008 4Q
Chevron Corp_Events & Presentations_Earnings Release_2008 4QChevron Corp_Events & Presentations_Earnings Release_2008 4Q
Chevron Corp_Events & Presentations_Earnings Release_2008 4Q
 
marathon oil 2nd Quarter 2008
marathon oil  	  2nd Quarter 2008  marathon oil  	  2nd Quarter 2008
marathon oil 2nd Quarter 2008
 
Q1 2009 Earning Report of Exxon Mobil Corp.
Q1 2009 Earning Report of Exxon Mobil Corp.Q1 2009 Earning Report of Exxon Mobil Corp.
Q1 2009 Earning Report of Exxon Mobil Corp.
 
Duke Energy 04-29-04_PMA_DLH_1Q04_Earnings_Review
Duke Energy 04-29-04_PMA_DLH_1Q04_Earnings_ReviewDuke Energy 04-29-04_PMA_DLH_1Q04_Earnings_Review
Duke Energy 04-29-04_PMA_DLH_1Q04_Earnings_Review
 
Shell Q3 2008 Qra
Shell Q3 2008 QraShell Q3 2008 Qra
Shell Q3 2008 Qra
 
Q1 2009 Earning Report of Nexen Inc ,
Q1 2009 Earning Report of Nexen Inc ,Q1 2009 Earning Report of Nexen Inc ,
Q1 2009 Earning Report of Nexen Inc ,
 
occidental petroleum 2008
occidental petroleum 2008occidental petroleum 2008
occidental petroleum 2008
 
Duke Energy 3Q 05_Slides2
Duke Energy 3Q 05_Slides2Duke Energy 3Q 05_Slides2
Duke Energy 3Q 05_Slides2
 
Duke Energy 1Q/2005/earnings_FINAL
Duke Energy 1Q/2005/earnings_FINALDuke Energy 1Q/2005/earnings_FINAL
Duke Energy 1Q/2005/earnings_FINAL
 
Duke Energy 08/03/05_webslides
Duke Energy 08/03/05_webslidesDuke Energy 08/03/05_webslides
Duke Energy 08/03/05_webslides
 
DEC_2Q04_Earnings_Review_Slides
DEC_2Q04_Earnings_Review_SlidesDEC_2Q04_Earnings_Review_Slides
DEC_2Q04_Earnings_Review_Slides
 
05/01/06_Slides
05/01/06_Slides05/01/06_Slides
05/01/06_Slides
 
4Q/06_Slides
4Q/06_Slides4Q/06_Slides
4Q/06_Slides
 
occidental petroleum Slide Presentation
occidental petroleum Slide Presentationoccidental petroleum Slide Presentation
occidental petroleum Slide Presentation
 
progress energy Q4 04 earnings release
progress energy Q4 04 earnings releaseprogress energy Q4 04 earnings release
progress energy Q4 04 earnings release
 
Exxon Mobil Corporation 1Q'06 Press Release
Exxon Mobil Corporation 1Q'06 Press ReleaseExxon Mobil Corporation 1Q'06 Press Release
Exxon Mobil Corporation 1Q'06 Press Release
 
bnsf 1Q_2005_Investors_Report
bnsf 1Q_2005_Investors_Reportbnsf 1Q_2005_Investors_Report
bnsf 1Q_2005_Investors_Report
 

Mais de finance4

walgreen Finance Committee Charter
 walgreen Finance Committee Charter walgreen Finance Committee Charter
walgreen Finance Committee Charterfinance4
 
walgreen Compensation Committee Charter
 walgreen Compensation Committee Charter walgreen Compensation Committee Charter
walgreen Compensation Committee Charterfinance4
 
walgreen Audit Committee Charter
 walgreen Audit Committee Charter walgreen Audit Committee Charter
walgreen Audit Committee Charterfinance4
 
walgreen Nominating and Governance Committee Charter
 walgreen Nominating and Governance Committee Charter   	 walgreen Nominating and Governance Committee Charter
walgreen Nominating and Governance Committee Charter finance4
 
walgreen Code of Ethics for Financial Executives
 walgreen Code of Ethics for Financial Executives walgreen Code of Ethics for Financial Executives
walgreen Code of Ethics for Financial Executivesfinance4
 
Ethics Policy Statement walgreen
Ethics Policy Statement walgreenEthics Policy Statement walgreen
Ethics Policy Statement walgreenfinance4
 
walgreen Corporate Governance Guidelines
walgreen Corporate Governance Guidelineswalgreen Corporate Governance Guidelines
walgreen Corporate Governance Guidelinesfinance4
 
walgreen Walgreen Co. First Quarter 2008 Earnings Conference
walgreen Walgreen Co. First Quarter 2008 Earnings Conference walgreen Walgreen Co. First Quarter 2008 Earnings Conference
walgreen Walgreen Co. First Quarter 2008 Earnings Conference finance4
 
Walgreen Co. I-Trax and Whole Health Management
 Walgreen Co. I-Trax and Whole Health Management  Walgreen Co. I-Trax and Whole Health Management
Walgreen Co. I-Trax and Whole Health Management finance4
 
Walgreen Co. Second Quarter 2008 Earnings
Walgreen Co. Second Quarter 2008 Earnings Walgreen Co. Second Quarter 2008 Earnings
Walgreen Co. Second Quarter 2008 Earnings finance4
 
walgreen Lehman Brothers Eleventh Annual Retail and
walgreen Lehman Brothers Eleventh Annual Retail and walgreen Lehman Brothers Eleventh Annual Retail and
walgreen Lehman Brothers Eleventh Annual Retail and finance4
 
Bank of America 2008 Health Care Conference
Bank of America 2008 Health Care Conference  Bank of America 2008 Health Care Conference
Bank of America 2008 Health Care Conference finance4
 
Sanford C. Bernstein 24th Annual Strategic Decisions
Sanford C. Bernstein 24th Annual Strategic Decisions Sanford C. Bernstein 24th Annual Strategic Decisions
Sanford C. Bernstein 24th Annual Strategic Decisions finance4
 
Walgreen Co.Third Quarter 2008 Earnings Conference
Walgreen Co.Third Quarter 2008 Earnings ConferenceWalgreen Co.Third Quarter 2008 Earnings Conference
Walgreen Co.Third Quarter 2008 Earnings Conferencefinance4
 
Walgreen Co. Fourth Quarter 2008 Earnings
Walgreen Co. Fourth Quarter 2008 Earnings Walgreen Co. Fourth Quarter 2008 Earnings
Walgreen Co. Fourth Quarter 2008 Earnings finance4
 
Walgreen Co. 2008 Analyst Day
Walgreen Co. 2008 Analyst DayWalgreen Co. 2008 Analyst Day
Walgreen Co. 2008 Analyst Dayfinance4
 
Walgreen Co. First Quarter 2009 Earnings Conference
Walgreen Co. First Quarter 2009 Earnings Conference Walgreen Co. First Quarter 2009 Earnings Conference
Walgreen Co. First Quarter 2009 Earnings Conference finance4
 
Walgreens Creates New Health and Wellness Division as Part of Strategic Move ...
Walgreens Creates New Health and Wellness Division as Part of Strategic Move ...Walgreens Creates New Health and Wellness Division as Part of Strategic Move ...
Walgreens Creates New Health and Wellness Division as Part of Strategic Move ...finance4
 
walgreen 2004 10-K/A
walgreen  2004 10-K/Awalgreen  2004 10-K/A
walgreen 2004 10-K/Afinance4
 
walgreen 2004 Proxy Statement
walgreen 2004 Proxy Statement walgreen 2004 Proxy Statement
walgreen 2004 Proxy Statement finance4
 

Mais de finance4 (20)

walgreen Finance Committee Charter
 walgreen Finance Committee Charter walgreen Finance Committee Charter
walgreen Finance Committee Charter
 
walgreen Compensation Committee Charter
 walgreen Compensation Committee Charter walgreen Compensation Committee Charter
walgreen Compensation Committee Charter
 
walgreen Audit Committee Charter
 walgreen Audit Committee Charter walgreen Audit Committee Charter
walgreen Audit Committee Charter
 
walgreen Nominating and Governance Committee Charter
 walgreen Nominating and Governance Committee Charter   	 walgreen Nominating and Governance Committee Charter
walgreen Nominating and Governance Committee Charter
 
walgreen Code of Ethics for Financial Executives
 walgreen Code of Ethics for Financial Executives walgreen Code of Ethics for Financial Executives
walgreen Code of Ethics for Financial Executives
 
Ethics Policy Statement walgreen
Ethics Policy Statement walgreenEthics Policy Statement walgreen
Ethics Policy Statement walgreen
 
walgreen Corporate Governance Guidelines
walgreen Corporate Governance Guidelineswalgreen Corporate Governance Guidelines
walgreen Corporate Governance Guidelines
 
walgreen Walgreen Co. First Quarter 2008 Earnings Conference
walgreen Walgreen Co. First Quarter 2008 Earnings Conference walgreen Walgreen Co. First Quarter 2008 Earnings Conference
walgreen Walgreen Co. First Quarter 2008 Earnings Conference
 
Walgreen Co. I-Trax and Whole Health Management
 Walgreen Co. I-Trax and Whole Health Management  Walgreen Co. I-Trax and Whole Health Management
Walgreen Co. I-Trax and Whole Health Management
 
Walgreen Co. Second Quarter 2008 Earnings
Walgreen Co. Second Quarter 2008 Earnings Walgreen Co. Second Quarter 2008 Earnings
Walgreen Co. Second Quarter 2008 Earnings
 
walgreen Lehman Brothers Eleventh Annual Retail and
walgreen Lehman Brothers Eleventh Annual Retail and walgreen Lehman Brothers Eleventh Annual Retail and
walgreen Lehman Brothers Eleventh Annual Retail and
 
Bank of America 2008 Health Care Conference
Bank of America 2008 Health Care Conference  Bank of America 2008 Health Care Conference
Bank of America 2008 Health Care Conference
 
Sanford C. Bernstein 24th Annual Strategic Decisions
Sanford C. Bernstein 24th Annual Strategic Decisions Sanford C. Bernstein 24th Annual Strategic Decisions
Sanford C. Bernstein 24th Annual Strategic Decisions
 
Walgreen Co.Third Quarter 2008 Earnings Conference
Walgreen Co.Third Quarter 2008 Earnings ConferenceWalgreen Co.Third Quarter 2008 Earnings Conference
Walgreen Co.Third Quarter 2008 Earnings Conference
 
Walgreen Co. Fourth Quarter 2008 Earnings
Walgreen Co. Fourth Quarter 2008 Earnings Walgreen Co. Fourth Quarter 2008 Earnings
Walgreen Co. Fourth Quarter 2008 Earnings
 
Walgreen Co. 2008 Analyst Day
Walgreen Co. 2008 Analyst DayWalgreen Co. 2008 Analyst Day
Walgreen Co. 2008 Analyst Day
 
Walgreen Co. First Quarter 2009 Earnings Conference
Walgreen Co. First Quarter 2009 Earnings Conference Walgreen Co. First Quarter 2009 Earnings Conference
Walgreen Co. First Quarter 2009 Earnings Conference
 
Walgreens Creates New Health and Wellness Division as Part of Strategic Move ...
Walgreens Creates New Health and Wellness Division as Part of Strategic Move ...Walgreens Creates New Health and Wellness Division as Part of Strategic Move ...
Walgreens Creates New Health and Wellness Division as Part of Strategic Move ...
 
walgreen 2004 10-K/A
walgreen  2004 10-K/Awalgreen  2004 10-K/A
walgreen 2004 10-K/A
 
walgreen 2004 Proxy Statement
walgreen 2004 Proxy Statement walgreen 2004 Proxy Statement
walgreen 2004 Proxy Statement
 

Último

Financial Preparation for Millennia.pptx
Financial Preparation for Millennia.pptxFinancial Preparation for Millennia.pptx
Financial Preparation for Millennia.pptxsimon978302
 
The AES Investment Code - the go-to counsel for the most well-informed, wise...
The AES Investment Code -  the go-to counsel for the most well-informed, wise...The AES Investment Code -  the go-to counsel for the most well-informed, wise...
The AES Investment Code - the go-to counsel for the most well-informed, wise...AES International
 
原版1:1复刻温哥华岛大学毕业证Vancouver毕业证留信学历认证
原版1:1复刻温哥华岛大学毕业证Vancouver毕业证留信学历认证原版1:1复刻温哥华岛大学毕业证Vancouver毕业证留信学历认证
原版1:1复刻温哥华岛大学毕业证Vancouver毕业证留信学历认证rjrjkk
 
《加拿大本地办假证-寻找办理Dalhousie毕业证和达尔豪斯大学毕业证书的中介代理》
《加拿大本地办假证-寻找办理Dalhousie毕业证和达尔豪斯大学毕业证书的中介代理》《加拿大本地办假证-寻找办理Dalhousie毕业证和达尔豪斯大学毕业证书的中介代理》
《加拿大本地办假证-寻找办理Dalhousie毕业证和达尔豪斯大学毕业证书的中介代理》rnrncn29
 
原版1:1复刻堪萨斯大学毕业证KU毕业证留信学历认证
原版1:1复刻堪萨斯大学毕业证KU毕业证留信学历认证原版1:1复刻堪萨斯大学毕业证KU毕业证留信学历认证
原版1:1复刻堪萨斯大学毕业证KU毕业证留信学历认证jdkhjh
 
NO1 Certified Best Amil In Rawalpindi Bangali Baba In Rawalpindi jadu tona ka...
NO1 Certified Best Amil In Rawalpindi Bangali Baba In Rawalpindi jadu tona ka...NO1 Certified Best Amil In Rawalpindi Bangali Baba In Rawalpindi jadu tona ka...
NO1 Certified Best Amil In Rawalpindi Bangali Baba In Rawalpindi jadu tona ka...Amil baba
 
The Core Functions of the Bangko Sentral ng Pilipinas
The Core Functions of the Bangko Sentral ng PilipinasThe Core Functions of the Bangko Sentral ng Pilipinas
The Core Functions of the Bangko Sentral ng PilipinasCherylouCamus
 
Market Morning Updates for 16th April 2024
Market Morning Updates for 16th April 2024Market Morning Updates for 16th April 2024
Market Morning Updates for 16th April 2024Devarsh Vakil
 
(办理原版一样)QUT毕业证昆士兰科技大学毕业证学位证留信学历认证成绩单补办
(办理原版一样)QUT毕业证昆士兰科技大学毕业证学位证留信学历认证成绩单补办(办理原版一样)QUT毕业证昆士兰科技大学毕业证学位证留信学历认证成绩单补办
(办理原版一样)QUT毕业证昆士兰科技大学毕业证学位证留信学历认证成绩单补办fqiuho152
 
Managing Finances in a Small Business (yes).pdf
Managing Finances  in a Small Business (yes).pdfManaging Finances  in a Small Business (yes).pdf
Managing Finances in a Small Business (yes).pdfmar yame
 
cost of capital questions financial management
cost of capital questions financial managementcost of capital questions financial management
cost of capital questions financial managementtanmayarora23
 
BPPG response - Options for Defined Benefit schemes - 19Apr24.pdf
BPPG response - Options for Defined Benefit schemes - 19Apr24.pdfBPPG response - Options for Defined Benefit schemes - 19Apr24.pdf
BPPG response - Options for Defined Benefit schemes - 19Apr24.pdfHenry Tapper
 
Bladex 1Q24 Earning Results Presentation
Bladex 1Q24 Earning Results PresentationBladex 1Q24 Earning Results Presentation
Bladex 1Q24 Earning Results PresentationBladex
 
SBP-Market-Operations and market managment
SBP-Market-Operations and market managmentSBP-Market-Operations and market managment
SBP-Market-Operations and market managmentfactical
 
Vp Girls near me Delhi Call Now or WhatsApp
Vp Girls near me Delhi Call Now or WhatsAppVp Girls near me Delhi Call Now or WhatsApp
Vp Girls near me Delhi Call Now or WhatsAppmiss dipika
 
NO1 Certified Black Magic Specialist Expert In Bahawalpur, Sargodha, Sialkot,...
NO1 Certified Black Magic Specialist Expert In Bahawalpur, Sargodha, Sialkot,...NO1 Certified Black Magic Specialist Expert In Bahawalpur, Sargodha, Sialkot,...
NO1 Certified Black Magic Specialist Expert In Bahawalpur, Sargodha, Sialkot,...Amil baba
 
NO1 Certified kala jadu karne wale ka contact number kala jadu karne wale bab...
NO1 Certified kala jadu karne wale ka contact number kala jadu karne wale bab...NO1 Certified kala jadu karne wale ka contact number kala jadu karne wale bab...
NO1 Certified kala jadu karne wale ka contact number kala jadu karne wale bab...Amil baba
 
『澳洲文凭』买科廷大学毕业证书成绩单办理澳洲Curtin文凭学位证书
『澳洲文凭』买科廷大学毕业证书成绩单办理澳洲Curtin文凭学位证书『澳洲文凭』买科廷大学毕业证书成绩单办理澳洲Curtin文凭学位证书
『澳洲文凭』买科廷大学毕业证书成绩单办理澳洲Curtin文凭学位证书rnrncn29
 
Stock Market Brief Deck FOR 4/17 video.pdf
Stock Market Brief Deck FOR 4/17 video.pdfStock Market Brief Deck FOR 4/17 video.pdf
Stock Market Brief Deck FOR 4/17 video.pdfMichael Silva
 
Call Girls Near Me WhatsApp:+91-9833363713
Call Girls Near Me WhatsApp:+91-9833363713Call Girls Near Me WhatsApp:+91-9833363713
Call Girls Near Me WhatsApp:+91-9833363713Sonam Pathan
 

Último (20)

Financial Preparation for Millennia.pptx
Financial Preparation for Millennia.pptxFinancial Preparation for Millennia.pptx
Financial Preparation for Millennia.pptx
 
The AES Investment Code - the go-to counsel for the most well-informed, wise...
The AES Investment Code -  the go-to counsel for the most well-informed, wise...The AES Investment Code -  the go-to counsel for the most well-informed, wise...
The AES Investment Code - the go-to counsel for the most well-informed, wise...
 
原版1:1复刻温哥华岛大学毕业证Vancouver毕业证留信学历认证
原版1:1复刻温哥华岛大学毕业证Vancouver毕业证留信学历认证原版1:1复刻温哥华岛大学毕业证Vancouver毕业证留信学历认证
原版1:1复刻温哥华岛大学毕业证Vancouver毕业证留信学历认证
 
《加拿大本地办假证-寻找办理Dalhousie毕业证和达尔豪斯大学毕业证书的中介代理》
《加拿大本地办假证-寻找办理Dalhousie毕业证和达尔豪斯大学毕业证书的中介代理》《加拿大本地办假证-寻找办理Dalhousie毕业证和达尔豪斯大学毕业证书的中介代理》
《加拿大本地办假证-寻找办理Dalhousie毕业证和达尔豪斯大学毕业证书的中介代理》
 
原版1:1复刻堪萨斯大学毕业证KU毕业证留信学历认证
原版1:1复刻堪萨斯大学毕业证KU毕业证留信学历认证原版1:1复刻堪萨斯大学毕业证KU毕业证留信学历认证
原版1:1复刻堪萨斯大学毕业证KU毕业证留信学历认证
 
NO1 Certified Best Amil In Rawalpindi Bangali Baba In Rawalpindi jadu tona ka...
NO1 Certified Best Amil In Rawalpindi Bangali Baba In Rawalpindi jadu tona ka...NO1 Certified Best Amil In Rawalpindi Bangali Baba In Rawalpindi jadu tona ka...
NO1 Certified Best Amil In Rawalpindi Bangali Baba In Rawalpindi jadu tona ka...
 
The Core Functions of the Bangko Sentral ng Pilipinas
The Core Functions of the Bangko Sentral ng PilipinasThe Core Functions of the Bangko Sentral ng Pilipinas
The Core Functions of the Bangko Sentral ng Pilipinas
 
Market Morning Updates for 16th April 2024
Market Morning Updates for 16th April 2024Market Morning Updates for 16th April 2024
Market Morning Updates for 16th April 2024
 
(办理原版一样)QUT毕业证昆士兰科技大学毕业证学位证留信学历认证成绩单补办
(办理原版一样)QUT毕业证昆士兰科技大学毕业证学位证留信学历认证成绩单补办(办理原版一样)QUT毕业证昆士兰科技大学毕业证学位证留信学历认证成绩单补办
(办理原版一样)QUT毕业证昆士兰科技大学毕业证学位证留信学历认证成绩单补办
 
Managing Finances in a Small Business (yes).pdf
Managing Finances  in a Small Business (yes).pdfManaging Finances  in a Small Business (yes).pdf
Managing Finances in a Small Business (yes).pdf
 
cost of capital questions financial management
cost of capital questions financial managementcost of capital questions financial management
cost of capital questions financial management
 
BPPG response - Options for Defined Benefit schemes - 19Apr24.pdf
BPPG response - Options for Defined Benefit schemes - 19Apr24.pdfBPPG response - Options for Defined Benefit schemes - 19Apr24.pdf
BPPG response - Options for Defined Benefit schemes - 19Apr24.pdf
 
Bladex 1Q24 Earning Results Presentation
Bladex 1Q24 Earning Results PresentationBladex 1Q24 Earning Results Presentation
Bladex 1Q24 Earning Results Presentation
 
SBP-Market-Operations and market managment
SBP-Market-Operations and market managmentSBP-Market-Operations and market managment
SBP-Market-Operations and market managment
 
Vp Girls near me Delhi Call Now or WhatsApp
Vp Girls near me Delhi Call Now or WhatsAppVp Girls near me Delhi Call Now or WhatsApp
Vp Girls near me Delhi Call Now or WhatsApp
 
NO1 Certified Black Magic Specialist Expert In Bahawalpur, Sargodha, Sialkot,...
NO1 Certified Black Magic Specialist Expert In Bahawalpur, Sargodha, Sialkot,...NO1 Certified Black Magic Specialist Expert In Bahawalpur, Sargodha, Sialkot,...
NO1 Certified Black Magic Specialist Expert In Bahawalpur, Sargodha, Sialkot,...
 
NO1 Certified kala jadu karne wale ka contact number kala jadu karne wale bab...
NO1 Certified kala jadu karne wale ka contact number kala jadu karne wale bab...NO1 Certified kala jadu karne wale ka contact number kala jadu karne wale bab...
NO1 Certified kala jadu karne wale ka contact number kala jadu karne wale bab...
 
『澳洲文凭』买科廷大学毕业证书成绩单办理澳洲Curtin文凭学位证书
『澳洲文凭』买科廷大学毕业证书成绩单办理澳洲Curtin文凭学位证书『澳洲文凭』买科廷大学毕业证书成绩单办理澳洲Curtin文凭学位证书
『澳洲文凭』买科廷大学毕业证书成绩单办理澳洲Curtin文凭学位证书
 
Stock Market Brief Deck FOR 4/17 video.pdf
Stock Market Brief Deck FOR 4/17 video.pdfStock Market Brief Deck FOR 4/17 video.pdf
Stock Market Brief Deck FOR 4/17 video.pdf
 
Call Girls Near Me WhatsApp:+91-9833363713
Call Girls Near Me WhatsApp:+91-9833363713Call Girls Near Me WhatsApp:+91-9833363713
Call Girls Near Me WhatsApp:+91-9833363713
 

Marathon Oil Reports 21% Rise in Q1 Profits

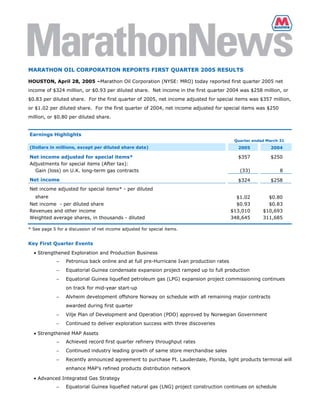
  • 1. MARATHON OIL CORPORATION REPORTS FIRST QUARTER 2005 RESULTS HOUSTON, April 28, 2005 –Marathon Oil Corporation (NYSE: MRO) today reported first quarter 2005 net income of $324 million, or $0.93 per diluted share. Net income in the first quarter 2004 was $258 million, or $0.83 per diluted share. For the first quarter of 2005, net income adjusted for special items was $357 million, or $1.02 per diluted share. For the first quarter of 2004, net income adjusted for special items was $250 million, or $0.80 per diluted share. Earnings Highlights Quarter ended March 31 (Dollars in millions, except per diluted share data) 2005 2004 Net income adjusted for special items* $357 $250 Adjustments for special items (After tax): Gain (loss) on U.K. long-term gas contracts (33) 8 Net income $324 $258 Net income adjusted for special items* - per diluted share $1.02 $0.80 Net income - per diluted share $0.93 $0.83 Revenues and other income $13,010 $10,693 Weighted average shares, in thousands - diluted 348,645 311,685 * See page 5 for a discussion of net income adjusted for special items. Key First Quarter Events • Strengthened Exploration and Production Business Petronius back online and at full pre-Hurricane Ivan production rates − Equatorial Guinea condensate expansion project ramped up to full production − Equatorial Guinea liquefied petroleum gas (LPG) expansion project commissioning continues − on track for mid-year start-up Alvheim development offshore Norway on schedule with all remaining major contracts − awarded during first quarter Vilje Plan of Development and Operation (PDO) approved by Norwegian Government − Continued to deliver exploration success with three discoveries − • Strengthened MAP Assets Achieved record first quarter refinery throughput rates − Continued industry leading growth of same store merchandise sales − Recently announced agreement to purchase Ft. Lauderdale, Florida, light products terminal will − enhance MAP’s refined products distribution network • Advanced Integrated Gas Strategy Equatorial Guinea liquefied natural gas (LNG) project construction continues on schedule −
  • 2. Integrated Technology Project at Port of Catoosa, Oklahoma, gas-to-liquids (GTL) − demonstration plant moving forward to further develop gas commercialization technology “Our first quarter results were positively influenced by a number of key factors including continued high oil and natural gas prices, solid production from our upstream business, record refinery throughputs, and a strong refining and wholesale marketing margin,” said Clarence P. Cazalot, Jr., Marathon president and CEO. “In addition, each of the business segments within Marathon’s fully integrated structure continued to make progress in executing our strategies that are delivering sustainable value growth.” Segment Results Total segment income was $772 million in first quarter 2005, compared with $528 million in first quarter 2004. 1st Quarter Ended March 31 (Dollars in millions) 2005 2004 Segment Income Exploration & Production United States $305 $306 250 158 International E&P Segment Income 555 464 Refining, Marketing & Transportation 210 49 7 15 Integrated Gas Segment Income** $772 $528 ** See Preliminary Supplemental Statistics on page 8 for a reconcilement of segment income to income from operations as reported under generally accepted accounting principles. Exploration and Production Upstream segment income totaled $555 million in first quarter 2005, compared to $464 million in first quarter 2004. The increase was primarily due to higher liquid hydrocarbon and natural gas prices, partially offset by lower liquid hydrocarbon and natural gas sales volumes in the current quarter. United States upstream income was $305 million in first quarter 2005, compared to $306 million in first quarter 2004. Higher liquid hydrocarbon and natural gas prices and business interruption insurance recoveries of $46 million related to Hurricane Ivan storm-related damage claims were offset by lower liquid hydrocarbon and natural gas sales volumes. These lower volumes resulted primarily from storm-related downtime at Petronius and Camden Hills in the Gulf of Mexico and natural field declines. International upstream income was $250 million in first quarter 2005, compared to $158 million in first quarter 2004. The increase is primarily a result of higher liquid hydrocarbon and natural gas prices. Marathon continues to estimate its 2005 production available for sale will average between 325,000 and 350,000 barrels of oil equivalent per day, excluding the effect of any acquisitions or dispositions. Reported volumes are based upon sales volumes which may vary from production available for sale primarily due to the timing of liftings of certain of the company’s international liquid hydrocarbon volumes. Marathon Oil Corporation Reports First Quarter 2005 Results page 2
  • 3. 1st Quarter Ended March 31 2005 2004 Key Production Statistics Sales United States – Liquids (mbpd) 71.6 91.8 United States – Gas (mmcfpd) 570.3 701.4 International – Liquids (mbpd) 91.5 92.1 International – Gas (mmcfpd) 455.2 434.9 Total Sales (mboepd) 334.0 373.3 A key contributor to Marathon’s first quarter upstream performance was strong overall production available for sale during the quarter which, at an average of approximately 347,000 boepd, slightly exceeded previous guidance of between 330,000 and 340,000 boepd. Reported crude oil and natural gas sales during the quarter averaged 334,000 boepd. This period’s variance between production available for sale and reported sales volumes is primarily attributable to the timing of liquid hydrocarbon liftings from the company’s operations in Gabon and the UK. Also during the first quarter, Marathon’s production operations benefited from the restart of the Petronius platform in the Gulf of Mexico following extensive repairs necessitated by damage caused by Hurricane Ivan. Petronius came back online in early March, quickly ramping up to pre-Ivan levels of approximately 25,000 net boepd. In addition, the company’s condensate expansion project in Equatorial Guinea ramped up to full production, with total liquids production averaging approximately 47,000 gross barrels per day (bpd) for the quarter (26,500 net to Marathon), but exiting March at a rate of approximately 62,000 gross bpd (35,000 net to Marathon). Commissioning of the Equatorial Guinea LPG expansion project continued during the first quarter with start-up on schedule for mid-year. With the LPG expansion at full production, total Equatorial Guinea liquids production is expected to exceed 80,000 gross bpd. Sales volumes in Russia also improved during the quarter averaging approximately 24,000 bpd compared to approximately 16,000 bpd during the same period in 2004. The increase is a result of the East Kamennoye development program. In Norway, Marathon made progress in advancing the Alvheim development with the award of the two remaining major contracts for conversion of the MST Odin to a floating production, storage and offloading (FPSO) vessel. At this time, all the major contracts for the Alvheim development have been placed. MST Odin hull modifications have been initiated and development drilling will commence in the third quarter of 2005. Project development is on schedule with first production expected in 2007. In addition, the nearby Vilje field received PDO approval from the Norwegian Government. Vilje will be tied back to Alvheim and will also begin producing in 2007. Marathon also announced two discoveries in Angola during the quarter. The Palas-1 and Ceres-1 discoveries are both located on Block 31 offshore Angola and mark the fifth and sixth deepwater discoveries the company has announced on the Block. The Palas-1 and Ceres-1 wells are located approximately 37 and 20 miles southeast, respectively, of the planned Northeast Development Area and provide the potential for a second development area on Block 31. In addition, Marathon is currently participating in a well on the Juno Prospect. Marathon holds a 10 percent interest in Block 31. Marathon Oil Corporation Reports First Quarter 2005 Results page 3
  • 4. In the Gulf of Mexico, Marathon participated in the Stones well, in which it holds a 15 percent working interest, located on Walker Ridge Block 508. The well has reached total depth and encountered hydrocarbons in the Lower Tertiary section. Marathon and its partners are currently analyzing data from the well to determine next steps. Refining, Marketing and Transportation Downstream segment income was $210 million in first quarter 2005 versus segment income of $49 million in first quarter 2004. The improvement was primarily due to a higher refining and wholesale marketing margin and increased refinery throughputs. Marathon Ashland Petroleum LLC (MAP) benefited from wider sweet/sour crude differentials in general and was able to run more sour crudes during the period, taking advantage of the substantial discounts on these feedstocks. In addition, as a result of a relatively light maintenance schedule during the first quarter, MAP crude oil throughput was 17 percent higher than the same 2004 period. During the quarter MAP achieved record first quarter crude runs that averaged 922,200 bpd, with total throughput averaging a first quarter record of 1,093,600 bpd. This strong operating performance positioned the company to help meet rising demand for motor fuels, while capturing the benefits of the strong refining margins in the Midwest and Gulf Coast during the quarter. During the first quarter, MAP recorded a $73 million charge for crack spread derivative contracts, approximately $61 million of which related to mark-to-market losses on derivative contracts primarily for #2 high sulfur fuel oil crack spreads that expire over the remainder of 2005. 1st Quarter Ended March 31 2005 2004 Key Refining, Marketing & Transportation Statistics Crude Oil Refined (mbpd) 922.2 788.6 171.4 196.2 Other Charge and Blend Stocks (mbpd) Total Refinery Inputs (mbpd) 1,093.6 984.8 Refined Product Sales Volumes (mbpd) 1,369.7 1,307.3 Refining and Wholesale Marketing Margin ($/gallon) $0.0685 $0.0344 During the quarter, Speedway SuperAmerica LLC (SSA) continued to realize strong same store merchandise sales with an increase of approximately 11.5 percent. SSA also increased same store gasoline sales volume by 1.2 percent when compared to the first quarter of 2004. MAP continued to make progress on its Detroit refinery expansion project during the quarter. This $300 million project, which remains on schedule for completion during the fourth quarter of this year, will increase the refinery’s crude processing capacity from 74,000 bpd to 100,000 bpd and enable it to meet the Federal Tier II low-sulfur fuels regulations which become fully effective in 2006. MAP also announced an agreement with Motiva Enterprises LLC to purchase a terminal in Ft. Lauderdale, Florida. The 388,000 barrel light product terminal will increase MAP's storage capacity at Ft. Lauderdale by more than 70 percent, enabling MAP to better serve the growing Florida market, improve logistics, and add flexibility to its product sourcing. The transaction is expected to close in June 2005. Marathon Oil Corporation Reports First Quarter 2005 Results page 4
  • 5. Integrated Gas Integrated gas segment income was $7 million in first quarter 2005 compared with $15 million in first quarter 2004. The decrease was due to mark-to-market changes in the value of derivatives used to support gas marketing activities, partially offset by increased earnings from Marathon’s equity investment in the AMPCO methanol plant in Equatorial Guinea. During the first quarter, the methanol plant operated at a 94 percent on-stream factor and prices have remained strong averaging nearly $260 per ton during the quarter. Marathon’s integrated gas activities during the quarter were marked by continued progress in constructing the company’s LNG project in Equatorial Guinea. Project expenditures totaled approximately $675 million as of March 31, 2005. Construction remains on schedule with first shipments of LNG expected in late 2007. Also during the quarter, Marathon took delivery of two cargos of LNG under its long term delivery rights at the Elba Island (Georgia) regasification terminal. In the second half of 2005, the company will begin taking delivery of LNG at Elba Island under terms of a supply agreement reached with BP Energy Company last year under which BP will supply Marathon with 58 billion cubic feet of natural gas per year, as LNG, for a minimum period of five years. Following the successful demonstration of GTL technology at Marathon’s and Syntroleum Corporation’s Port of Catoosa (Oklahoma) GTL facility last year, Marathon intends to further develop this important technology through an Integrated Technology Project (ITP). The ITP, also at the Port of Catoosa, will combine higher efficiency syngas processing and liquid products treatment with the Syntroleum FT reactor. This project will build upon last year’s successful demonstration with the objective of producing ultra-clean, low-sulfur fuels from stranded and flared natural gas at a range of economic plant sizes. Marathon and its partners have been advised by Qatar’s Energy Minister that the company’s proposed Qatar GTL project will be delayed. The principal reason for the delay is Qatar Petroleum’s desire to ensure that they manage the giant North Field gas resources in the most effective manner and they are currently reviewing their long-term gas production delivery plans. In addition, they are examining the industry’s capacity to manage the design and construction of the large number of gas projects in a compressed time frame in a single location, which Marathon believes to be a reasonable and responsible approach. Despite this delay, Marathon remains committed to fully exploring the potential of GTL technology. Additionally, the company continues to examine a variety of gas projects to apply the company’s GTL technology package, as well as compressed natural gas and methanol processes which are ready for commercial application. The company will conduct a conference call today, April 28, 2005, at 2 p.m. EDT during which it will discuss first quarter results, as well as the modified agreement Marathon and Ashland Inc. have reached regarding Marathon’s purchase of Ashland’s interest in MAP announced earlier this morning. To listen to the Web cast of the conference call, visit the Marathon Web site at www.marathon.com. Replays of the Web cast will be available through May 12, 2005. Quarterly financial and operational information is also provided on Marathon’s Web site at http://www.marathon.com/Investor_Center/Investor_Relations/ in the Quarterly Investor Packet. - xxx - In addition to net income determined in accordance with generally accepted accounting principles (GAAP), Marathon has provided supplementally “net income adjusted for special items”, a non-GAAP financial measure which facilitates comparisons to earnings forecasts prepared by stock analysts and other third parties. Such forecasts generally exclude the effects of items that are difficult to predict or to measure in advance and are not directly related to Marathon's ongoing operations. A reconciliation between GAAP net income and “net Marathon Oil Corporation Reports First Quarter 2005 Results page 5
  • 6. income adjusted for special items” is provided in a table on page 1. “Net income adjusted for special items” should not be considered a substitute for net income as reported in accordance with GAAP. Management, as well as certain investors, uses “net income adjusted for special items” to evaluate Marathon's financial performance between periods. Management also uses “net income adjusted for special items” to compare Marathon's performance to certain competitors. This release contains forward-looking statements with respect to the timing and levels of the company’s worldwide liquid hydrocarbon and natural gas and condensate production and sales, future exploration and drilling activity, the Alvheim/Vilje development, an LPG expansion project, a LNG project, the Detroit refinery expansion project, and the proposed acquisition of a Ft. Lauderdale terminal. Some factors that could potentially affect worldwide liquid hydrocarbon and natural gas and condensate production and sales, the exploration and drilling activities and the Alvheim/Vilje development include pricing, supply and demand for petroleum products, amount of capital available for exploration and development, occurrence of acquisitions/dispositions of oil and gas properties, regulatory constraints, timing of commencing production from new wells, drilling rig availability, unforeseen hazards such as weather conditions, acts of war or terrorist acts and the governmental or military response thereto, and other geological, operating and economic considerations. Some factors that could affect the LPG expansion project include unforeseen problems arising from construction and unforeseen hazards such as weather conditions. Factors that could affect the LNG project include unforeseen problems arising from construction, inability or delay in obtaining necessary government and third party approvals, unanticipated changes in market demand or supply, environmental issues, availability or construction of sufficient LNG vessels, and unforeseen hazards such as weather conditions. The Detroit refinery expansion project could be affected by unforeseen problems arising from construction, availability of materials and labor, and unforeseen hazards such as weather conditions. Factors that could affect the acquisition of the terminal include satisfaction of closing conditions. The foregoing factors (among others) could cause actual results to differ materially from those set forth in the forward-looking statements. In accordance with the quot;safe harborquot; provisions of the Private Securities Litigation Reform Act of 1995, Marathon Oil Corporation has included in its Annual Report on Form 10-K for the year ended December 31, 2004 and subsequent Forms 8-K, cautionary language identifying other important factors, though not necessarily all such factors, that could cause future outcomes to differ materially from those set forth in the forward-looking statements. Media Relations Contact: Paul Weeditz 713-296-3910 Investor Relations Contacts: Ken Matheny 713-296-4114 Howard Thill 713-296-4140 Marathon Oil Corporation Reports First Quarter 2005 Results page 6
  • 7. Condensed Consolidated Statement of Income (unaudited) 1st Quarter Ended March 31 (Dollars in millions, except per diluted share data) 2005 2004 Revenues and Other Income: Sales and other operating revenues (including consumer excise taxes) $9,840 $8,392 Revenue from matching buy/sell transactions 2,809 2,045 Sales to related parties 283 215 Income from equity method investments 40 27 Net gains on disposal of assets 11 2 Other income 27 12 Total revenues and other income 13,010 10,693 Costs and Expenses: Cost of revenues (excludes items shown below) 7,692 6,435 Purchases related to matching buy/sell transactions 2,832 2,065 Purchases from related parties 56 31 Consumer excise taxes 1,084 1,052 Depreciation, depletion and amortization 323 299 Selling, general and administrative expenses 260 222 Other taxes 105 83 Exploration expenses 34 28 Total costs and expenses 12,386 10,215 Income from Operations 624 478 Net interest and other financial costs 32 38 Minority interest in income (loss) of: Marathon Ashland Petroleum LLC 70 17 Equatorial Guinea LNG Holdings Limited (1) — Income before Income Taxes 523 423 Provision for income taxes 199 165 Net Income $324 $258 Net income Per share - basic $0.94 $0.83 Per share - diluted $0.93 $0.83 Dividends paid per share $0.28 $0.25 Weighted average shares, in thousands Basic 346,006 310,196 Diluted 348,645 311,685 Marathon Oil Corporation Reports First Quarter 2005 Results page 7
  • 8. Preliminary Supplemental Statistics (unaudited) 1st Quarter Ended March 31 (Dollars in millions, except as noted) 2005 2004 Income from Operations Exploration & Production United States $305 $306 250 158 International E&P Segment Income 555 464 Refining, Marketing & Transportation(a) 210 49 7 15 Integrated Gas(b) Segment Income $772 $528 Items not allocated to segments: Administrative Expenses $(91) $(64) (57) 14 Gain (loss) on U.K. long-term gas contracts Income From Operations $624 $478 Capital Expenditures Exploration & Production $293 $172 Refining, Marketing & Transportation(a) 134 135 Integrated Gas(b) 126 35 1 2 Corporate Total $554 $344 Exploration Expense United States $17 $8 17 17 International Total $34 $25 Operating Statistics Liquid Hydrocarbon Sales (mbpd)(c) United States 71.6 91.8 Europe 31.2 45.0 Other International 24.1 16.1 36.2 31.0 West Africa 91.5 92.1 Total International 163.1 183.9 Worldwide Natural Gas Sales (mmcfd)(c)(d) United States 570.3 701.4 Europe 371.8 358.6 83.4 76.3 West Africa 455.2 434.9 Total International 1,025.5 1,136.3 Worldwide Total Sales (mboepd) 334.0 373.3 Marathon Oil Corporation Reports First Quarter 2005 Results page 8
  • 9. Preliminary Supplemental Statistics (unaudited) (continued) 1st Quarter Ended March 31 (Dollars in millions, except as noted) 2005 2004 Operating Statistics (continued) Average Sales Prices (excluding derivative gains and losses) Liquid Hydrocarbons ($ per bbl) United States $38.47 $29.74 Europe 45.34 31.10 Other International 24.79 17.71 West Africa 43.23 29.48 Total International 39.10 28.22 Worldwide $38.82 $28.98 Natural Gas ($ per mcf) United States $4.95 $4.71 Europe 5.05 4.14 West Africa .24 .24 Total International 4.17 3.46 Worldwide $4.60 $4.23 Average Sales Prices (including derivative gains and losses) Liquid Hydrocarbons ($ per bbl) United States $38.47 $28.09 Europe 45.34 30.11 Other International 24.79 17.59 West Africa 43.23 29.48 Total International 39.10 27.71 Worldwide $38.82 $27.90 Natural Gas ($ per mcf) United States $4.92 $4.66 Europe(e) 5.05 4.14 West Africa .24 .24 Total International 4.17 3.46 Worldwide $4.59 $4.20 Marathon Oil Corporation Reports First Quarter 2005 Results page 9
  • 10. Preliminary Supplemental Statistics (unaudited) (continued) 1st Quarter Ended March 31 (Dollars in millions, except as noted) 2005 2004 MAP Refinery Runs (mbpd) Crude Oil Refined 922.2 788.6 171.4 196.2 Other Charge and Blend Stocks Total 1,093.6 984.8 Refined Product Yields(mbpd) Gasoline 576.3 552.2 Distillates 291.5 234.8 Propane 19.2 19.8 Feedstocks and Special Products 116.4 108.0 Heavy Fuel Oil 32.8 26.8 72.0 57.0 Asphalt Total 1,108.2 998.6 (f) Refined Product Sales Volumes(mbpd) 1,369.7 1,307.3 Matching buy/sell volumes included in refined product sales volumes (mbpd) 80.3 79.6 (g)(h) Refining and Wholesale Marketing Margin $0.0685 $0.0344 Speedway SuperAmerica LLC Number of SSA retail outlets 1,659 1,773 SSA Gasoline and Distillate Sales(i) 745 763 SSA Gasoline and Distillate Gross Margin(g) $0.1058 $0.1145 SSA Merchandise Sales $560 $521 SSA Merchandise Gross Margin $143 $132 (a) Includes MAP at 100%. RM&T segment income includes Ashland’s 38% interest in MAP of $76 million and $18 million in the first quarter 2005 and 2004. (b) Includes Equatorial Guinea LNG Holdings at 100%. (c) Amounts reflect sales after royalties, excluding the U.K. and Ireland where amounts are before royalties. (d) Includes gas acquired for injection and subsequent resale of 20.5 mmcfd and 22.0 mmcfd in the first quarter 2005 and 2004. (e) Excludes the effects of the U.K. long-term gas contracts that are accounted for as derivatives. (f) Total average daily volumes of all refined product sales to MAP’s wholesale, branded and retail (SSA) customers. (g) Per gallon (h) Sales revenue less cost of refinery inputs, purchased products and manufacturing expenses, including depreciation. (i) Millions of gallons Marathon Oil Corporation Reports First Quarter 2005 Results page 10