1. DESCRIPTION OF BUSINESS
Ecolab is the global leader in cleaning, sanitizing, food safety and infection control products and services. Founded
in 1923 and headquartered in St. Paul, Minn., Ecolab has been partnering with customers for more than 80 years.
Ecolab serves customers in more than 160 countries across North America, Europe, Asia Pacific, Latin America,
the Middle East and Africa, and employs more than 26,000 associates worldwide. Ecolab delivers comprehensive
programs and services to the foodservice, food and beverage processing, hospitality, healthcare, government and
education, retail, textile care, commercial facilities, and vehicle wash industries.
Ecolab is committed to assisting customers worldwide with their unique needs by providing them with
comprehensive, value-added solutions and professional, personal service. With more than 14,000 sales-and-
service experts, Ecolab employs the industry’s largest and best-trained direct sales-and-service force, which
advises and assists customers in meeting a full range of cleaning, sanitation and service needs. For more
information, visit www.ecolab.com or call 1.800.2.ECOLAB.
Ecolab common stock is traded on the New York Stock Exchange under the symbol ECL. Ecolab news releases and
other selected investor information are available at www.ecolab.com.
FORWARD-LOOKING STATEMENTS AND RISK FACTORS
We refer readers to the company’s disclosure, entitled “Forward-Looking Statements and Risk Factors,”
which is located on page 27 of this Annual Report.
BUSINESS MIX 2007
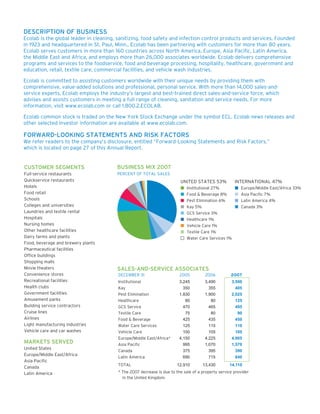
CUSTOMER SEGMENTS
Full-service restaurants PERCENT OF TOTAL SALES
Quickservice restaurants UNITED STATES 53% INTERNATIONAL 47%
Hotels Institutional 27% Europe/Middle East/Africa 33%
Food retail Food & Beverage 8% Asia Pacific 7%
Schools Pest Elimination 6% Latin America 4%
Colleges and universities Kay 5% Canada 3%
Laundries and textile rental GCS Service 3%
Hospitals Healthcare 1%
Nursing homes Vehicle Care 1%
Other healthcare facilities Textile Care 1%
Dairy farms and plants Water Care Services 1%
Food, beverage and brewery plants
Pharmaceutical facilities
Office buildings
Shopping malls
Movie theaters SALES-AND-SERVICE ASSOCIATES
Convenience stores DECEMBER 31 2005 2006 2007
Recreational facilities Institutional 3,245 3,490 3,500
Health clubs Kay 350 355 405
Government facilities Pest Elimination 1,830 1,900 2,025
Amusement parks Healthcare 80 80 125
Building service contractors GCS Service 470 465 495
Cruise lines Textile Care 75 80 90
Airlines Food & Beverage 425 435 450
Light manufacturing industries Water Care Services 125 115 110
Vehicle care and car washes Vehicle Care 100 105 105
Europe/Middle East/Africa* 4,150 4,225 4,005
MARKETS SERVED Asia Pacific 995 1,070 1,570
United States
Canada 375 395 390
Europe/Middle East/Africa
Latin America 690 715 840
Asia Pacific
TOTAL 12,910 13,430 14,110
Canada
* The 2007 decrease is due to the sale of a property service provider
Latin America
in the United Kingdom.
2. NET SALES NET INCOME DILUTED NET INCOME DIVIDENDS DECLARED
DOLLARS IN MILLIONS DOLLARS IN MILLIONS PER SHARE PER SHARE
DOLLARS DOLLARS
$1.70
$0.4750
$427
$5,470
$4,896
$0.4150
$369
$1.43
$4,535
$319
$4,185
$0.3625
$1.23
$0.3275
$3,762
$283
$1.09
$261
$0.2975
$0.99
03 04 07 03 04 07 03 04 07 03 04 07
05 06 05 06 05 06 05 06
FINANCIAL HIGHLIGHTS PERCENT CHANGE
2007 2006 2005 2007 2006
MILLIONS, EXCEPT PER SHARE
Net Sales $4,895.8 $4,534.8 8%
$5,469.6 12%
Net Income 368.6 319.5 15
427.2 16
Percent of Sales 7.5% 7.0%
7.8%
Diluted Net Income Per Common Share 1.43 1.23 16
1.70 19
Diluted Weighted-Average Common Shares Outstanding 257.1 260.1 (1)
251.8 (2)
Dividends Declared Per Common Share 0.4150 0.3625 14
0.4750 14
Cash Provided by Operating Activities 627.6 590.1 6
797.6 27
Capital Expenditures 287.9 268.8 7
306.5 6
Shareholders’ Equity 1,680.2 1,649.2 2
1,935.7 15
Return on Beginning Equity 22.4% 20.0%
25.4%
Total Debt 1,066.1 746.3 43
1,003.4 (6)
Total Debt to Capitalization 38.8% 31.2%
34.1%
Total Assets $4,419.4 $3,796.6 16%
$4,722.8 7%
ECOLAB STOCK PERFORMANCE ECOLAB STOCK PERFORMANCE COMPARISON
2005 2006 2007
• Ecolab Stock Price Index, Dec. 31, 2004 = 1.00
$55
• Ecolab Stock Price 31, 2004 = 1.00
ECOLAB, S&P 500 INDICES
1.55
QUARTER LOW HIGH LOW HIGH LOW HIGH
• S&P 500 Index, Dec.
ECOLAB STOCK PRICE
$50 1.45
First $31.20 $35.08 $33.64 $40.50 $37.01 $45.37
Second 30.68 34.23 37.00 41.20 41.12 44.79 1.35
$45
Third 30.75 34.14 39.57 45.43 39.01 47.59
1.25
Fourth 30.93 37.15 42.17 46.40 44.82 52.78
$40 1.15
1.05
$35
0.95
$30 0.85
4Q 1Q 2Q 3Q 4Q 1Q 2Q 3Q 4Q 1Q 2Q 3Q 4Q
2004 2005 2006 2007