( Jasmin ) Top VIP Escorts Service Dindigul 💧 7737669865 💧 by Dindigul Call G...
monsanto Q32006EarningsRelease
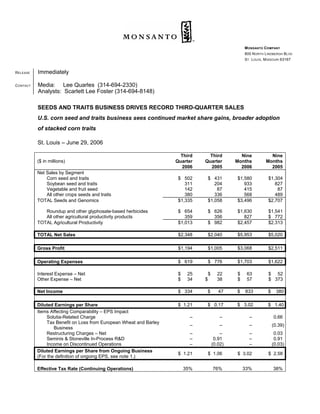
1. MONSANTO COMPANY
800 NORTH LINDBERGH BLVD
ST. LOUIS, MISSOURI 63167
Immediately
RELEASE
Media: Lee Quarles (314-694-2330)
CONTACT
Analysts: Scarlett Lee Foster (314-694-8148)
SEEDS AND TRAITS BUSINESS DRIVES RECORD THIRD-QUARTER SALES
U.S. corn seed and traits business sees continued market share gains, broader adoption
of stacked corn traits
St. Louis – June 29, 2006
Third Third Nine Nine
($ in millions) Quarter Quarter Months Months
2006 2005 2006 2005
Net Sales by Segment
Corn seed and traits $ 502 $ 431 $1,580 $1,304
Soybean seed and traits 311 204 933 827
Vegetable and fruit seed 142 87 415 87
All other crops seeds and traits 380 336 568 489
TOTAL Seeds and Genomics $1,335 $1,058 $3,496 $2,707
Roundup and other glyphosate-based herbicides $ 654 $ 626 $1,630 $1,541
All other agricultural productivity products 359 356 827 $ 772
TOTAL Agricultural Productivity $1,013 $ 982 $2,457 $2,313
$5,953
$2,348 $2,040 $5,020
TOTAL Net Sales
$3,068
$1,194 $1,005 $2,511
Gross Profit
$1,703
$ 619 $ 776 $1,622
Operating Expenses
Interest Expense – Net $ 25 $ 22 $ 63 $ 52
Other Expense – Net $ 34 $ 38 $ 57 $ 373
$ 833
$ 334 $ 47 $ 380
Net Income
$ 3.02
$ 1.21 $ 0.17 $ 1.40
Diluted Earnings per Share
Items Affecting Comparability – EPS Impact
Solutia-Related Charge – – – 0.66
Tax Benefit on Loss from European Wheat and Barley
– – – (0.39)
Business
Restructuring Charges – Net – – – 0.03
Seminis & Stoneville In-Process R&D – 0.91 – 0.91
Income on Discontinued Operations – (0.02) – (0.03)
Diluted Earnings per Share from Ongoing Business
$ 1.21 $ 1.06 $ 3.02 $ 2.58
(For the definition of ongoing EPS, see note 1.)
33%
35% 76% 38%
Effective Tax Rate (Continuing Operations)
2. Third Third Nine Nine
Comparison as a Percent of Net Sales: Quarter Quarter Months Months
2006 2005 2006 2005
Gross profit 51% 49% 52% 50%
Selling, general and administrative expenses (SG&A) 18% 18% 20% 19%
Research and development expenses (excluding
8% 8% 9% 8%
acquired in-process R&D)
Income from continuing operations before income
22% 8% 21% 9%
taxes
Net income 14% 2% 14% 8%
Comment from Monsanto Chairman, President and Chief Executive Officer Hugh Grant:
“Nothing says growth like raising the ceiling on what is possible, and that is exactly the trend we’ve seen
in the performance of our seeds and traits business up to this point in the year. This performance sets us
on the future trajectory for growth, and enhances our leadership position through the end of the decade.”
Market Conditions
The 2006 crop season is well under way throughout the Northern Hemisphere. In the United States, cool
temperatures in early spring provided open planting windows for the majority of the country’s corn, cotton
and soybean farmers. Currently, reports from the U.S. Department of Agriculture (USDA) note that the
majority of corn, cotton and soybean varieties have emerged. However, the lack of consistent moisture in
May has raised concerns for a dry season in the U.S. corn- and soybean-growing region. The USDA
currently estimates that corn was planted on 78 million acres, soybeans were planted on nearly 77 million
acres and cotton was planted on more than 14 million acres. Throughout Europe and Asia, farmers’ fields
are quickly approaching the mid-season point in this year’s crop cycle. In India, cotton farmers are
working to plant their cotton fields on the heels of this year’s monsoon season.
In the Southern Hemisphere, the harvest season is mostly complete. By late May, farmers in Argentina
were wrapping up this year’s harvest of corn and soybeans, both of which benefited from late-season
rains. Brazil soybean farmers completed their main harvest cycle in late April.
Operations Update
Monsanto reported record net sales of $2.3 billion for the third quarter of fiscal year 2006, which were
15 percent higher than sales in the same period in fiscal year 2005. Key drivers for the quarter were
increased seeds and traits revenues in the United States, primarily driven by higher revenues from the
company’s soybean business, and greater farmer adoption of the company’s corn products. Sales from
the company’s Seminis vegetable and fruit seed business, which was acquired in the third quarter of
fiscal year 2005, also contributed to the increase in the quarter. Results also benefited from higher sales
of Roundup and other glyphosate-based herbicides in the United States.
The company reported record net sales of $5.95 billion through the company’s first three quarters of fiscal
year 2006, which were 19 percent higher compared with sales in the first nine months of last year. Key
contributors to the company’s growth included higher U.S. corn seed and traits revenues, and stronger
purchases of Roundup herbicides in the United States and Argentina. Sales from the Seminis business
also contributed to the increase in the first nine months.
Monsanto reported net income of $334 million in the third quarter of fiscal year 2006, which was
significantly higher than the same period last year. The increase in net income for the third quarter related
to higher revenue from the company’s U.S. seeds and traits business, as well as a 2005 write-off of in-
process R&D related to the Seminis and Stoneville acquisitions. Net income of $833 million for the first
nine months of fiscal year 2006 was also significantly higher than the same period last year.
Earnings per share (EPS), both on an as-reported and ongoing basis, was $1.21 for the third quarter and
$3.02 for the first nine months of the 2006 fiscal year.
Page 2 of 10
3. Cash Flow
For the first nine months of fiscal year 2006, net cash provided by operating activities was $184 million,
compared with $533 million in the same period in 2005. Net cash required by investing activities was
$408 million for the first nine months of 2006, compared with net cash required of $1.4 billion for the
same period last year. As a result, free cash flow was a use of $224 million for the first nine months of
fiscal year 2006, compared with a use of $838 million in the same period in fiscal year 2005. (For a
reconciliation of free cash flow, see note 1.) Free cash flow in the first three quarters, when compared
with free cash in the same period last year, reflected lower spending on acquisitions which was partially
offset by increased working capital requirements, planned higher spending on capital expenditures as
well as lower proceeds from short-term securities. Net cash provided by financing activities was $294
million for the first nine months of 2006, compared with net cash provided of $268 million for the same
period last year.
Outlook
Monsanto confirmed that its full-year 2006 EPS guidance on an ongoing basis will be in the range of
$2.50 to $2.55. The company now expects that its full-year 2006 EPS guidance on an as-reported basis
will be in the range of $2.41 to 2.48, following a one-time tax charge associated with repatriated earnings.
The company expects to incur the charge in the fourth-quarter of fiscal year 2006. (For a reconciliation of
on-going EPS, see note 1.) The company also confirmed that its guidance for free cash flow in fiscal year
2006 remains in the range of $825 million to $900 million, with net cash provided by operating activities in
the range of $1.375 billion to $1.450 billion, and net cash required by investing activities of approximately
$550 million. EPS guidance does not reflect the company’s announced two-for-one stock split. (For a
reconciliation of free cash flow, see note 1.)
Page 3 of 10
4. Seeds and Genomics Segment Detail
($ in millions) Net Sales Gross Profit
Third Third Nine Nine Third Third Nine Nine
Seeds and Genomics Quarter Quarter Months Months Quarter Quarter Months Months
2006 2005 2006 2005 2006 2005 2006 2005
$ 502 $ 431 $1,580 $1,304 $257 $215 $ 948 $ 750
Corn seed and traits
311 204 933 827 203 115 655 564
Soybean seed and traits
142 87 415 87 72 42 221 42
Vegetable and fruit seed
380 336 568 489 287 240 390 313
All other crops seeds and traits
$1,335 $1,058 $3,496 $2,707 $819 $612 $2,214 $1,669
TOTAL Seeds and Genomics
($ in millions) Earnings Before Interest & Taxes (EBIT)
Third Third Nine Nine
Seeds and Genomics Quarter Quarter Months Months
2006 2005 2006 2005
EBIT (For a reconciliation of
$393 $4 $1,027 $510
EBIT, see note 1.)
Unusual Items Affecting EBIT
Seminis & Stoneville In-
None (248) None (248)
Process R&D
The Seeds and Genomics segment consists of the company’s global seeds and related traits business,
and genetic technology platforms.
Sales for Monsanto’s Seeds and Genomics segment were $1.3 billion for the third quarter of fiscal year
2006, or 26 percent higher than sales in the same period last year.
During the third quarter of fiscal year 2006, the company realized increased U.S. seeds and traits
revenue. Third-quarter results benefited from increased sales of the company’s U.S. soybean seed and
traits business, as well as higher sales of Monsanto’s corn seed products. The strong adoption of the
company’s corn seed and traits business in the United States contributed to a fifth consecutive year of
market share gains for Monsanto in the U.S. corn seed market.
Sales from the Seminis business also contributed to the favorable results in the third quarter. Sales
reported in the third quarter of the 2005 fiscal year were based only on Seminis sales from March 23,
2005, the date Monsanto acquired this business, to May 31, 2005, the close of the company’s third
quarter of fiscal year 2005.
Sales for the segment were also higher for the first nine months of the 2006 fiscal year compared with
sales in the same period last year. Segment sales through the first three quarters were $3.5 billion, or
29 percent higher when compared with segment sales from the same period in fiscal year 2005. The key
drivers for growth in the third quarter were also the primary contributors to growth in the first three
quarters of the fiscal year.
Page 4 of 10
5. Agricultural Productivity Segment Detail
($ in millions) Net Sales Gross Profit
Third Third Nine Nine Third Third Nine Nine
Agricultural Productivity Quarter Quarter Months Months Quarter Quarter Months Months
2006 2005 2006 2005 2006 2005 2006 2005
Roundup and other glyphosate-
$ 654 $626 $1,630 $1,541 $216 $241 $502 $529
based herbicides
All other agricultural
359 356 827 772 159 152 352 313
productivity products
$1,013 $982 $2,457 $2,313 $375 $393 $854 $842
TOTAL Agricultural Productivity
($ in millions) Earnings Before Interest & Taxes (EBIT)
Third Third Nine Nine
Agricultural Productivity Quarter Quarter Months Months
2006 2005 2006 2005
EBIT (For a reconciliation of
$147 $191 $280 $12
EBIT, see note 1.)
Unusual Items Affecting EBIT
Pre-tax charge associated
with certain liabilities in
None None None (284)
connection with the Solutia
bankruptcy
The Agricultural Productivity segment consists primarily of crop protection products, the lawn-and-garden
herbicide business, and the company’s animal agricultural business.
Sales for Monsanto’s Agricultural Productivity segment were $1 billion for the third quarter of fiscal year
2006, or 3 percent higher compared with sales in the same period last year. Higher sales of Roundup and
other glyphosate-based herbicides in the United States contributed to the increase in the third quarter.
Segment sales through the first three quarters were $2.5 billion or 6 percent higher than segment sales in
the same period of fiscal year 2005. Increased volumes and prices of Roundup herbicides in the United
States contributed to growth through the first nine months of the fiscal year. Segment sales in the first
nine months also benefited from increased sales from the company’s selective chemistry and dairy
businesses.
Gross profit for the segment in the third quarter was affected by higher raw material and energy costs for
production of Roundup and other glyphosate-based herbicides, as well as higher operating costs in Brazil
associated with a stronger Real.
Webcast Information
In conjunction with this announcement, Monsanto will hold a conference call at 8 a.m. central time (9 a.m.
eastern time) today. The call will focus on these results and future expectations. The call may also
include a discussion of Monsanto’s strategic initiatives, product performance and other matters related to
the company’s business.
As part of today’s announcement, Monsanto also published a preliminary report on the company’s
biotech trait acreage for fiscal year 2006. This report is available on Monsanto’s web site.
Presentation slides and a simultaneous audio webcast of the conference call may be accessed by visiting
the company’s web site at www.monsanto.com and clicking on “Investor Information.” Visitors may need
to download Windows Media Player™ prior to listening to the webcast. Following the live broadcast, a
replay of the webcast will be available on the Monsanto web site for three weeks.
Page 5 of 10
6. About Monsanto Company
Monsanto Company is a leading global provider of technology-based solutions and agricultural products
that improve farm productivity and food quality. For more information on Monsanto, see
www.monsanto.com.
-oOo-
Cautionary Statements Regarding Forward-Looking Information:
Certain statements contained in this release are quot;forward-looking statements,quot; such as statements
concerning the company's anticipated financial results, current and future product performance,
regulatory approvals, business and financial plans and other non-historical facts. These statements are
based on current expectations and currently available information. However, since these statements are
based on factors that involve risks and uncertainties, the company's actual performance and results may
differ materially from those described or implied by such forward-looking statements. Factors that could
cause or contribute to such differences include, among others: continued competition in seeds, traits and
agricultural chemicals; the company's exposure to various contingencies, including those related to
intellectual property protection, regulatory compliance and the speed with which approvals are received,
and public acceptance of biotechnology products; the success of the company's research and
development activities; the outcomes of major lawsuits, including proceedings related to Solutia Inc.;
developments related to foreign currencies and economies; successful completion and operation of
recent and proposed acquisitions; fluctuations in commodity prices; compliance with regulations affecting
our manufacturing; the accuracy of the company's estimates related to distribution inventory levels; the
company's ability to fund its short-term financing needs and to obtain payment for the products that it
sells; the effect of weather conditions, natural disasters and accidents on the agriculture business or the
company's facilities; and other risks and factors detailed in the company's filings with the SEC. Undue
reliance should not be placed on these forward-looking statements, which are current only as of the date
of this release. The company disclaims any current intention or obligation to update any forward-looking
statements or any of the factors that may affect actual results.
Notes to editors: Roundup is a registered trademark owned by Monsanto Company and its wholly owned
subsidiaries.
References to “Roundup herbicides” in this release mean Roundup branded herbicides, excluding lawn-
and-garden herbicide products, and references to “Roundup and other glyphosate-based herbicides”
exclude all lawn-and-garden herbicides.
Page 6 of 10
7. Monsanto Company
Selected Financial Information
(Dollars in millions, except per share amounts)
Unaudited
Statements of Consolidated Operations Three Months Three Months Nine Months Nine Months
Ended Ended Ended Ended
May 31, 2006 May 31, 2005 May 31, 2006 May 31, 2005
Net Sales $2,348 $2,040 $5,953 $5,020
Cost of Goods Sold 1,154 1,035 2,885 2,509
Gross Profit 1,194 1,005 3,068 2,511
Operating Expenses:
Selling, General and Administrative Expenses 430 367 1,173 947
Research and Development Expenses 191 155 532 401
Acquired In-Process Research and Development — 254 — 266
Restructuring Charges (Reversals) – Net (2) — (2) 8
Total Operating Expenses 619 776 1,703 1,622
Income From Operations 575 229 1,365 889
Interest Expense 35 29 100 78
Interest Income (10) (7) (37) (26)
Solutia-Related Expenses 7 7 20 300
Other Expense – Net 27 31 37 73
Income From Continuing Operations Before
Income Taxes 516 169 1,245 464
Income Tax Provision 128 412 178
182
Income From Continuing Operations 334 41 833 286
Discontinued Operations:
Income (Loss) From Operations of Discontinued
Businesses (1) 4 (1) 6
Income Tax Benefit (1) (2) (1) (88)
Income on Discontinued Operations — 6 — 94
Net Income $ 334 $ 47 $ 833 $ 380
EBIT (See note 1) $ 540 $ 195 $1,307 $ 522
Basic Earnings per Share:
Income From Continuing Operations $ 1.23 $ 0.16 $ 3.09 $ 1.08
Income on Discontinued Operations — 0.02 — 0.35
Net Income $ 1.23 $ 0.18 $ 3.09 $ 1.43
Diluted Earnings per Share:
Income From Continuing Operations $ 1.21 $ 0.15 $ 3.02 $ 1.05
Income on Discontinued Operations — 0.02 — 0.35
Net Income $ 1.21 $ 0.17 $ 3.02 $ 1.40
Weighted Average Shares Outstanding:
Basic 270.8 268.0 269.6 266.4
Diluted 276.1 273.8 275.5 272.3
Page 7 of 10
8. Monsanto Company
Selected Financial Information
(Dollars in millions)
Unaudited
Condensed Statements of Consolidated Financial Position As of As of
May 31, 2006 Aug. 31, 2005
Assets
Current Assets:
Cash and Cash Equivalents $ 595 $ 525
Short-Term Investments 22 150
Trade Receivables – Net of Allowances of $303 and $275,
respectively 2,899 1,473
Miscellaneous Receivables 350 370
Deferred Tax Assets 339 374
Inventories 1,700 1,664
Assets of Discontinued Operations 10 15
Other Current Assets 76 73
Total Current Assets 5,991 4,644
Property, Plant and Equipment – Net 2,331 2,378
Goodwill 1,467 1,248
Other Intangible Assets – Net 1,239 1,153
Noncurrent Deferred Tax Assets 582 680
Other Assets 499 476
Total Assets $12,109 $10,579
Liabilities and Shareowners’ Equity
Current Liabilities:
Short-Term Debt $ 666 $ 126
Accounts Payable 454 525
Income Taxes Payable 284 208
Accrued Compensation and Benefits 208 273
Accrued Marketing Programs 470 457
Deferred Revenues 50 43
Grower Accruals 30 18
Liabilities of Discontinued Operations 4 11
Miscellaneous Short-Term Accruals 589 498
Total Current Liabilities 2,755 2,159
1,376 1,458
Long-Term Debt
740 732
Postretirement Liabilities
164 184
Long-Term Portion of Solutia-Related Reserve
498 433
Other Liabilities
6,576 5,613
Shareowners’ Equity
Total Liabilities and Shareowners’ Equity $12,109 $10,579
24% 22%
Debt to Capital Ratio:
Page 8 of 10
9. Monsanto Company
Selected Financial Information
(Dollars in millions)
Unaudited
Statements of Consolidated Cash Flows Nine Months Nine Months
Ended Ended
May 31, 2006 May 31, 2005
Operating Activities:
Net Income $ 833 $ 380
Adjustments to Reconcile Cash Provided (Required) by Operations:
Items That Did Not Require (Provide) Cash:
Depreciation and Amortization Expense 386 348
Bad-Debt Expense 40 36
Stock-Based Compensation Expense 47 —
Tax Benefit on Employee Stock Options — 67
Excess Tax Benefits from Stock-Based Compensation (81) —
Deferred Income Taxes 159 (90)
Equity Affiliate Expense – Net 21 20
Acquired In-Process Research and Development — 266
Solutia-Related Charge — 284
Other Items That Did Not Require Cash 30 53
Changes in Assets and Liabilities That Provided (Required) Cash, Net o
Acquisitions:
Trade Receivables (1,368) (917)
Inventories (51) (10)
Accounts Payable and Accrued Liabilities 176 156
PCB Litigation Settlement Insurance Proceeds 21 9
Solutia-Related Payments (23) (36)
Other Items (6) (33)
Net Cash Provided by Operating Activities 184 533
Cash Flows Provided (Required) by Investing Activities:
Purchases of Short-Term Investments (21) —
Maturities of Short-Term Investments 150 300
Capital Expenditures (234) (144)
Acquisitions of Businesses, Net of Cash Acquired (185) (1,506)
Technology and Other Investments (128) (44)
Other Investment and Property Disposal Proceeds 10 23
Net Cash Required by Investing Activities (408) (1,371)
Cash Flows Provided (Required) by Financing Activities:
Net Change in Financing With Less Than 90-Day Maturities 448 1,154
Short-Term Debt Proceeds 6 38
Short-Term Debt Reductions (26) (18)
Long-Term Debt Proceeds 4 16
Long-Term Debt Reductions (78) (288)
Payments on Debt Assumed in Seminis Acquisition — (495)
Payments on Other Financing (5) (5)
Treasury Stock Purchases (87) (149)
Stock Option Exercises 105 144
Excess Tax Benefits From Stock-Based Compensation 81 —
Dividend Payments (154) (129)
Net Cash Provided by Financing Activities 294 268
Net Increase (Decrease) in Cash and Cash Equivalents 70 (570)
Cash and Cash Equivalents at Beginning of Period 525 1,037
Cash and Cash Equivalents at End of Period $ 595 $ 467
Page 9 of 10
10. Monsanto Company
Selected Financial Information
(Dollars in millions)
Unaudited
1. EBIT, Ongoing EPS and Free Cash Flow: The presentations of EBIT, ongoing EPS and free cash flow are
not intended to replace net income (loss), cash flows, financial position or comprehensive income (loss), and
they are not measures of financial performance as determined in accordance with generally accepted
accounting principles (GAAP) in the United States. The following tables reconcile EBIT, ongoing EPS and
free cash flow to the respective most directly comparable financial measure calculated in accordance with
GAAP.
Reconciliation of EBIT to Net Income (Loss): EBIT is defined as earnings (loss) before interest and taxes.
Earnings (loss) is intended to mean net income (loss) as presented in the Statements of Consolidated
Operations under GAAP. The following table reconciles EBIT to the most directly comparable financial
measure, which is net income (loss).
Three Months Ended Nine Months Ended
May 31, May 31,
2006 2005 2006 2005
EBIT – Seeds and Genomics Segment $ 393 $4 $1,027 $ 510
EBIT – Agricultural Productivity Segment 147 191 280 12
EBIT– Total 540 195 1,307 522
Interest Expense – Net 25 22 63 52
Income Tax Provision(1) 181 126 411 90
Net Income $ 334 $ 47 $ 833 $ 380
(1)
Includes the income tax provision from continuing operations and the income tax benefit on
discontinued operations.
Reconciliation of Ongoing EPS to EPS: Ongoing EPS is calculated excluding certain after-tax items
which Monsanto does not consider part of ongoing operations. The reconciliation of EPS to ongoing EPS for
the third quarter and first nine months of fiscal years 2006 and 2005 is included on page 1 of this release.
Fourth Quarter Fiscal Year
2006 2006
Target Target
Diluted Earnings (Loss) per Share $(0.56) - $(0.59) $2.41 - $2.48
Tax Charge on Repatriated Earnings $0.07 - $0.09 $0.07 - $0.09
Diluted Earnings (Loss) per Share from Ongoing
Business $(0.47) - $(0.52) $2.50 - $2.55
Reconciliation of Free Cash Flow: Free cash flow represents the total of cash flows from operating
activities and investing activities, as reflected in the Statements of Consolidated Cash Flows presented in
this release. With respect to the projected free cash flow guidance provided under the caption “Outlook,”
Monsanto does not include any estimates or projections of Net Cash Provided (Required) by Financing
Activities because in order to prepare any such estimate or projection, Monsanto would need to rely on
market factors and conditions that are outside of its control.
Fiscal Year Nine Months Ended
2006 May 31,
Target 2006 2005
$1,375 - $1,450 $ 184 $ 533
Net Cash Provided by Operating Activities
Net Cash Required by Investing Activities (550) (408) (1,371)
Free Cash Flow $825 - $900 $(224) $ (838)
Net Cash Provided (Required) by Financing Activities N/A 294 268
Net Increase in Cash and Cash Equivalents N/A $ 70 $ (570)
Cash and Cash Equivalents at Beginning of Period N/A $1,037
$ 525
Cash and Cash Equivalents at End of Period N/A $ 467
$ 595
Page 10 of 10