Consolidated Report on Second Quarter 2008 Earnings
1. Consolidated Report to the Financial Community
Second Quarter 2008
(Released August 1, 2008) (Unaudited)
HIGHLIGHTS 2nd Qtr.
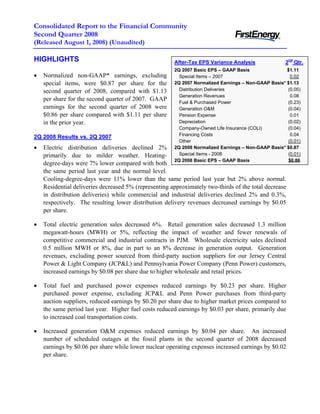
After-Tax EPS Variance Analysis
2Q 2007 Basic EPS – GAAP Basis $1.11
• Normalized non-GAAP* earnings, excluding Special Items – 2007 0.02
special items, were $0.87 per share for the 2Q 2007 Normalized Earnings – Non-GAAP Basis* $1.13
Distribution Deliveries (0.05)
second quarter of 2008, compared with $1.13
Generation Revenues 0.08
per share for the second quarter of 2007. GAAP Fuel & Purchased Power (0.23)
earnings for the second quarter of 2008 were Generation O&M (0.04)
$0.86 per share compared with $1.11 per share Pension Expense 0.01
Depreciation (0.02)
in the prior year.
Company-Owned Life Insurance (COLI) (0.04)
Financing Costs 0.04
2Q 2008 Results vs. 2Q 2007
Other (0.01)
• Electric distribution deliveries declined 2% 2Q 2008 Normalized Earnings – Non-GAAP Basis* $0.87
Special Items - 2008 (0.01)
primarily due to milder weather. Heating-
2Q 2008 Basic EPS – GAAP Basis $0.86
degree-days were 7% lower compared with both
the same period last year and the normal level.
Cooling-degree-days were 11% lower than the same period last year but 2% above normal.
Residential deliveries decreased 5% (representing approximately two-thirds of the total decrease
in distribution deliveries) while commercial and industrial deliveries declined 2% and 0.3%,
respectively. The resulting lower distribution delivery revenues decreased earnings by $0.05
per share.
• Total electric generation sales decreased 6%. Retail generation sales decreased 1.3 million
megawatt-hours (MWH) or 5%, reflecting the impact of weather and fewer renewals of
competitive commercial and industrial contracts in PJM. Wholesale electricity sales declined
0.5 million MWH or 8%, due in part to an 8% decrease in generation output. Generation
revenues, excluding power sourced from third-party auction suppliers for our Jersey Central
Power & Light Company (JCP&L) and Pennsylvania Power Company (Penn Power) customers,
increased earnings by $0.08 per share due to higher wholesale and retail prices.
• Total fuel and purchased power expenses reduced earnings by $0.23 per share. Higher
purchased power expense, excluding JCP&L and Penn Power purchases from third-party
auction suppliers, reduced earnings by $0.20 per share due to higher market prices compared to
the same period last year. Higher fuel costs reduced earnings by $0.03 per share, primarily due
to increased coal transportation costs.
• Increased generation O&M expenses reduced earnings by $0.04 per share. An increased
number of scheduled outages at the fossil plants in the second quarter of 2008 decreased
earnings by $0.06 per share while lower nuclear operating expenses increased earnings by $0.02
per share.
2. • Reduced pension expense increased earnings by $0.01 per share, primarily due to an increase in
the discount rate used to determine benefit obligations as of December 31, 2007.
• Incremental property additions increased depreciation expense by $0.02 per share.
• Decreased investment income due to market-related declines in the value of corporate-owned
life insurance reduced earnings by $0.04 per share.
• Lower financing costs increased earnings by $0.04 per share. The decrease in financing costs
reflects lower interest rates on short-term borrowings and variable rate long-term debt.
• Two special items were recognized during the second quarter of 2008. The first was a $0.03 per
share increase in earnings recognized from the settlement of a claim related to a former GPU
international asset. The second relates to a $0.04 per share reduction in earnings from
impairment of securities held in trust for future nuclear decommissioning activities.
2008 Earnings Guidance
• Normalized non-GAAP* earnings guidance for 2008, excluding special items, has been revised
to $4.25 to $4.35 per share from our previous non-GAAP guidance of $4.15 to $4.35 per share.
Year-to-date normalized non-GAAP earnings now stand at $1.75 per share, producing guidance
for the second half of 2008 of $2.50 to $2.60 per share. Earnings for the remainder of the year,
exclusive of any special items, are expected to be allocated approximately 56% to the third
quarter and 44% to the fourth quarter.
* The 2008 GAAP to non-GAAP reconciliation statements can be found on page 10 of this report and all GAAP to non-GAAP
reconciliation statements are available on the Investor Information section of FirstEnergy Corp.'s Web site at
www.firstenergycorp.com/ir.
For additional information, please contact:
Ronald E. Seeholzer Rey Y. Jimenez Irene M. Prezelj
Vice President, Investor Relations Manager, Investor Relations Manager, Investor Relations
(330) 384-5415 (330) 761-4239 (330) 384-3859
Consolidated Report to the Financial Community – 2nd Quarter 2008 2
3. FirstEnergy Corp.
Consolidated Statements of Income
(Unaudited)
(In millions, except for per share amounts)
Three Months Ended June 30 Six Months Ended June 30
2008 2007 Change 2008 2007 Change
Revenues
(1) Electric sales $ 3,024 $ 2,904 $ 120 $ 6,054 $ 5,669 $ 385
(2) Other 221 205 16 468 413 55
(3) Total Revenues 3,245 3,109 136 6,522 6,082 440
Expenses
(4) Fuel 316 299 17 644 560 84
(5) Purchased power 1,070 886 184 2,070 1,746 324
(6) Other operating expenses 781 750 31 1,581 1,499 82
(7) Provision for depreciation 168 159 9 332 315 17
(8) Amortization of regulatory assets 246 246 - 504 497 7
(9) Deferral of new regulatory assets (98) (148) 50 (203) (292) 89
(10) General taxes 180 189 (9) 395 392 3
(11) Total Expenses 2,663 2,381 282 5,323 4,717 606
(12) Operating Income 582 728 (146) 1,199 1,365 (166)
Other Income (Expense)
(13) Investment income 16 30 (14) 33 63 (30)
(14) Interest expense (188) (205) 17 (367) (390) 23
(15) Capitalized interest 13 7 6 21 12 9
(16) (159) (168) 9 (313) (315) 2
Total Other Expense
(17) Income Before Income Taxes 423 560 (137) 886 1,050 (164)
(18) Income taxes 160 222 (62) 347 422 (75)
(19) Net Income $ 263 $ 338 $ (75) $ 539 $ 628 (89)
(20) Earnings Per Share of Common Stock
(21) Basic $ 0.86 $ 1.11 $ (0.25) $ 1.77 $ 2.03 $ (0.26)
(22) Diluted $ 0.85 $ 1.10 $ (0.25) $ 1.75 $ 2.01 $ (0.26)
(23) Weighted Average Number of
Common Shares Outstanding
(24) Basic 304 304 - 304 309 (5)
(25) Diluted 307 308 (1) 307 313 (6)
______________________________________________________________________________________________________
Consolidated Report to the Financial Community – 2nd Quarter 2008 3
4. FirstEnergy Corp.
Consolidated Income Segments
(Unaudited)
(In millions)
Three Months Ended June 30, 2008
Ohio
Energy Competitive Transitional Other &
Delivery Energy Generation Reconciling
Services (a) Services (b) Services (c) Adjustments (d) Consolidated
Revenues
Electric sales $ 2,030 $ 324 $ 670 $ - $ 3,024
(1)
Other 152 51 13 5 221
(2)
Internal revenues - 704 - (704) -
(3)
Total Revenues 2,182 1,079 683 (699) 3,245
(4)
Expenses
Fuel - 316 - - 316
(5)
Purchased power 998 221 555 (704) 1,070
(6)
Other operating expenses 413 312 81 (25) 781
(7)
Provision for depreciation 104 59 - 5 168
(8)
Amortization of regulatory assets 235 - 11 - 246
(9)
Deferral of new regulatory assets (98) - - - (98)
(10)
General taxes 149 24 2 5 180
(11)
Total Expenses 1,801 932 649 (719) 2,663
(12)
Operating Income 381 147 34 20 582
(13)
Other Income (Expense)
Investment income 40 (8) (1) (15) 16
(14)
Interest expense (100) (38) - (50) (188)
(15)
Capitalized interest 1 10 - 2 13
(16)
Total Other Expense (59) (36) (1) (63) (159)
(17)
Income Before Income Taxes 322 111 33 (43) 423
(18)
129 45 13 (27) 160
Income taxes
(19)
Net Income $ 193 $ 66 $ 20 $ (16) $ 263
(20)
(a) Consists of regulated transmission and distribution operations, including transition cost recovery, and provider of last resort
generation service for FirstEnergy's Pennsylvania and New Jersey electric utility subsidiaries.
(b) Consists of unregulated generation and commodity operations, including competitive electric sales, and generation sales to
affiliated electric utilities.
(c) Represents provider of last resort generation service by FirstEnergy's Ohio electric utility subsidiaries and MISO transmission
revenues and expenses related to the delivery of generation load.
(d) Consists primarily of interest expense related to holding company debt, corporate support services revenues and expenses
and elimination of intersegment transactions.
______________________________________________________________________________________________________
Consolidated Report to the Financial Community – 2nd Quarter 2008 4
5. FirstEnergy Corp.
Consolidated Income Segments
(Unaudited)
(In millions)
Three Months Ended June 30, 2007
Ohio
Energy Competitive Transitional Other &
Delivery Energy Generation Reconciling
Services (a) Services (b) Services (c) Adjustments (d) Consolidated
Revenues
Electric sales $ 1,933 $ 359 $ 612 $ - $ 2,904
(1)
Other 162 39 13 (9) 205
(2)
Internal revenues - 691 - (691) -
(3)
2,095 1,089 625 (700) 3,109
Total Revenues
(4)
Expenses
Fuel 2 297 - - 299
(5)
Purchased power 877 163 537 (691) 886
(6)
Other operating expenses 410 277 87 (24) 750
(7)
Provision for depreciation 100 51 - 8 159
(8)
Amortization of regulatory assets 242 - 6 (2) 246
(9)
Deferral of new regulatory assets (93) - (55) - (148)
(10)
General taxes 155 26 1 7 189
(11)
1,693 814 576 (702) 2,381
Total Expenses
(12)
Operating Income 402 275 49 2 728
(13)
Other Income (Expense)
Investment income 62 5 - (37) 30
(14)
Interest expense (118) (47) - (40) (205)
(15)
Capitalized interest 2 5 - - 7
(16)
(54) (37) - (77) (168)
Total Other Expense
(17)
348 238 49 (75) 560
Income Before Income Taxes
(18)
141 96 19 (34) 222
Income taxes
(19)
$ 207 $ 142 $ 30 $ (41) $ 338
Net Income
(20)
(a) Consists of regulated transmission and distribution operations, including transition cost recovery, and provider of last resort
generation service for FirstEnergy's Pennsylvania and New Jersey electric utility subsidiaries.
(b) Consists of unregulated generation and commodity operations, including competitive electric sales, and generation sales to
affiliated electric utilities.
(c) Represents provider of last resort generation service by FirstEnergy's Ohio electric utility subsidiaries and MISO transmission
revenues and expenses related to the delivery of generation load.
(d) Consists primarily of interest expense related to holding company debt, corporate support services revenues and expenses
and elimination of intersegment transactions.
______________________________________________________________________________________________________
Consolidated Report to the Financial Community – 2nd Quarter 2008 5
6. FirstEnergy Corp.
Consolidated Income Segments
(Unaudited)
(In millions)
Three Months Ended June 30, 2008 vs. Three Months Ended June 30, 2007
Ohio
Energy Competitive Transitional Other &
Delivery Energy Generation Reconciling
Services (a) Services (b) Services (c) Adjustments (d) Consolidated
Revenues
Electric sales $ 97 $ (35) $ 58 $ - $ 120
(1)
Other (10) 12 - 14 16
(2)
Internal revenues - 13 - (13) -
(3)
87 (10) 58 1 136
Total Revenues
(4)
Expenses
Fuel (2) 19 - - 17
(5)
Purchased power 121 58 18 (13) 184
(6)
Other operating expenses 3 35 (6) (1) 31
(7)
Provision for depreciation 4 8 - (3) 9
(8)
Amortization of regulatory assets (7) - 5 2 -
(9)
Deferral of new regulatory assets (5) - 55 - 50
(10)
General taxes (6) (2) 1 (2) (9)
(11)
108 118 73 (17) 282
Total Expenses
(12)
Operating Income (21) (128) (15) 18 (146)
(13)
Other Income (Expense)
Investment income (22) (13) (1) 22 (14)
(14)
Interest expense 18 9 - (10) 17
(15)
Capitalized interest (1) 5 - 2 6
(16)
(5) 1 (1) 14 9
Total Other Expense
(17)
(26) (127) (16) 32 (137)
Income Before Income Taxes
(18)
(12) (51) (6) 7 (62)
Income taxes
(19)
$ (14) $ (76) $ (10) $ 25 $ (75)
Net Income
(20)
(a) Consists of regulated transmission and distribution operations, including transition cost recovery, and provider of last resort
generation service for FirstEnergy's Pennsylvania and New Jersey electric utility subsidiaries.
(b) Consists of unregulated generation and commodity operations, including competitive electric sales, and generation sales to
affiliated electric utilities.
(c) Represents provider of last resort generation service by FirstEnergy's Ohio electric utility subsidiaries and MISO transmission
revenues and expenses related to the delivery of generation load.
(d) Consists primarily of interest expense related to holding company debt, corporate support services revenues and expenses
and elimination of intersegment transactions.
______________________________________________________________________________________________________
Consolidated Report to the Financial Community – 2nd Quarter 2008 6
7. FirstEnergy Corp.
Financial Statements
(Unaudited)
(In millions)
Condensed Consolidated Balance Sheets
As of As of
Assets June 30, 2008 Dec 31, 2007
Current Assets:
Cash and cash equivalents $ 70 $ 129
Receivables 1,553 1,421
Other 1,212 680
Total Current Assets 2,835 2,230
Property, Plant and Equipment 16,703 15,383
Investments 3,415 3,598
Deferred Charges and Other Assets 10,592 10,857
Total Assets $ 33,545 $ 32,068
Liabilities and Capitalization
Current Liabilities:
Currently payable long-term debt $ 2,508 $ 2,014
Short-term borrowings 2,608 903
Accounts payable 930 777
Other 1,091 1,454
Total Current Liabilities 7,137 5,148
Capitalization:
Common stockholders' equity 9,221 8,977
Long-term debt and other long-term obligations 8,603 8,869
Total Capitalization 17,824 17,846
Noncurrent Liabilities 8,584 9,074
Total Liabilities and Capitalization $ 33,545 $ 32,068
General Information
Three Months Ended June 30 Six Months Ended June 30
2008 2007 2008 2007
Debt and equity securities redemptions $ (352) $ (485) $ (720) $ (1,389)
New long-term debt issues $ 549 $ 550 $ 549 $ 800
Short-term borrowings $ 959 $ 169 $ 1,705 $ 1,308
Capital expenditures $ 906 $ 401 $ 1,617 $ 697
Adjusted Capitalization
As of June 30
2008 % Total 2007 % Total
Total common equity $ 9,221 39% $ 8,640 38%
Long-term debt and other long-term obligations 8,603 36% 8,742 39%
Currently payable long-term debt 2,508 10% 2,000 9%
Short-term borrowings 2,608 11% 2,416 11%
Adjustments:
Sale-leaseback net debt equivalents 1,417 6% 1,143 5%
JCP&L securitization debt (385) -2% (411) -2%
$ 23,972 100% $ 22,530 100%
Total
______________________________________________________________________________________________________
Consolidated Report to the Financial Community – 2nd Quarter 2008 7
8. FirstEnergy Corp.
Financial Statements
(Unaudited)
(In millions)
Condensed Consolidated Statements of Cash Flows
Three Months Ended June 30 Six Months Ended June 30
2008 2007 2008 2007
Cash flows from operating activities
Net income $ 263 $ 338 $ 539 $ 628
Adjustments to reconcile net income to net cash from operating activities:
Depreciation, amortization, and deferral of regulatory assets 316 257 633 520
Deferred purchased power and other costs (60) (69) (119) (185)
Deferred income taxes and investment tax credits 40 32 129 85
Deferred rents and lease market valuation liability (105) (67) (101) (92)
Pension trust contribution - - - (300)
Cash collateral, net 59 (25) 67 (19)
Electric service prepayment programs (20) (19) (39) (36)
Change in working capital and other (533) (220) (793) (431)
(40) 227 316 170
Cash flows provided from (used for) operating activities
Cash flows provided from financing activities 1,003 108 1,230 454
Cash flows used for investing activities (963) (387) (1,605) (677)
Net decrease in cash and cash equivalents $ - $ (52) $ (59) $ (53)
Deferrals and Amortizations
Three Months Ended June 30 Six Months Ended June 30
2008 2007 Change 2008 2007 Change
Ohio Rate Plans and Transmission Deferrals
$ 1,799 $ 1,842 $ 1,847 $ 1,863
Regulatory Assets - Beginning
Interest on shopping incentives 8 9 $ (1) 16 19 $ (3)
MISO costs and interest - 30 (30) 2 38 (36)
RCP distribution reliability costs and interest 44 44 - 84 91 (7)
RCP fuel costs and interest 1 27 (26) 8 41 (33)
Other 8 5 3 15 11 4
$ 61 $ 115 $ (54) $ 125 $ 200 $ (75)
Current period deferrals
Amortization
Ohio transition costs $ (73) $ (72) $ (1) $ (145) $ (140) $ (5)
Shopping incentives (29) (29) - (59) (59) -
MISO costs (9) (6) (3) (18) (11) (7)
Other (3) 1 (4) (4) (2) (2)
$ (114) $ (106) $ (8) $ (226) $ (212) $ (14)
Current period amortization
$ 1,746 $ 1,851 $ 1,746 $ 1,851
Regulatory Assets - Ending
Pennsylvania Deferred PJM Costs
$ 293 $ 186 $ 255 $ 157
Beginning balance
Deferrals 31 30 $ 1 71 63 $ 8
Interest 3 2 1 5 3 2
Amortizations (4) (2) (2) (8) (7) (1)
$ - $ 9
$ 323 $ 216 $ 323 $ 216
Ending balance
New Jersey Deferred Energy Costs
$ 264 $ 357 $ 322 $ 369
Beginning balance
Net recovery of energy costs 29 35 $ (6) (29) 23 $ (52)
$ 293 $ 392 $ 293 $ 392
Ending balance
______________________________________________________________________________________________________
Consolidated Report to the Financial Community – 2nd Quarter 2008 8
9. FirstEnergy Corp.
Statistical Summary
(Unaudited)
Electric Sales Statistics (kWh in millions)
Three Months Ended June 30 Six Months Ended June 30
2008 2007 Change 2008 2007 Change
Electric Distribution Deliveries
Ohio - Residential 3,658 3,835 -4.6% 8,606 8,666 -0.7%
- Commercial 3,560 3,674 -3.1% 7,409 7,469 -0.8%
- Industrial 5,781 5,908 -2.1% 11,412 11,587 -1.5%
- Other 93 93 - 184 186 -1.1%
Total Ohio 13,092 13,510 -3.1% 27,611 27,908 -1.1%
Pennsylvania - Residential 2,493 2,564 -2.8% 5,930 5,868 1.1%
- Commercial 2,755 2,730 0.9% 5,615 5,501 2.1%
- Industrial 2,666 2,567 3.9% 5,174 5,109 1.3%
- Other 20 21 -4.8% 41 40 2.5%
Total Pennsylvania 7,934 7,882 0.7% 16,760 16,518 1.5%
New Jersey - Residential 2,198 2,387 -7.9% 4,553 4,740 -3.9%
- Commercial 2,319 2,416 -4.0% 4,644 4,713 -1.5%
- Industrial 722 724 -0.3% 1,416 1,426 -0.7%
- Other 21 21 - 43 43 -
Total New Jersey 5,260 5,548 -5.2% 10,656 10,922 -2.4%
Total Residential 8,349 8,786 -5.0% 19,089 19,274 -1.0%
Total Commercial 8,634 8,820 -2.1% 17,668 17,683 -0.1%
Total Industrial 9,169 9,199 -0.3% 18,002 18,122 -0.7%
Total Other 134 135 -0.7% 268 269 -0.4%
Total Distribution Deliveries 26,286 26,940 -2.4% 55,027 55,348 -0.6%
Electric Sales Shopped
Ohio - Residential 466 489 -4.7% 1,020 1,050 -2.9%
- Commercial 798 872 -8.5% 1,643 1,752 -6.2%
- Industrial 659 692 -4.8% 1,289 1,333 -3.3%
Total Ohio 1,923 2,053 -6.3% 3,952 4,135 -4.4%
Pennsylvania - Residential 26 11 136.4% 60 11 445.5%
- Commercial 183 156 17.3% 381 264 44.3%
- Industrial 585 460 27.2% 1,077 876 22.9%
Total Pennsylvania 794 627 26.6% 1,518 1,151 31.9%
New Jersey - Commercial 608 519 17.1% 1,175 994 18.2%
- Industrial 559 555 0.7% 1,095 1,074 2.0%
Total New Jersey 1,167 1,074 8.7% 2,270 2,068 9.8%
Total Electric Sales Shopped 3,884 3,754 3.5% 7,740 7,354 5.2%
Electric Generation Sales
Retail - Regulated 22,402 23,186 -3.4% 47,287 47,994 -1.5%
Retail - Competitive 2,746 3,285 -16.4% 5,662 6,491 -12.8%
Total Retail 25,148 26,471 -5.0% 52,949 54,485 -2.8%
Wholesale 5,846 6,360 -8.1% 11,263 11,423 -1.4%
Total Electric Generation Sales 30,994 32,831 -5.6% 64,212 65,908 -2.6%
Operating Statistics
Three Months Ended June 30 Six Months Ended June 30
2008 2007 2008 2007
Capacity Factors:
Nuclear 85% 80% 86% 89%
Fossil - Baseload 76% 90% 80% 77%
Fossil - Load Following 60% 72% 65% 73%
Generation Output:
Nuclear 39% 33% 38% 38%
Fossil - Baseload 39% 43% 39% 37%
Fossil - Load Following 21% 23% 21% 24%
Peaking 1% 1% 2% 1%
Three Months Ended June 30, Six Months Ended June 30,
Weather 2008 2007 Normal 2008 2007 Normal
Composite Heating-Degree-Days 615 660 663 3,480 3,562 3,468
Composite Cooling-Degree-Days 254 285 249 254 286 250
______________________________________________________________________________________________________
Consolidated Report to the Financial Community – 2nd Quarter 2008 9
10. FirstEnergy Corp.
Special Items and EPS Reconciliations
(Unaudited)
(In millions, except for per share amounts)
Special Items
Three Months Ended June 30 Six Months Ended June 30
2008 2007 2008 2007
Pre-tax Items - Income Increase (Decrease)
Gain on sale of non-core assets (a) $ - $ - $ 32 $ -
Saxton decommissioning costs regulatory assets (b) - - - 27
Trust securities impairment (c) (21) (8) (38) (12)
Litigation settlement (a) 15 - 15 -
$ (6) $ (8) $ 9 $ 15
Total-Pretax Items
EPS Effect $ (0.01) $ (0.02) $ 0.02 $ 0.02
(a) Included in quot;Revenues - Otherquot;
(b) Included in quot;Deferral of new regulatory assetsquot;
(c) Included in quot;Investment incomequot;
2008 Earnings Per Share (EPS)
(Reconciliation of GAAP to Non-GAAP)
ACTUAL ACTUAL REVISED
Three Months Six Months Guidance For
Ended June 30 Ended June 30 Year 2008
$ 0.86 $ 1.77 $4.27 - $4.37
Basic EPS (GAAP basis)*
Excluding Special Items*:
Gain on sale of non-core assets - (0.06) (0.06)
Litigation settlement (0.03) (0.03) (0.03)
Trust securities impairment 0.04 0.07 0.07
$ 0.87 $ 1.75 $4.25 - $4.35
Basic EPS (Non-GAAP basis)
* Excludes possible write-off of $485 million of CEI's estimated unrecoverable transition costs under the proposed
ESP, which if recognized, would be categorized as a Special Item ($1.01 per share).
______________________________________________________________________________________________________
Consolidated Report to the Financial Community – 2nd Quarter 2008 10
11. RECENT DEVELOPMENTS
Ohio Regulatory Update
On July 31, 2008, Ohio Edison Company (OE), The Cleveland Electric Illuminating Company, and The Toledo
Edison Company (TE) (collectively, Ohio Companies) filed both an Electric Security Plan (ESP) and Market Rate
Offer (MRO) with the Public Utilities Commission of Ohio (PUCO). The comprehensive ESP includes supply
and pricing for retail generation service for up to a three-year period, in addition to seeking approval of
outstanding issues currently pending before the PUCO in the Ohio Companies’ distribution rate case. A PUCO
decision is required within 150 days, with new rates to be effective for customers January 1, 2009. Under the
MRO alternative, the Ohio Companies would procure generation supply through a competitive bidding process
(CBP). An independent third-party CBP Manager would conduct the bidding process, with oversight by the
PUCO. The MRO proposes a portfolio approach to procurement, initially using a staggered bid and subsequently
a multi-phased procurement cycle. The PUCO is required to review FirstEnergy’s MRO application within 90
days. The MRO would be implemented if the ESP is not approved by the PUCO.
On July 2, 2008, and July 23, 2008, the PUCO staff issued proposed rules for comment to implement portions of
Amended Substitute Senate Bill 221 (Substitute SB 221). FirstEnergy filed written comments on the first set of
proposed rules on July 22, 2008, and reply comments are due August 6, 2008. Written comments on the second
set are due August 12, 2008, and reply comments are due August 22, 2008. Proposed rules to implement other
portions of Substitute SB 221, including the alternative energy portfolio standard, are expected to be issued in late
August. Following the comment period, the PUCO will consider input from stakeholders before adopting final
rules, which is expected to be in late September. The rules will then be subject to review by the Joint Committee
on Agency Rule Review (a group consisting of five State Representatives and five State Senators).
Ohio Supreme Court Remand on Rate Certainty Plan
On June 3, 2008, the Ohio Companies made a filing to suspend the procedural schedule in their application to
recover their 2006-2007 deferred fuel costs and associated carrying charges ($220 million balance as of December
31, 2007) since they anticipated that their ESP filing would contain a proposal addressing the recovery of these
deferred fuel costs. On June 4, 2008, the PUCO Staff issued its report in accordance with its previously
established procedural schedule. On June 11, 2008, the PUCO denied the request to suspend proceedings until
the ESP case is completed, but it revised the procedural schedule. Testimony is now due August 29, 2008, and an
evidentiary hearing is scheduled for September 29, 2008.
Penn Power Interim Default Service Supply Plan
On May 14, 2008, Pennsylvania Power Company (Penn Power) held its second Request for Proposal (RFP) to
procure default service for residential customers for the period June 2008 through May 2009 and a portion of the
load for the period June 2009 through May 2010. The Pennsylvania Public Utility Commission (PPUC) approved
the second residential RFP on May 16, 2008. On May 20, 2008, Penn Power filed compliance tariffs with the new
default service generation rates for residential customers based on the approved RFP bids, which the PPUC
certified on May 21, 2008. The average price of the winning bids was $80.48 per MWh, before line losses,
administrative fees and gross receipts tax, and will be reflected in Penn Power’s new default service rates that are
effective for the period June 2008 through May 2009. RFPs for the remainder of the residential customers’ load
for the period June 2009 through May 2010 are scheduled for October 2008 and January 2009.
Met-Ed and Penelec Transmission Service Charge
On May 22, 2008, the PPUC approved Metropolitan Edison Company’s (Met-Ed) and Pennsylvania Electric
Company’s (Penelec) annual updates to their transmission service charge riders (TSC) for the period June 1, 2008,
through May 31, 2009. The approved TSCs include a component for under-recovery of actual transmission costs
incurred during prior periods and transmission costs projected for June 2008 through May 2009. Met-Ed’s TSC
includes a transition approach that will recover past under-recovered costs plus carrying charges through the new
TSC, with deferral of a portion of the projected costs plus carrying charges for recovery through future TSCs by
December 31, 2010. Various intervenors filed complaints against Met-Ed’s and Penelec’s TSC filings.
Consolidated Report to the Financial Community – 2nd Quarter 2008 11
12. In addition, the PPUC ordered an investigation to review the reasonableness of Met-Ed’s TSC, while at the same
time allowing the company to implement the rider June 1, 2008, subject to refund. On July 15, 2008, the PPUC
directed the Administrative Law Judge to consolidate the complaints against Met-Ed with its investigation. An
evidentiary hearing for both companies is scheduled for January 14-15, 2009.
New Long-Term Fuel Supply Arrangements
On July 16, 2008, a subsidiary of FirstEnergy entered into a joint venture with the Boich Companies, a Columbus,
Ohio-based coal company, to acquire a majority stake in the Bull Mountain mine operations in Montana.
FirstEnergy will make a $125 million equity investment in the joint venture. Under an acquisition and
development agreement, the joint venture will acquire 80 percent of the Bull Mountain mining operations, and 100
percent of the rail operations, with FirstEnergy owning a 45 percent economic interest in the joint venture and an
affiliate of the Boich Companies owning a 55 percent economic interest, with both parties having a 50 percent
voting interest in the joint venture. In January 2010, the joint venture will have the option for 18 months to
acquire the remaining 20 percent stake in the mining operations.
In a related transaction, FirstEnergy has entered into a 15-year agreement to purchase up to 10 million tons of
bituminous western coal annually from the mine. FirstEnergy also reached tentative agreements with the rail
carriers associated with transporting coal from the mine to its generating stations, and it expects to begin taking
delivery of the coal in late 2009 or early 2010. The above mentioned joint venture has the right to resell
FirstEnergy’s Bull Mountain tonnage not used at FirstEnergy’s facilities and has call rights on such coal above
certain levels.
Nuclear Sale and Leaseback Restructuring
On May 30, 2008, FirstEnergy Nuclear Generation Corp. (NGC) purchased 56.8 MW of lessor equity interests in
the OE 1987 sale and leaseback of the Perry Plant. On June 2, 2008, NGC purchased approximately 43.5 MW of
lessor equity interests in the OE 1987 sale and leaseback of Beaver Valley Unit 2 (BV2). Between June 2, 2008,
and June 9, 2008, NGC purchased an additional 158.5 MW of additional lessor equity interests in the TE and CEI
1987 sale and leaseback of BV2, which purchases were undertaken in connection with the previously disclosed
exercise of the periodic purchase option provided in the TE and CEI sale and leaseback arrangements. The Ohio
Companies continue to lease these MWs under the respective sale and leaseback arrangements and the related
lease debt remains outstanding.
New $300 Million Credit Facility
On May 30, 2008, FirstEnergy Corp. and FirstEnergy Solutions Corp. entered into a $300 million, 364-day
revolving credit facility. The pricing, terms and conditions are substantially similar to those contained in the
current FirstEnergy $2.75 billion revolving credit agreement.
Refunding of Auction Rate Bonds
On June 6, 2008, NGC completed the refunding of $179.5 million of its bonds that previously had been in an
auction rate mode into a variable-rate mode supported by a bank letter of credit. On June 30, 2008, FirstEnergy
Generation Corp. (FGCO) refunded $276.2 million of its bonds that had previously been in an auction rate mode
into a variable-rate mode supported by a bank letter of credit. FirstEnergy no longer holds any auction rate bonds.
Fremont Combined-Cycle Generating Plant
On January 31, 2008, FGCO completed the purchase of a partially complete 707-MW natural gas-fired generating
plant in Fremont, Ohio, from Calpine Corporation for $253.6 million. In June 2008, FGCO completed an
engineering study indicating an estimated $208 million of capital expenditures would be required to complete the
project. Approximately $41 million is expected to be invested in 2008 with planned commercial operation of the
plant expected to begin in December 2009.
Nuclear Operations Update
On May 22, 2008, the 868-MW BV2 returned to service following its regularly scheduled refueling outage that
began on April 14, 2008. Major work activities completed during the outage included replacing approximately
one-third of the fuel assemblies in the reactor and the high pressure turbine rotor. During the outage, BV2
completed the final phase of an extended power uprate project.
Consolidated Report to the Financial Community – 2nd Quarter 2008 12
13. On June 30, 2008, the Nuclear Regulatory Commission approved a 12 MW uprate at the 893-MW Davis-Besse
Nuclear Power Station. This power uprate, along with BV2’s, was achieved in support of FirstEnergy’s strategy
to maximize the full potential of its existing generation assets.
Forward-looking Statements. This Consolidated Report to the Financial Community includes forward-looking
statements based on information currently available to management. Such statements are subject to certain risks and
uncertainties. These statements include declarations regarding our, or our management’s, intents, beliefs and current
expectations. These statements typically contain, but are not limited to, the terms “anticipate,” “potential,” “expect,”
“believe,” “estimate” and similar words. Forward-looking statements involve estimates, assumptions, known and
unknown risks, uncertainties and other factors that may cause our actual results, performance or achievements to be
materially different from any future results, performance or achievements expressed or implied by such forward-looking
statements. Actual results may differ materially due to the speed and nature of increased competition in the electric
utility industry and legislative and regulatory changes affecting how generation rates will be determined following the
expiration of existing rate plans in Ohio and Pennsylvania, the impact of the PUCO’s rulemaking process on our Ohio
utility subsidiaries’ Electric Security Plan and Market Rate Offer filings, economic or weather conditions affecting
future sales and margins, changes in markets for energy services, changing energy and commodity market prices and
availability, replacement power costs being higher than anticipated or inadequately hedged, the continued ability of
FirstEnergy’s regulated utilities to collect transition and other charges or to recover increased transmission costs,
maintenance costs being higher than anticipated, other legislative and regulatory changes including revised
environmental requirements and possible greenhouse gas emissions regulation, the impact of the U.S. Court of Appeals’
July 11, 2008 decision to vacate the CAIR rules and the scope of any laws, rules or regulations that may ultimately take
their place, the uncertainty of the timing and amounts of the capital expenditures needed to, among other things,
implement the Air Quality Compliance Plan (including that such amounts could be higher than anticipated) or levels of
emission reductions related to the Consent Decree resolving the New Source Review litigation or other potential
regulatory initiatives, adverse regulatory or legal decisions and outcomes (including, but not limited to, the revocation
of necessary licenses or operating permits and oversight by the Nuclear Regulatory Commission including, but not
limited to, the Demand for Information issued to FENOC on May 14, 2007) as disclosed in our SEC filings, the timing
and outcome of various proceedings before the PUCO (including, but not limited to, the Distribution Rate Cases and the
generation supply plan filing for the Ohio Companies and the successful resolution of the issues remanded to the PUCO
by the Supreme Court of Ohio regarding the Rate Stabilization Plan and the Rate Certainty Plan, including the deferral
of fuel costs) and Met-Ed and Penelec’s transmission service charge filings with the PPUC (as well as the resolution of
the Petitions for Review filed with the Commonwealth Court of Pennsylvania with respect to the transition rate plan for
Met-Ed and Penelec), the continuing availability of generating units and their ability to continue to operate at or near
full capacity, the ability to comply with applicable state and federal reliability standards, the ability to accomplish or
realize anticipated benefits from strategic goals (including employee workforce initiatives), the ability to improve
electric commodity margins and to experience growth in the distribution business, changing market conditions that
could affect the value of assets held in our nuclear decommissioning trust fund, pension fund and other trust funds, the
ability to access the public securities and other capital markets and the cost of such capital, the risks and other factors
discussed from time to time in our SEC filings, and other similar factors. The foregoing review of factors should not be
construed as exhaustive. New factors emerge from time to time, and it is not possible for us to predict all such factors,
nor can we assess the impact of any such factor on our business or the extent to which any factor, or combination of
factors, may cause results to differ materially from those contained in any forward-looking statements. We expressly
disclaim any current intention to update any forward-looking statements contained herein as a result of new information,
future events, or otherwise.
Consolidated Report to the Financial Community – 2nd Quarter 2008 13