The document is a news release announcing U.S. Bancorp's financial results for the second quarter of 2007. It reported net income of $1,156 million, down slightly from the same period last year. Key highlights included strong growth in fee-based revenue from payment services and wealth management, though this was offset by lower net interest income and higher credit costs. Expenses also increased as the company continued investing in business initiatives. Credit quality remained solid as nonperforming assets declined from the previous quarter.
TEST BANK For Corporate Finance, 13th Edition By Stephen Ross, Randolph Weste...
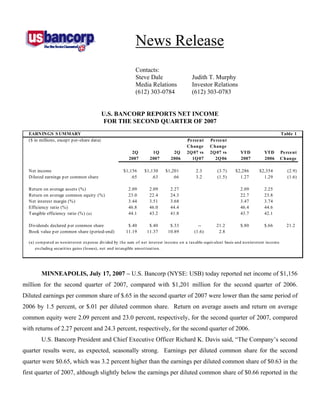
u.s.bancorp2Q 2007 Earnings Release
1. News Release
Contacts:
Steve Dale Judith T. Murphy
Media Relations Investor Relations
(612) 303-0784 (612) 303-0783
U.S. BANCORP REPORTS NET INCOME
FOR THE SECOND QUARTER OF 2007
EARNINGS S UMMARY Table 1
($ in millions, excep t p er-share data) Pe rce nt Pe rce nt
Change Change
2Q 1Q 2Q 2Q 07 vs 2Q 07 vs YTD YTD Pe rce nt
2007 2007 2006 1Q 07 2Q 06 2007 2006 Change
Net income $1,156 $1,130 $1,201 2.3 (3.7) $2,286 $2,354 (2.9)
Diluted earnings p er common share .65 .63 .66 3.2 (1.5) 1.27 1.29 (1.6)
Return on average assets (%) 2.09 2.09 2.27 2.09 2.25
Return on average common equity (%) 23.0 22.4 24.3 22.7 23.8
Net interest margin (%) 3.44 3.51 3.68 3.47 3.74
Efficiency ratio (%) 46.8 46.0 44.4 46.4 44.6
44.1 43.2 41.8 43.7 42.1
T angible efficiency ratio (%) (a)
Dividends declared p er common share $.40 $.40 $.33 -- 21.2 $.80 $.66 21.2
Book value p er common share (p eriod-end) 11.19 11.37 10.89 (1.6) 2.8
(a) com put ed as nonint erest expense divided by t he sum of net int erest incom e on a t axable-equivalent basis and nonint erest incom e
excluding securit ies gains (losses), net and int angible am ort izat ion.
MINNEAPOLIS, July 17, 2007 – U.S. Bancorp (NYSE: USB) today reported net income of $1,156
million for the second quarter of 2007, compared with $1,201 million for the second quarter of 2006.
Diluted earnings per common share of $.65 in the second quarter of 2007 were lower than the same period of
2006 by 1.5 percent, or $.01 per diluted common share. Return on average assets and return on average
common equity were 2.09 percent and 23.0 percent, respectively, for the second quarter of 2007, compared
with returns of 2.27 percent and 24.3 percent, respectively, for the second quarter of 2006.
U.S. Bancorp President and Chief Executive Officer Richard K. Davis said, “The Company’s second
quarter results were, as expected, seasonally strong. Earnings per diluted common share for the second
quarter were $0.65, which was 3.2 percent higher than the earnings per diluted common share of $0.63 in the
first quarter of 2007, although slightly below the earnings per diluted common share of $0.66 reported in the
2. U.S. Bancorp Reports Second Quarter 2007 Results
July 17, 2007
Page 2
second quarter of 2006. The seasonally strong results reflected growth in all fee income categories, modest
balance sheet expansion and strong credit quality. The Company’s profitability metrics remained solid with
return on average assets of 2.09 percent and return on average common equity of 23.0 percent.
“One of the main highlights of our second quarter results was the seasonally strong growth in fee
income. The Payment Services group posted double digit growth in fees on both a year-over-year and linked
quarter basis, while noninterest income related to trust and investment management and treasury
management also posted strong growth. The momentum we are seeing in these fee-based businesses is a
direct result of the investments we have made over the past number of years. Focused on building our
expertise in payments and processing, we expect to continue to capitalize on opportunities to invest more
going forward.
“The Company’s efficiency ratio of 46.8 percent in the second quarter, although higher than the
second quarter of 2006 and the previous quarter, remains among the best in the industry. Increases in
noninterest expense in the current quarter reflected continuing investments in our fee-based business lines
and banking franchise, as well as a number of distinct business event-driven activities. Our disciplined
approach to expense control has not changed and will continue to be a focus and hallmark for this Company.
As our second quarter results demonstrate, our efficiency allows us to continue to invest and support the
growth of our businesses, while maintaining our industry-leading profitability.
“Another highlight of our second quarter results was the Company’s continuing strong credit quality
metrics. Nonperforming assets declined once again this quarter, while net charge-offs, as expected,
increased modestly to .53 percent of average loans outstanding from .50 percent in the first quarter of this
year. As we grow our balance sheet, we will continue to maintain our prudent approach to credit which is,
given the current economic environment, even more important and challenging today than it has been in the
recent past.
“The banking industry as a whole is operating under a challenging economic environment. We have
not been immune to those challenges, but our second quarter results further support my belief that our
Company is well positioned to produce a consistent, predictable and repeatable earnings stream going
forward. As a Company, we are focused on the future and the opportunity to grow to better serve our
customers, communities and shareholders.”
(MORE)
3. U.S. Bancorp Reports Second Quarter 2007 Results
July 17, 2007
Page 3
The Company’s results for the second quarter of 2007 declined over the same period of 2006. Strong
fee-based revenue growth in Payment Services and Wealth Management were muted somewhat by a $35
million gain in the second quarter of 2006 from the initial public offering of a card association. The year-
over-year results also reflected an expected increase in credit costs and lower net interest income from a year
ago. On a linked quarter basis, net income increased $26 million, or $.02 per diluted common share,
reflecting continued strength in fee-based revenue partially offset by higher credit costs and operating
expenses.
Total net revenue on a taxable-equivalent basis for the second quarter of 2007 was $3,505 million, $53
million (1.5 percent) higher than the second quarter of 2006, primarily reflecting a 5.7 percent increase in
noninterest income partially offset by a 2.8 percent decline in net interest income from a year ago.
Noninterest income growth was driven primarily by organic business growth of 7.8 percent offset somewhat
by the impact in the second quarter of 2006 of a $35 million gain from the initial public offering of a card
association. On a linked quarter basis, total net revenue increased $143 million (4.3 percent), primarily
reflecting organic growth and seasonally higher transaction volumes in several revenue categories.
Total noninterest expense in the second quarter of 2007 was $1,640 million, $110 million (7.2 percent)
higher than the second quarter of 2006, principally due to investments in business initiatives, higher
operating and business integration costs associated with recent acquisitions, costs related to tax-advantaged
investments and an increase in merchant airline processing primarily due to sales volumes and recent
business expansion with a major airline. Growth in expenses from a year ago was partially offset by a debt
prepayment charge recorded in the second quarter of 2006. On a linked quarter basis, total noninterest
expense increased by $95 million (6.1 percent), reflecting the timing of marketing and business development
programs, costs associated with business initiatives, including the pan-European Payment Systems expansion
and incremental merchant airline processing, and higher credit-related costs for other real estate owned and
collection activities. These increases on a linked quarter basis were partially offset by lower employee
benefits costs which are seasonally higher in the first quarter of the year.
Provision for credit losses for the second quarter of 2007 was $191 million, an increase of $14 million
from the first quarter of 2007 and $66 million higher than the second quarter of 2006. The increase in the
provision for credit losses from a year ago reflected expected losses from strong growth in credit card
accounts. Also, the provision for credit losses in the second quarter of 2006 partially reflected the favorable
residual impact on net charge-offs, principally for credit cards and other retail charge-offs, due to changes in
(MORE)
4. U.S. Bancorp Reports Second Quarter 2007 Results
July 17, 2007
Page 4
bankruptcy laws in the fourth quarter of 2005. Net charge-offs in the second quarter of 2007 were $191
million, compared with the first quarter of 2007 net charge-offs of $177 million and the second quarter of
2006 net charge-offs of $125 million. The Company’s credit quality continues to be strong as nonperforming
assets declined $17 million (2.9 percent) during the second quarter of 2007. Total nonperforming assets
were $565 million at June 30, 2007, compared with $582 million at March 31, 2007, and $550 million at
June 30, 2006. The ratio of the allowance for credit losses to nonperforming loans was 503 percent at June
30, 2007, compared with 498 percent at March 31, 2007, and 500 percent at June 30, 2006.
INCO ME S TATEMENT HIGHLIGHTS Table 2
(T axable-equivalent basis, $ in millions, Percent Percent
excep t p er-share data) Change Change
2Q 1Q 2Q 2Q 07 vs 2Q 07 vs YTD YTD Percent
2007 2007 2006 1Q 07 2Q 06 2007 2006 Change
Net interest income $1,650 $1,666 $1,697 (1.0) (2.8) $3,316 $3,422 (3.1)
Noninterest income 1,855 1,696 1,755 9.4 5.7 3,551 3,369 5.4
T otal net revenue 3,505 3,362 3,452 4.3 1.5 6,867 6,791 1.1
Noninterest exp ense 1,640 1,545 1,530 6.1 7.2 3,185 3,030 5.1
Income before p rovision and taxes 1,865 1,817 1,922 2.6 (3.0) 3,682 3,761 (2.1)
Provision for credit losses 191 177 125 7.9 52.8 368 240 53.3
Income before taxes 1,674 1,640 1,797 2.1 (6.8) 3,314 3,521 (5.9)
T axable-equivalent adjustment 18 17 11 5.9 63.6 35 21 66.7
Ap p licable income taxes 500 493 585 1.4 (14.5) 993 1,146 (13.4)
Net income $1,156 $1,130 $1,201 2.3 (3.7) $2,286 $2,354 (2.9)
Net income ap p licable to common equity $1,141 $1,115 $1,184 2.3 (3.6) $2,256 $2,337 (3.5)
Diluted earnings p er common share $.65 $.63 $.66 3.2 (1.5) $1.27 $1.29 (1.6)
Net Interest Income
Second quarter net interest income on a taxable-equivalent basis was $1,650 million, compared with
$1,697 million in the second quarter of 2006. Average earning assets for the period increased over the
second quarter of 2006 by $7.4 billion (4.0 percent), primarily driven by an increase of $6.3 billion (4.5
percent) in total average loans. The positive impact to net interest income from the growth in earning assets
was more than offset by a lower net interest margin. The net interest margin in the second quarter of 2007
was 3.44 percent, compared with 3.68 percent in the second quarter of 2006, reflecting the competitive
environment and the impact of the flat yield curve during the past several quarters. Since the second quarter
of 2006, credit spreads have tightened by approximately 9 basis points across most lending products due to
(MORE)
5. U.S. Bancorp Reports Second Quarter 2007 Results
July 17, 2007
Page 5
competitive loan pricing. In addition, funding costs have increased as rates paid on interest-bearing deposits
have risen and the funding mix continues to shift toward higher cost deposits and other funding sources. An
increase in loan fees partially offset these factors.
Net interest income in the second quarter of 2007 decreased from the first quarter of 2007 by $16
million (1.0 percent). Net interest income generated by growth in average earning assets of $1.2 billion was
more than offset by the impact on net interest margin of tighter credit spreads, higher funding costs and
specific management actions in the first quarter of 2007. During the second quarter of 2007, the net interest
margin was 3.44 percent, compared with 3.51 percent for the first quarter of 2007, a decline of 7 basis
points. Competitive pricing was a factor in the decline as credit spreads narrowed slightly, while expected
changes in the mix of deposits, other funding sources and net free funds, including the residual impact of
investments in bank-owned life insurance products during the mid-first quarter of 2007, also contributed to
the unfavorable variance. In the latter half of the second quarter of 2007, the tightening of credit spreads and
changes in the deposit and other funding mix have moderated. Given these factors, and that the impact of
the bank-owned life insurance investment is fully incorporated into the net interest margin, the Company
anticipates the net interest margin to remain relatively stable throughout the remainder of the year. This is
consistent with previous management guidance.
(MORE)
6. U.S. Bancorp Reports Second Quarter 2007 Results
July 17, 2007
Page 6
NET INTERES T INCO ME Table 3
(T axable-equivalent basis; $ in millions)
Change Change
2Q 1Q 2Q 2Q 07 vs 2Q 07 vs YTD YTD
2007 2007 2006 1Q 07 2Q 06 2007 2006 Change
Comp onents of net interest income
Income on earning assets $3,276 $3,223 $3,037 $53 $239 $6,499 $5,940 $559
Exp ense on interest-bearing liabilities 1,626 1,557 1,340 69 286 3,183 2,518 665
Net interest income $1,650 $1,666 $1,697 $(16) $(47) $3,316 $3,422 $(106)
Average y ields and rates p aid
Earning assets y ield 6.83% 6.81% 6.58% .02% .25% 6.82% 6.49% .33%
Rate p aid on interest-bearing liabilities 3.95 3.88 3.45 .07 .50 3.91 3.28 .63
Gross interest margin 2.88% 2.93% 3.13% (.05)% (.25)% 2.91% 3.21% (.30)%
Net interest margin 3.44% 3.51% 3.68% (.07)% (.24)% 3.47% 3.74% (.27)%
Average balances
Investment securities $40,704 $40,879 $40,087 $(175) $617 $40,791 $39,885 $906
Loans 145,653 144,693 139,370 960 6,283 145,176 138,579 6,597
Earning assets 192,301 191,135 184,890 1,166 7,411 191,721 184,000 7,721
Interest-bearing liabilities 165,177 162,682 155,755 2,495 9,422 163,937 154,838 9,099
Net free funds (a) 27,124 28,453 29,135 (1,329) (2,011) 27,784 29,162 (1,378)
(a) Represent s nonint erest -bearing deposit s, allowance for loan losses, unrealized gain (loss) on available-for-sale securit ies, non-earning
asset s, ot her nonint erest -bearing liabilit ies and equit y.
(MORE)
7. U.S. Bancorp Reports Second Quarter 2007 Results
July 17, 2007
Page 7
AVERAGE LO ANS Table 4
($ in millions) Percent Percent
Change Change
2Q 1Q 2Q 2Q 07 vs 2Q 07 vs YTD YTD Percent
2007 2007 2006 1Q 07 2Q 06 2007 2006 Change
Commercial $41,572 $41,470 $39,871 .2 4.3 $41,515 $39,362 5.5
Lease financing 5,625 5,549 5,199 1.4 8.2 5,588 5,139 8.7
T otal commercial 47,197 47,019 45,070 .4 4.7 47,103 44,501 5.8
Commercial mortgages 19,562 19,672 20,195 (.6) (3.1) 19,617 20,231 (3.0)
Construction and develop ment 8,941 8,960 8,600 (.2) 4.0 8,956 8,475 5.7
T otal commercial real estate 28,503 28,632 28,795 (.5) (1.0) 28,573 28,706 (.5)
Residential mortgages 21,831 21,569 20,868 1.2 4.6 21,700 20,927 3.7
Credit card 9,120 8,635 7,360 5.6 23.9 8,879 7,241 22.6
Retail leasing 6,662 6,845 7,115 (2.7) (6.4) 6,753 7,182 (6.0)
Home equity and second mortgages 15,735 15,555 15,035 1.2 4.7 15,646 14,985 4.4
Other retail 16,605 16,438 15,127 1.0 9.8 16,522 15,037 9.9
T otal retail 48,122 47,473 44,637 1.4 7.8 47,800 44,445 7.5
T otal loans $145,653 $144,693 $139,370 .7 4.5 $145,176 $138,579 4.8
Average loans for the second quarter of 2007 were $6.3 billion (4.5 percent) higher than the second
quarter of 2006, driven by growth in average total retail loans of $3.5 billion (7.8 percent), total commercial
loans of $2.1 billion (4.7 percent), and residential mortgages of $963 million (4.6 percent), partially offset by
a decline in total commercial real estate loans of $292 million (1.0 percent). Average loans for the second
quarter of 2007 were higher than the first quarter of 2007 by $1.0 billion (.7 percent), primarily reflecting
growth in total retail loans, driven by growth in average credit card balances. Residential mortgages and
total commercial loans also grew modestly in the second quarter of 2007 compared with the first quarter of
2007. Total commercial real estate declined slightly from the first quarter of 2007, reflecting customer
refinancings given liquidity available in the financial markets, a decision to reduce condominium
construction financing in selected markets and a slowdown in residential homebuilding.
Average investment securities in the second quarter of 2007 were $617 million (1.5 percent) higher than
the second quarter of 2006, driven primarily by an increase in the municipal securities portfolio partially
offset by a reduction in mortgage-backed assets.
(MORE)
8. U.S. Bancorp Reports Second Quarter 2007 Results
July 17, 2007
Page 8
AVERAGE DEPO S ITS Table 5
($ in millions) Pe rcent Pe rce nt
Change Change
2Q 1Q 2Q 2Q 07 vs 2Q 07 vs YTD YTD Pe rce nt
2007 2007 2006 1Q 07 2Q 06 2007 2006 Change
Noninterest-bearing dep osits $27,977 $27,677 $28,949 1.1 (3.4) $27,828 $28,893 (3.7)
Interest-bearing dep osits
Interest checking 25,858 25,076 23,333 3.1 10.8 25,470 23,238 9.6
M oney market savings 24,603 25,712 26,981 (4.3) (8.8) 25,154 27,178 (7.4)
Savings accounts 5,443 5,401 5,720 .8 (4.8) 5,422 5,705 (5.0)
T otal of savings dep osits 55,904 56,189 56,034 (.5) (.2) 56,046 56,121 (.1)
T ime certificates of dep osit less
than $100,000 14,716 14,775 13,689 (.4) 7.5 14,745 13,598 8.4
T ime dep osits greater than $100,000 20,378 22,087 22,561 (7.7) (9.7) 21,228 22,089 (3.9)
T otal interest-bearing dep osits 90,998 93,051 92,284 (2.2) (1.4) 92,019 91,808 .2
T otal dep osits $118,975 $120,728 $121,233 (1.5) (1.9) $119,847 $120,701 (.7)
Average noninterest-bearing deposits for the second quarter of 2007 decreased $972 million (3.4
percent) compared with the second quarter of 2006, reflecting a decline in business demand deposits within
most business lines as these customers reduced excess liquidity to fund business growth. The decline in
business demand account balances was partially offset by higher corporate trust deposits.
Average total savings deposits remained relatively flat year-over-year as an increase of $2.5 billion
(10.8 percent) in interest checking balances due to higher broker dealer, government and institutional trust
balances was offset by a decline of $2.7 billion (8.1 percent) in average money market and savings balances
primarily within Consumer Banking. The overall decrease in average money market savings balances year-
over-year was primarily the result of the Company’s deposit pricing decisions for money market products in
relation to other fixed-rate deposit products offered. A portion of branch-based money market savings
accounts have migrated to fixed-rate time certificates to take advantage of higher interest rates for these
products.
Average time certificates of deposit less than $100,000 were higher in the second quarter of 2007 than
in the second quarter of 2006 by $1.0 billion (7.5 percent) and time deposits greater than $100,000 declined
by $2.2 billion (9.7 percent) over the same period reflecting Company funding decisions. The year-over-
year growth in time certificates less than $100,000 was due to consumer-based time deposits, reflecting
customer migration to higher rate deposit products.
Average noninterest-bearing deposits for the second quarter of 2007 had an increase of $300 million
(1.1 percent) compared with the first quarter of 2007, primarily due to a seasonal increase in government
(MORE)
9. U.S. Bancorp Reports Second Quarter 2007 Results
July 17, 2007
Page 9
demand deposits. Total average savings deposits had a slight decrease of $285 million (.5 percent) from the
first quarter of 2007. Average time deposits greater than $100,000 decreased $1.7 billion (7.7 percent) from
the prior quarter. This change in average time deposits greater than $100,000 reflected asset/liability funding
decisions and included a reduction of higher cost time deposits with government agencies, broker dealers
and other business customers offset by favorable growth in personal certificates of deposits and lower cost
foreign deposits.
NO NINTERES T INCO ME Table 6
($ in millions) Pe rce nt Pe rce nt
Change Change
2Q 1Q 2Q 2Q 07 vs 2Q 07 vs YTD YTD Pe rce nt
2007 2007 2006 1Q 07 2Q 06 2007 2006 Change
Credit and debit card revenue $228 $205 $202 11.2 12.9 $433 $384 12.8
Corp orate p ay ment p roducts revenue 157 145 139 8.3 12.9 302 266 13.5
AT M p rocessing services 62 59 61 5.1 1.6 121 120 .8
M erchant p rocessing services 285 250 253 14.0 12.6 535 466 14.8
T rust and investment management fees 342 322 314 6.2 8.9 664 611 8.7
Dep osit service charges 272 243 264 11.9 3.0 515 496 3.8
T reasury management fees 126 111 116 13.5 8.6 237 223 6.3
Commercial p roducts revenue 105 100 107 5.0 (1.9) 205 211 (2.8)
M ortgage banking revenue 68 67 75 1.5 (9.3) 135 99 36.4
Investment p roducts fees and commissions 38 34 42 11.8 (9.5) 72 80 (10.0)
Securities gains (losses), net 3 1 3 nm -- 4 3 33.3
Other 169 159 179 6.3 (5.6) 328 410 (20.0)
T otal noninterest income $1,855 $1,696 $1,755 9.4 5.7 $3,551 $3,369 5.4
Noninterest Income
Second quarter noninterest income was $1,855 million, an increase of $100 million (5.7 percent) from
the same quarter of 2006 and $159 million (9.4 percent) higher than the first quarter of 2007. The increase
in noninterest income over the second quarter of 2006 was driven by organic growth of 7.8 percent offset
somewhat by a $35 million gain on the initial public offering of a card association recorded in the second
quarter of 2006.
Credit and debit card revenue and corporate payment products revenue were higher in the second
quarter of 2007 than the second quarter of 2006 by $26 million (12.9 percent) and $18 million (12.9 percent),
respectively. The strong growth in credit and debit card revenue was primarily driven by an increase in
customer accounts and higher customer transaction volumes from a year ago. The corporate payment
(MORE)
10. U.S. Bancorp Reports Second Quarter 2007 Results
July 17, 2007
Page 10
products revenue growth reflected organic growth in sales volumes and card usage and an acquired business.
Merchant processing services revenue was higher in the second quarter of 2007 than the same quarter a year
ago by $32 million (12.6 percent), primarily reflecting an increase in customers and sales volumes. Trust
and investment management fees increased by $28 million (8.9 percent) year-over-year due to core account
growth and favorable market conditions. Deposit service charges grew year-over-year by $8 million (3.0
percent) primarily due to increased transaction-related fees and the impact of continued growth in net new
checking accounts. Treasury management fees increased by $10 million (8.6 percent) due to higher
transaction volumes, customer growth and pricing changes. These favorable changes in fee-based revenue
were partially offset by a decline in other income of $10 million (5.6 percent) compared with the second
quarter of 2006. The reduction in other income reflects the gain recognized in the second quarter of 2006
related to the initial public offering of a card association. This was partially offset by an increase in revenue
from investment in a bank-owned life insurance program. In addition, revenue from equity investments was
somewhat higher in the second quarter of 2007 as compared with the same period of 2006. Mortgage
banking revenue declined year-over-year by $7 million (9.3 percent). Growth in both production gains and
servicing income was more than offset by an adverse change in the valuation of mortgage servicing rights
(“MSR”) and corresponding MSR economic hedges due to changes in interest rates late in the second quarter
of 2007.
Noninterest income was higher by $159 million (9.4 percent) in the second quarter of 2007 compared
with the first quarter of 2007. Credit and debit card revenue increased $23 million (11.2 percent) and
corporate payment products revenue increased $12 million (8.3 percent), primarily reflecting seasonally
higher sales volumes and account growth. Merchant processing services revenue increased by $35 million
(14.0 percent) compared with the first quarter of 2007 due to higher sales volumes and pricing initiatives.
Trust and investment management fees and treasury management fees increased over the first quarter of
2007 by $20 million (6.2 percent) and $15 million (13.5 percent), respectively, due to seasonally higher tax
filing fees and tax receipt processing volumes. Deposit service charges grew by $29 million (11.9 percent)
due to higher transaction-related fees and net new accounts. In addition to fee-based revenue increases,
other income increased by $10 million due primarily to increased revenue from the incremental investment
in a bank-owned life insurance program during the first quarter of 2007.
(MORE)
11. U.S. Bancorp Reports Second Quarter 2007 Results
July 17, 2007
Page 11
NO NINTERES T EXPENS E Table 7
($ in millions) Pe rce nt Percent
Change Change
2Q 1Q 2Q 2Q 07 vs 2Q 07 vs YTD YTD Perce nt
2007 2007 2006 1Q 07 2Q 06 2007 2006 Change
Comp ensation $659 $635 $627 3.8 5.1 $1,294 $1,260 2.7
Emp loy ee benefits 123 133 123 (7.5) -- 256 256 --
Net occup ancy and equip ment 171 165 161 3.6 6.2 336 326 3.1
Professional services 59 47 41 25.5 43.9 106 76 39.5
M arketing and business develop ment 64 48 58 33.3 10.3 112 98 14.3
T echnology and communications 126 125 127 .8 (.8) 251 244 2.9
Postage, p rinting and sup p lies 71 69 66 2.9 7.6 140 132 6.1
Other intangibles 95 94 89 1.1 6.7 189 174 8.6
Debt p rep ay ment -- -- 11 -- nm -- 11 nm
Other 272 229 227 18.8 19.8 501 453 10.6
T otal noninterest exp ense $1,640 $1,545 $1,530 6.1 7.2 $3,185 $3,030 5.1
Noninterest Expense
Second quarter noninterest expense totaled $1,640 million, an increase of $110 million (7.2 percent)
from the same quarter of 2006 and $95 million (6.1 percent) more than the first quarter of 2007.
Compensation expense increased by $32 million (5.1 percent) as compared with the same period of 2006 due
to ongoing bank operations and acquired businesses. Net occupancy and equipment expense increased $10
million (6.2 percent) from the second quarter of 2006 primarily due to acquisitions and branch-based
business initiatives. Professional services expense increased by $18 million (43.9 percent) due to revenue
enhancing business initiatives and higher legal costs associated with litigation and establishment of a bank
charter in Ireland to support pan-European payment processing. Marketing and business development
expense increased $6 million (10.3 percent) year-over-year due to the timing of customer promotions,
solicitations and advertising activities. Postage, printing and supplies increased by $5 million (7.6 percent)
from the second quarter of 2006 due to changes in postage rates and increases in customer-related
operations. The increase in other intangibles expense of $6 million (6.7 percent) from the same period of
2006 reflected the impact of recent acquisitions in Consumer Banking, Wealth Management and Payment
Services. Other expense increased by $45 million (19.8 percent) compared with the prior year, due to an
increase in the Company’s merchant airline processing driven by volumes and the impact of the recent
signing of a contract with a major airline. The change in other expense also reflected an increase in the costs
related to tax-advantaged investments, integration expenses related to recent acquisitions and higher credit-
(MORE)
12. U.S. Bancorp Reports Second Quarter 2007 Results
July 17, 2007
Page 12
related costs for other real estate owned and loan collection activities. These expense increases were
partially offset by an $11 million debt prepayment charge recorded in the second quarter of 2006.
Noninterest expense in the second quarter of 2007 was higher than the first quarter of 2007 by $95
million (6.1 percent). Compensation expense increased $24 million (3.8 percent) primarily due to seasonal
increases in merit-based compensation and higher production-based commissions and incentives.
Professional services increased $12 million (25.5 percent) from the first quarter of 2007 due to higher legal
costs associated with business initiatives, litigation and the establishment of the bank in Ireland to support
pan-European payment processing. Marketing and business development expense increased $16 million
(33.3 percent) due to the timing of customer promotions, solicitations and advertising activities within the
Consumer Banking and Payment Services business lines. Other expense increased $43 million (18.8
percent) compared with the first quarter of 2007. This increase was driven by higher costs for the
Company’s merchant airline processing due to seasonally higher ticket sales volumes and the incremental
business of a major airline, higher costs associated with tax-advantaged investments and increased expenses
related to other real estate owned and loan collection efforts. These increases were partially offset by
employee benefits expense which declined $10 million (7.5 percent) compared with the first quarter of 2007
due to a normal seasonal decline in payroll tax expense.
Provision for Income Taxes
The provision for income taxes for the second quarter of 2007 resulted in a tax rate on a taxable
equivalent basis of 30.9 percent (effective tax rate of 30.2 percent) compared with 33.2 percent (effective tax
rate of 32.8 percent) in the second quarter of 2006 and 31.1 percent (effective tax rate of 30.4 percent) in the
first quarter of 2007. The reduction in the tax rate from the same quarter of the prior year primarily reflected
investments in tax-exempt municipal securities and bank-owned life insurance, as well as incremental tax
credits from affordable housing projects and other tax-advantaged investments.
(MORE)
13. U.S. Bancorp Reports Second Quarter 2007 Results
July 17, 2007
Page 13
ALLO WANCE FO R CREDIT LO S S ES Table 8
($ in millions) 2Q 1Q 4Q 3Q 2Q
2007 2007 2006 2006 2006
Balance, beginning of p eriod $2,260 $2,256 $2,256 $2,251 $2,251
Net charge-offs
Commercial 21 32 24 18 13
Lease financing 8 3 7 3 7
T otal commercial 29 35 31 21 20
Commercial mortgages 7 1 2 -- (1)
Construction and develop ment 2 -- -- -- 1
T otal commercial real estate 9 1 2 -- --
Residential mortgages 15 12 12 11 11
Credit card 81 74 68 56 50
Retail leasing 4 3 4 4 2
Home equity and second mortgages 16 16 13 12 13
Other retail 37 36 39 31 29
T otal retail 138 129 124 103 94
T otal net charge-offs 191 177 169 135 125
Provision for credit losses 191 177 169 135 125
Acquisitions and other changes -- 4 -- 5 --
Balance, end of p eriod $2,260 $2,260 $2,256 $2,256 $2,251
Comp onents
Allowance for loan losses $2,028 $2,027 $2,022 $2,034 $2,039
Liability for unfunded credit commitments 232 233 234 222 212
T otal allowance for credit losses $2,260 $2,260 $2,256 $2,256 $2,251
Gross charge-offs $252 $237 $217 $195 $176
Gross recoveries $61 $60 $48 $60 $51
Allowance for credit losses as a p ercentage of
Period-end loans 1.55 1.56 1.57 1.58 1.61
Nonp erforming loans 503 498 480 476 500
Nonp erforming assets 400 388 384 392 409
Credit Quality
The overall credit quality of the Company continued to be strong during the second quarter of 2007.
The allowance for credit losses was $2,260 million at June 30, 2007 and at March 31, 2007, and was $2,251
million at June 30, 2006. The ratio of the allowance for credit losses to period-end loans was 1.55 percent at
June 30, 2007, compared with 1.56 percent at March 31, 2007, and 1.61 percent at June 30, 2006. The ratio
of the allowance for credit losses to nonperforming loans was 503 percent at June 30, 2007, compared with
498 percent at March 31, 2007, and 500 percent at June 30, 2006. Total net charge-offs in the second quarter
of 2007 were $191 million, compared with the first quarter of 2007 net charge-offs of $177 million and the
(MORE)
14. U.S. Bancorp Reports Second Quarter 2007 Results
July 17, 2007
Page 14
second quarter of 2006 net charge-offs of $125 million. The expected increase in total net charge-offs from
a year ago was due primarily to an anticipated increase in consumer charge-offs, specifically related to credit
cards. Bankruptcy levels declined substantially in 2006 as a result of changes in bankruptcy legislation that
went into effect in late 2005.
Commercial and commercial real estate loan net charge-offs increased modestly to $38 million in the
second quarter of 2007 (.20 percent of average loans outstanding) compared with $36 million (.19 percent of
average loans outstanding) in the first quarter of 2007 and $20 million (.11 percent of average loans
outstanding) in the second quarter of 2006. The Company expects commercial and commercial real estate
net charge-offs to continue to increase somewhat over the next several quarters due to slightly higher gross
charge-offs and lower loan recoveries.
Retail loan net charge-offs were $138 million in the second quarter of 2007 compared with $129
million in the first quarter of 2007 and $94 million in the second quarter of 2006. Retail loan net charge-offs
increased as compared with the first quarter of 2007 and from the second quarter of 2006, reflecting higher
levels of credit card losses in the current period due to growth in customer accounts and lower credit card
charge-offs in prior periods related to the impact of the bankruptcy legislation changes that occurred in the
fourth quarter of 2005. Retail loan net charge-offs as a percent of average loans outstanding were 1.15
percent in the second quarter of 2007, compared with 1.10 percent and .84 percent in the first quarter of 2007
and second quarter of 2006, respectively. In addition to the impact of bankruptcy laws, the 31 basis point
increase in retail net charge-offs from the second quarter of 2006 reflected the impact on retail customers of
implementing minimum balance payment requirements during the past several quarters. The Company
anticipates slightly higher delinquencies in the retail portfolios and that net charge-offs will continue to
increase modestly during 2007.
(MORE)
15. U.S. Bancorp Reports Second Quarter 2007 Results
July 17, 2007
Page 15
CREDIT RATIO S Table 9
(Percent) 2Q 1Q 4Q 3Q 2Q
2007 2007 2006 2006 2006
Net charge-offs ratios (a)
Commercial .20 .31 .23 .18 .13
Lease financing .57 .22 .51 .23 .54
T otal commercial .25 .30 .26 .18 .18
Commercial mortgages .14 .02 .04 -- (.02)
Construction and develop ment .09 -- -- -- .05
T otal commercial real estate .13 .01 .03 -- --
Residential mortgages .28 .23 .22 .21 .21
Credit card 3.56 3.48 3.27 2.85 2.72
Retail leasing .24 .18 .23 .22 .11
Home equity and second mortgages .41 .42 .33 .31 .35
Other retail .89 .89 .96 .79 .77
T otal retail 1.15 1.10 1.05 .90 .84
T otal net charge-offs .53 .50 .47 .38 .36
Delinquent loan ratios - 90 day s or more p ast due e xcluding nonp erforming loans (b)
Commercial .07 .07 .05 .06 .05
Commercial real estate -- .04 .01 .01 --
Residential mortgages .50 .46 .45 .36 .30
Retail .48 .54 .48 .41 .39
T otal loans .26 .27 .24 .21 .19
Delinquent loan ratios - 90 day s or more p ast due including nonp erforming loans (b)
Commercial .44 .46 .57 .55 .58
Commercial real estate .69 .69 .53 .54 .40
Residential mortgages .69 .63 .62 .53 .49
Retail .55 .63 .58 .52 .52
T otal loans .57 .59 .57 .54 .51
(a) annualized and calculat ed on average loan balances
(b) rat ios are expressed as a percent of ending loan balances
(MORE)
16. U.S. Bancorp Reports Second Quarter 2007 Results
July 17, 2007
Page 16
AS S ET Q UALITY Table 10
($ in millions)
Jun 30 Mar 31 De c 31 S e p 30 Jun 30
2007 2007 2006 2006 2006
Nonp erforming loans
Commercial $128 $147 $196 $192 $203
Lease financing 44 41 40 39 38
T otal commercial 172 188 236 231 241
Commercial mortgages 90 114 112 114 88
Construction and develop ment 107 71 38 40 25
T otal commercial real estate 197 185 150 154 113
Residential mortgages 41 38 36 36 39
Retail 39 43 48 53 57
T otal nonp erforming loans 449 454 470 474 450
Other real estate 103 113 95 79 77
Other nonp erforming assets 13 15 22 22 23
T otal nonp erforming assets (a) $565 $582 $587 $575 $550
Accruing loans 90 day s or more p ast due $376 $397 $349 $295 $264
Restructured loans that continue
to accrue interest $435 $411 $405 $369 $370
Nonp erforming assets to loans
p lus ORE (%) .39 .40 .41 .40 .39
(a) does not include accruing loans 90 days or m ore past due or rest ruct ured loans t hat cont inue t o accrue int erest
Nonperforming assets at June 30, 2007, totaled $565 million, compared with $582 million at March
31, 2007, and $550 million at June 30, 2006. The ratio of nonperforming assets to loans and other real estate
was .39 percent at June 30, 2007, compared with .40 percent at March 31, 2007, and .39 percent at June 30,
2006. Restructured loans that continue to accrue interest have increased from the second quarter of 2006,
reflecting the impact of implementing higher minimum balance payment requirements for retail customers
and restructuring for residential mortgage customers in light of economic conditions. The Company expects
nonperforming assets to remain relatively stable or increase modestly over the next several quarters.
(MORE)
17. U.S. Bancorp Reports Second Quarter 2007 Results
July 17, 2007
Page 17
CAPITAL PO S ITIO N Table 11
($ in millions) Jun 30 Mar 31 De c 31 S e p 30 Jun 30
2007 2007 2006 2006 2006
T otal shareholders' equity $20,330 $20,800 $21,197 $20,926 $20,415
T ier 1 cap ital 16,876 16,917 17,036 17,042 16,841
T otal risk-based cap ital 25,709 25,826 24,495 25,011 24,893
T ier 1 cap ital ratio 8.5 % 8.6 % 8.8 % 8.8 % 8.9 %
T otal risk-based cap ital ratio 13.0 13.1 12.6 13.0 13.1
Leverage ratio 7.9 8.0 8.2 8.3 8.2
Common equity to assets 8.7 8.9 9.2 9.2 9.1
T angible common equity to assets 5.2 5.3 5.5 5.4 5.6
Total shareholders’ equity was $20.3 billion at June 30, 2007, compared with $20.8 billion at March
31, 2007, and $20.4 billion at June 30, 2006.
The Tier 1 capital ratio was 8.5 percent at June 30, 2007, compared with 8.6 percent at March 31,
2007, and 8.9 percent at June 30, 2006. The total risk-based capital ratio was 13.0 percent at June 30, 2007,
compared with 13.1 percent at March 31, 2007, and at June 30, 2006. The leverage ratio was 7.9 percent at
June 30, 2007, compared with 8.0 percent at March 31, 2007, and 8.2 percent at June 30, 2006. Tangible
common equity to assets was 5.2 percent at June 30, 2007, compared with 5.3 percent at March 31, 2007,
and 5.6 percent at June 30, 2006. All regulatory ratios continue to be in excess of stated “well-capitalized”
requirements.
(MORE)
18. U.S. Bancorp Reports Second Quarter 2007 Results
July 17, 2007
Page 18
CO MMO N S HARES Table 12
(M illions) 2Q 1Q 4Q 3Q 2Q
2007 2007 2006 2006 2006
Beginning shares outstanding 1,742 1,765 1,763 1,783 1,783
Shares issued for stock op tion and stock p urchase
p lans, acquisitions and other corp orate p urp oses 4 11 12 10 9
Shares rep urchased (18) (34) (10) (30) (9)
Ending shares outstanding 1,728 1,742 1,765 1,763 1,783
On August 3, 2006, the Company announced that the Board of Directors approved an authorization to
repurchase 150 million shares of common stock through December 31, 2008. During the second quarter of
2007, the Company repurchased 18 million shares of common stock. As of June 30, 2007, there were
approximately 70 million shares remaining to be repurchased under the current authorization.
(MORE)
19. U.S. Bancorp Reports Second Quarter 2007 Results
July 17, 2007
Page 19
LINE O F BUS INES S FINANCIAL PERFO RMANCE (a) Table 13
($ in millions)
Net Income Percent Change 2Q 2007
2Q 1Q 2Q 2Q 07 vs 2Q 07 vs YTD YTD Percent Earnings
Business Line 2007 2007 2006 1Q 07 2Q 06 2007 2006 Change Composition
Wholesale Banking $278 $275 $305 1.1 (8.9) $553 $612 (9.6) 24 %
Consumer Banking 456 435 488 4.8 (6.6) 891 901 (1.1) 39
Wealth M anagement 169 153 149 10.5 13.4 322 286 12.6 15
Pay ment Services 259 230 253 12.6 2.4 489 478 2.3 22
T reasury and Corp orate Sup p ort (6) 37 6 nm nm 31 77 (59.7) --
Consolidated Comp any $1,156 $1,130 $1,201 2.3 (3.7) $2,286 $2,354 (2.9) 100 %
(a) prelim inary dat a
Lines of Business
Within the Company, financial performance is measured by major lines of business, which include
Wholesale Banking, Consumer Banking, Wealth Management, Payment Services, and Treasury and
Corporate Support. These operating segments are components of the Company about which financial
information is available and is evaluated regularly in deciding how to allocate resources and assess
performance. Noninterest expenses incurred by centrally managed operations or business lines that directly
support another business line’s operations are charged to the applicable business line based on its utilization
of those services primarily measured by the volume of customer activities, number of employees or other
relevant factors. These allocated expenses are reported as net shared services expense within noninterest
expense. Designations, assignments and allocations change from time to time as management systems are
enhanced, methods of evaluating performance or product lines change or business segments are realigned to
better respond to the Company’s diverse customer base. During 2007, certain organization and methodology
changes were made and, accordingly, prior period results have been restated and presented on a comparable
basis.
Wholesale Banking offers lending, equipment finance and small-ticket leasing, depository, treasury
management, capital markets, foreign exchange, international trade services and other financial services to
middle market, large corporate, commercial real estate, and public sector clients. Wholesale Banking
contributed $278 million of the Company’s net income in the second quarter of 2007, an 8.9 percent
decrease from the same period of 2006 and a 1.1 percent increase as compared with the first quarter of 2007.
(MORE)
20. U.S. Bancorp Reports Second Quarter 2007 Results
July 17, 2007
Page 20
The decrease in Wholesale Banking’s second quarter of 2007 contribution from the same quarter of 2006
was the result of lower total net revenue (2.7 percent), higher total noninterest expense (4.8 percent) and an
increase in the provision for credit losses from a year ago. The decline in total net revenue was due to lower
net interest income partially offset by strong fee-based revenue. The decrease in net interest income was due
to tighter credit spreads and a decline in average noninterest-bearing deposit balances as customers utilized
their liquidity to fund business growth, partially offset by growth in average loan balances and the margin
benefit of deposits. Total noninterest income increased due to stronger treasury management fees driven by
higher transaction volumes and higher equity investment revenue. This growth was partially offset by a
decline in commercial products revenue related to capital markets fees. Total noninterest expense increased
due to higher compensation and benefits expense due to increasing the number of relationship managers,
production-based incentives and business growth initiatives. The unfavorable variance in the provision for
credit losses was due to a $12 million increase in net charge-offs in the second quarter of 2007 compared
with a year ago. The change in net charge-offs reflected fewer wholesale loan recoveries and an increase in
gross charge-offs at this stage of the business cycle.
Wholesale Banking’s contribution to net income in the second quarter of 2007 compared with the first
quarter of 2007 was $3 million (1.1 percent) higher due to a favorable variance in total net revenue (1.9
percent), partially offset by an increase in total noninterest expense. Total net revenue was higher on a
linked quarter basis due to strong fee-based income principally related to seasonally higher treasury
management fees from tax receipt processing. Total noninterest expense increased from the first quarter of
2007 due to an increase in net shared services expense due primarily to the increased processing expenses
from tax receipt volumes and higher credit-related costs from other real estate owned. The provision for
credit losses decreased on a linked quarter basis due to lower net charge-offs.
Consumer Banking delivers products and services through banking offices, telephone servicing and
sales, on-line services, direct mail and ATMs. It encompasses community banking, metropolitan banking,
in-store banking, small business banking, consumer lending, mortgage banking, consumer finance,
workplace banking, student banking, and 24-hour banking. Consumer Banking contributed $456 million of
the Company’s net income in the second quarter of 2007, a 6.6 percent decrease from the same period of
2006 and a 4.8 percent increase from the prior quarter. Within Consumer Banking, the retail banking
division contributed $428 million of the total contribution, a 5.9 percent decrease for the division on a year-
over-year basis and a 4.4 percent increase from the prior quarter. An increase in total net revenue for the
(MORE)
21. U.S. Bancorp Reports Second Quarter 2007 Results
July 17, 2007
Page 21
retail banking division was offset by an expected increase in the provision for credit losses and increased
total noninterest expense as compared with the same period of 2006. Total noninterest income for the retail
banking division increased from a year ago due to growth in deposit service charges of 3.0 percent due to
increased transaction-related fees and the impact of net new checking accounts and to an increase in other
fee revenue. Total noninterest expense in the second quarter of 2007 increased 5.5 percent for the division
compared with the same quarter of 2006. Compensation and employee benefits expense increased related to
recent acquisitions, branch expansion, production-based incentives and other business initiatives. In addition,
the line of business recognized higher costs for professional services caused by revenue enhancement
initiatives, credit-related costs associated with other real estate owned and customer fraud losses, partially
offset by a reduction in net shared services expense. The business line experienced a $22 million year-over-
year increase in net charge-offs (40.0 percent), reflecting higher levels of retail charge-offs. Bankruptcies
were generally lower in 2006 due to the lingering effects of changes in bankruptcy laws in late 2005. In the
second quarter of 2007, the mortgage banking division’s contribution was $28 million, a decrease of $5
million from the same period of 2006. This division’s total net revenue decreased $4 million (4.2 percent)
from a year ago primarily due to the impact of changes in the net MSR valuation and the related derivatives
utilized for managing interest rate valuation risk. Changes in interest rates late in the second quarter had an
adverse impact on these net MSR valuations. Total noninterest expense for the mortgage banking division
increased $4 million (9.3 percent) from the second quarter of 2006 primarily due to higher production levels
from a year ago and servicing costs associated with other real estate owned and foreclosures.
The increase in Consumer Banking’s contribution of $21 million (4.8 percent) in the second quarter of
2007 from the first quarter of 2007 was principally due to higher fee-based revenue in the retail banking
division. The retail banking division’s contribution increased by 4.4 percent on a linked quarter basis due to
an increase in deposit service charges principally due to higher transaction-related fees. Total noninterest
expense for the retail banking division on a linked quarter basis was essentially flat. The provision for credit
losses for the quarter reflected an $8 million increase in net charge-offs relative to the first quarter of 2007,
driven by commercial net charge-offs in the community banking sector and residential mortgages. The
contribution of the mortgage banking division increased $3 million from the first quarter of 2007 driven by
an increase in total net revenue that reflected an 18.7 percent increase in mortgage production gains and
servicing income as compared with the prior quarter, partially offset by an unfavorable valuation change in
MSR and the corresponding derivatives to economically hedge the servicing rights. Total noninterest
(MORE)
22. U.S. Bancorp Reports Second Quarter 2007 Results
July 17, 2007
Page 22
expense of the mortgage banking division increased $2 million (4.4 percent) from the first quarter of 2007
driven by production processing levels.
Wealth Management provides trust, private banking, financial advisory, investment management, retail
brokerage services, insurance, custody and mutual fund servicing through six businesses: Private Client
Group, Corporate Trust, U.S. Bancorp Investments and Insurance, FAF Advisors, Institutional Trust and
Custody and Fund Services. Wealth Management contributed $169 million of the Company’s net income in
the second quarter of 2007, a 13.4 percent increase over the same period of 2006 and a 10.5 percent increase
from the first quarter of 2007. The growth in the business line’s contribution in the second quarter of 2007
over the same quarter of 2006 was the result of core account fee growth and improved equity market
conditions relative to a year ago. Net interest income was unfavorably impacted year-over-year by changes
in deposit pricing and tightening credit spreads, partially offset by earnings from deposit growth. Total
noninterest expense declined slightly (1.2 percent) from the same quarter of 2006 principally due to the
benefit of cost savings from business integration activities.
The increase in the business line’s contribution in the second quarter of 2007 as compared with the first
quarter of 2007 was due to an increase in noninterest income driven by seasonally higher tax-related fees,
core account growth and favorable equity market conditions.
Payment Services includes consumer and business credit cards, stored-value cards, debit cards,
corporate and purchasing card services, consumer lines of credit, ATM processing and merchant processing.
Payment Services contributed $259 million of the Company’s net income in the second quarter of 2007, a
2.4 percent increase over the same period of 2006 and a 12.6 percent increase from the first quarter of 2007.
Strong growth in income before provision and income taxes of 10.0 percent from a year ago was partially
offset by an expected increase in the provision for credit losses (55.4 percent). The increase in total net
revenue year-over-year was due to growth in total noninterest income (12.1 percent) and net interest income
(6.4 percent), reflecting growth in higher yielding retail loan balances, partially offset by the margin impact
of growth in nonearning assets related to recent acquisitions and a declining yield on retail credit cards. All
revenue categories benefited from account growth, higher transaction volumes and business expansion
initiatives. The growth in total noninterest expense year-over-year primarily reflected new business
initiatives, including costs associated with marketing programs and acquisitions, as well as higher collection
costs. The increase in the provision for credit losses was driven by an increase in net charge-offs of $36
(MORE)
23. U.S. Bancorp Reports Second Quarter 2007 Results
July 17, 2007
Page 23
million year-over-year reflecting portfolio growth, the impact of fully implementing minimum balance
payment requirements and the favorable effects in the prior year of changes in bankruptcy laws.
The increase in Payment Services’ contribution in the second quarter of 2007 from the first quarter of
2007 was due to higher total net revenue (8.7 percent), partially offset by a higher total noninterest expense
(4.8 percent) and provision for credit losses (8.6 percent). Total net revenue was higher due to an 11.4
percent increase in total noninterest income, reflecting seasonally higher sales volumes, account growth and
pricing initiatives. An increase in total noninterest expense was primarily due to the timing of marketing and
professional services costs from retail payment systems and other business expansion initiatives. The
increase also reflected slightly higher collection costs and processing expenses related to incremental
merchant processing volumes.
Treasury and Corporate Support includes the Company’s investment portfolios, funding, capital
management and asset securitization activities, interest rate risk management, the net effect of transfer
pricing related to average balances and the residual aggregate of those expenses associated with corporate
activities that are managed on a consolidated basis. Treasury and Corporate Support recorded a net loss of
$6 million in the second quarter of 2007, compared with net income of $6 million in the second quarter of
2006 and $37 million in the first quarter of 2007. Net interest income decreased in the current quarter from
the second quarter of 2006 by $18 million, reflecting the adverse impact of a flat yield curve and the mix of
higher cost wholesale funding to support earning asset growth. Total noninterest income decreased $32
million due principally to the $35 million gain from the initial public offering of a card association in the
second quarter of 2006. Total noninterest expense increased $24 million year-over-year reflecting an
increase in costs related to tax-advantaged investments, guarantee liabilities associated with expanding the
airline merchant business and conversion-related costs. These increases were partially offset by an $11
million debt prepayment charge recorded in the second quarter of 2006. The favorable change in income
taxes, compared with a year ago, resulted from incremental investment in tax-exempt municipal securities,
tax-advantaged investments and expansion of a bank-owned life insurance program.
Net income in the second quarter of 2007 was lower than the first quarter of 2007 due to a decrease
in total net revenue and an unfavorable variance in total noninterest expense, partially offset by a favorable
change in income taxes. Net interest income decreased primarily due to the higher cost of wholesale funding
and specific management decisions, including expanding the bank-owned life insurance program. Total
noninterest expense increased by $57 million primarily due to seasonally higher incentive expense and
(MORE)
24. U.S. Bancorp Reports Second Quarter 2007 Results
July 17, 2007
Page 24
professional services expenses related to the establishment of the bank in Ireland. In addition, costs
associated with tax-advantaged investments, merchant airline liabilities and business conversions increased
on a linked quarter basis. The residual tax benefits recognized by the Treasury and Corporate Support
business line increased during the second quarter of 2007 primarily due to higher levels of tax credits related
to tax-advantaged investments and the expansion of a bank-owned life insurance program.
Additional schedules containing more detailed information about the Company’s business line results are
available on the web at usbank.com or by calling Investor Relations at 612-303-0781.
(MORE)
25. U.S. Bancorp Reports Second Quarter 2007 Results
July 17, 2007
Page 25
RICHARD K. DAVIS, PRESIDENT AND CHIEF EXECUTIVE OFFICER, AND ANDREW
CECERE, VICE CHAIRMAN AND CHIEF FINANCIAL OFFICER, WILL HOST A
CONFERENCE CALL TO REVIEW THE FINANCIAL RESULTS AT 1:00 P.M. (CDT) ON
TUESDAY, JULY 17, 2007. The conference call will be available by telephone or on the internet. To
access the conference call, please dial 800-896-8445 and ask for the U.S. Bancorp earnings conference
call. Participants calling from outside the United States, please dial 785-830-1916. For those unable to
participate during the live call, a recording of the call will be available approximately one hour after
the conference call ends on Tuesday, July 17th, and will run though Tuesday, July 24th, at 11:00 p.m.
(CDT). To access the recorded message dial 800-677-7085. If calling from outside the United States,
please dial 402-220-0665 to access the recording. Find the recorded call via the internet at
usbank.com.
Minneapolis-based U.S. Bancorp (“USB”), with $223 billion in assets, is the 6th largest financial holding
company in the United States. The Company operates 2,499 banking offices and 4,867 ATMs in 24 states,
and provides a comprehensive line of banking, brokerage, insurance, investment, mortgage, trust and
payment services products to consumers, businesses and institutions. U.S. Bancorp is the parent company of
U.S. Bank. Visit U.S. Bancorp on the web at usbank.com.
Forward-Looking Statements
The following information appears in accordance with the Private Securities Litigation Reform Act of 1995:
This press release contains forward-looking statements about U.S. Bancorp. Statements that are not
historical or current facts, including statements about beliefs and expectations, are forward-looking
statements. These statements often include the words “may,” “could,” “would,” “should,” “believes,”
“expects,” “anticipates,” “estimates,” “intends,” “plans,” “targets,” “potentially,” “probably,” “projects,”
“outlook” or similar expressions. These forward-looking statements cover, among other things, anticipated
future revenue and expenses and the future plans and prospects of the Company. Forward-looking
statements involve inherent risks and uncertainties, and important factors could cause actual results to differ
materially from those anticipated, including changes in general business and economic conditions, changes
in interest rates, legal and regulatory developments, increased competition from both banks and non-banks,
changes in customer behavior and preferences, effects of mergers and acquisitions and related integration,
effects of critical accounting policies and judgments, and management’s ability to effectively manage credit
risk, market risk, operational risk, legal risk, and regulatory and compliance risk. For discussion of these and
other risks that may cause actual results to differ from expectations, refer to our Annual Report on Form 10-
K for the year ended December 31, 2006, on file with the Securities and Exchange Commission, including
the sections entitled “Risk Factors” and “Corporate Risk Profile.” Forward-looking statements speak only as
of the date they are made, and the Company undertakes no obligation to update them in light of new
information or future events.
###
(MORE)
26. U.S. Bancorp
Consolidated Statement of Income
Three Months Ended Six Months Ended
(Dollars and Shares in Millions, Except Per Share Data) June 30, June 30,
(Unaudited) 2007 2006 2007 2006
Interest Income
Loans $2,616 $2,425 $5,194 $4,732
Loans held for sale 70 57 129 108
Investment securities 516 500 1,032 990
Other interest income 34 36 68 79
Total interest income 3,236 3,018 6,423 5,909
Interest Expense
Deposits 663 578 1,338 1,081
Short-term borrowings 379 270 707 540
Long-term debt 562 484 1,097 887
Total interest expense 1,604 1,332 3,142 2,508
Net interest income 1,632 1,686 3,281 3,401
Provision for credit losses 191 125 368 240
Net interest income after provision for credit losses 1,441 1,561 2,913 3,161
Noninterest Income
Credit and debit card revenue 228 202 433 384
Corporate payment products revenue 157 139 302 266
ATM processing services 62 61 121 120
Merchant processing services 285 253 535 466
Trust and investment management fees 342 314 664 611
Deposit service charges 272 264 515 496
Treasury management fees 126 116 237 223
Commercial products revenue 105 107 205 211
Mortgage banking revenue 68 75 135 99
Investment products fees and commissions 38 42 72 80
Securities gains (losses), net 3 3 4 3
Other 169 179 328 410
Total noninterest income 1,855 1,755 3,551 3,369
Noninterest Expense
Compensation 659 627 1,294 1,260
Employee benefits 123 123 256 256
Net occupancy and equipment 171 161 336 326
Professional services 59 41 106 76
Marketing and business development 64 58 112 98
Technology and communications 126 127 251 244
Postage, printing and supplies 71 66 140 132
Other intangibles 95 89 189 174
Debt prepayment -- 11 -- 11
Other 272 227 501 453
Total noninterest expense 1,640 1,530 3,185 3,030
Income before income taxes 1,656 1,786 3,279 3,500
Applicable income taxes 500 585 993 1,146
Net income $1,156 $1,201 $2,286 $2,354
Net income applicable to common equity $1,141 $1,184 $2,256 $2,337
Earnings per common share $.66 $.66 $1.29 $1.30
Diluted earnings per common share $.65 $.66 $1.27 $1.29
Dividends declared per common share $.40 $.33 $.80 $.66
Average common shares outstanding 1,736 1,781 1,744 1,791
Average diluted common shares outstanding 1,760 1,805 1,770 1,816
Page 26
27. U.S. Bancorp
Consolidated Ending Balance Sheet
June 30, December 31, June 30,
(Dollars in Millions) 2007 2006 2006
Assets (Unaudited) (Unaudited)
Cash and due from banks $6,534 $8,639 $7,234
Investment securities
Held-to-maturity 81 87 98
Available-for-sale 39,433 40,030 38,364
Loans held for sale 4,552 3,256 3,992
Loans
Commercial 46,459 46,190 45,369
Commercial real estate 28,421 28,645 28,562
Residential mortgages 21,992 21,285 21,063
Retail 48,836 47,477 44,985
Total loans 145,708 143,597 139,979
Less allowance for loan losses (2,028) (2,022) (2,039)
Net loans 143,680 141,575 137,940
Premises and equipment 1,798 1,835 1,817
Goodwill 7,593 7,538 7,283
Other intangible assets 3,352 3,227 3,158
Other assets 15,507 13,045 13,519
Total assets $222,530 $219,232 $213,405
Liabilities and Shareholders' Equity
Deposits
Noninterest-bearing $29,545 $32,128 $30,730
Interest-bearing 70,216 70,330 69,302
Time deposits greater than $100,000 19,941 22,424 22,687
Total deposits 119,702 124,882 122,719
Short-term borrowings 27,160 26,933 20,570
Long-term debt 45,946 37,602 41,952
Other liabilities 9,392 8,618 7,749
Total liabilities 202,200 198,035 192,990
Shareholders' equity
Preferred stock 1,000 1,000 1,000
Common stock 20 20 20
Capital surplus 5,748 5,762 5,789
Retained earnings 22,110 21,242 20,164
Less treasury stock (7,476) (6,091) (5,421)
Other comprehensive income (1,072) (736) (1,137)
Total shareholders' equity 20,330 21,197 20,415
Total liabilities and shareholders' equity $222,530 $219,232 $213,405
Page 27
29. U.S. Bancorp
Income Statement Highlights
Percent Change
Three Months Ended v. June 30, 2007
(Dollars and Shares in Millions, Except Per Share Data) June 30, March 31, June 30, March 31, June 30,
(Unaudited) 2007 2007 2006 2007 2006
Net interest income (taxable-equivalent basis) $1,650 $1,666 $1,697 (1.0) % (2.8) %
Noninterest income 1,855 1,696 1,755 9.4 5.7
Total net revenue 3,505 3,362 3,452 4.3 1.5
Noninterest expense 1,640 1,545 1,530 6.1 7.2
Income before provision and income taxes 1,865 1,817 1,922 2.6 (3.0)
Provision for credit losses 191 177 125 7.9 52.8
Income before income taxes 1,674 1,640 1,797 2.1 (6.8)
Taxable-equivalent adjustment 18 17 11 5.9 63.6
Applicable income taxes 500 493 585 1.4 (14.5)
Net income $1,156 $1,130 $1,201 2.3 (3.7)
Net income applicable to common equity $1,141 $1,115 $1,184 2.3 (3.6)
Diluted earnings per common share $.65 $.63 $.66 3.2 (1.5)
Revenue per diluted common share (a) $1.99 $1.89 $1.91 5.3 4.2
Financial Ratios
Net interest margin (b) 3.44 % 3.51 % 3.68 %
Interest yield on average loans (b) 7.22 7.23 7.00
Rate paid on interest-bearing liabilities (b) 3.95 3.88 3.45
Return on average assets 2.09 2.09 2.27
Return on average common equity 23.0 22.4 24.3
Efficiency ratio (c) 46.8 46.0 44.4
Tangible efficiency ratio (d) 44.1 43.2 41.8
(a) Computed as the sum of net interest income on a taxable-equivalent basis and noninterest income excluding securities gains
(losses), net divided by average diluted common shares outstanding
(b) On a taxable-equivalent basis
(c) Computed as noninterest expense divided by the sum of net interest income on a taxable-equivalent basis and noninterest income
excluding securities gains (losses), net
(d) Computed as noninterest expense divided by the sum of net interest income on a taxable-equivalent basis and noninterest income
excluding securities gains (losses), net and intangible amortization
Page 29
30. U.S. Bancorp
Income Statement Highlights
Six Months Ended
(Dollars and Shares in Millions, Except Per Share Data) June 30, June 30, Percent
(Unaudited) 2007 2006 Change
Net interest income (taxable-equivalent basis) $3,316 $3,422 (3.1) %
Noninterest income 3,551 3,369 5.4
Total net revenue 6,867 6,791 1.1
Noninterest expense 3,185 3,030 5.1
Income before provision and income taxes 3,682 3,761 (2.1)
Provision for credit losses 368 240 53.3
Income before income taxes 3,314 3,521 (5.9)
Taxable-equivalent adjustment 35 21 66.7
Applicable income taxes 993 1,146 (13.4)
Net income $2,286 $2,354 (2.9)
Net income applicable to common equity $2,256 $2,337 (3.5)
Diluted earnings per common share $1.27 $1.29 (1.6)
Revenue per diluted common share (a) $3.88 $3.74 3.7
Financial Ratios
Net interest margin (b) 3.47 % 3.74 %
Interest yield on average loans (b) 7.23 6.90
Rate paid on interest-bearing liabilities (b) 3.91 3.28
Return on average assets 2.09 2.25
Return on average common equity 22.7 23.8
Efficiency ratio (c) 46.4 44.6
Tangible efficiency ratio (d) 43.7 42.1
(a) Computed as the sum of net interest income on a taxable-equivalent basis and noninterest income excluding securities gains
(losses), net divided by average diluted common shares outstanding
(b) On a taxable-equivalent basis
(c) Computed as noninterest expense divided by the sum of net interest income on a taxable-equivalent basis and noninterest income
excluding securities gains (losses), net
(d) Computed as noninterest expense divided by the sum of net interest income on a taxable-equivalent basis and noninterest income
excluding securities gains (losses), net and intangible amortization
Page 30