2. Selected Financial Data
Dollar amounts in millions, except per-share amounts
For the years ended December 31, 2004 2003 2002 2001
2005
Results of Operations(a)
Net sales $ 11,368 $ 9,240 $ 7,247 $ 8,012
$ 15,208
Income from continuing operations $ 2,606 $ 1,601 $ 1,181 $ 1,182
$ 5,272
Net income $ 2,568 $ 1,527 $ 989 $ 1,154
$ 5,281
Basic earnings per common share
from continuing operations $ 6.59 $ 4.17 $ 3.14 $ 3.17
$ 13.07
Basic earnings per common share $ 6.49 $ 3.98 $ 2.63 $ 3.10
$ 13.09
Diluted earnings per common share $ 6.40 $ 3.93 $ 2.61 $ 3.09
$ 12.91
Core earnings $ 2,499 $ 1,641 $ 1,017 $ 1,249
$ 3,964
(b)
Financial Position (a)
Total assets $ 21,391 $ 18,168 $ 16,548 $ 17,850
$ 26,108
Long-term debt, net and
trust preferred securities(c) $ 3,345 $ 4,446 $ 4,452 $ 4,528
$ 2,873
Common stockholders’ equity $ 10,550 $ 7,929 $ 6,318 $ 5,634
$ 15,032
Market Capitalization $ 23,153 $ 16,349 $ 10,750 $ 9,926
$ 32,129
Cash Flow
Cash provided by operating activities $ 3,878 $ 3,074 $ 2,100 $ 2,566
$ 5,337
Capital expenditures $ (1,843) $ (1,600) $ (1,234) $ (1,305)
$ (2,423)
Cash (used) provided by all other
investing activities, net $ (585) $ (531) $ (462) $ 654
$ (738)
Dividends Per Common Share $ 1.10 $ 1.04 $ 1.00 $ 1.00
$ 1.29
Basic Shares Outstanding (thousands) 395,580 383,943 376,190 372,119
403,300
(a) See the MD&A section of this report and the “Notes to Consolidated Financial Statements” for information regarding accounting changes,
asset acquisitions and dispositions, discontinued operations, environmental remediation, other costs and other items affecting comparability.
(b) For an explanation of core earnings, see “Significant Items Affecting Earnings” in the MD&A section of this report.
(c) On January 20, 2004, Occidental redeemed the trust preferred securities.
Portions of this report contain forward-looking statements and involve risks and uncertainties that could materially affect expected results
of operations, liquidity, cash flows and business prospects. Words such as “estimate,” “project,” “predict,” “will,” “anticipate,” “plan,”
“intend,” “believe,” “expect” or similar expressions that convey the uncertainty of future events or outcomes generally identify forward-
looking statements. You should not place undue reliance on these forward-looking statements, which speak only as of the date of this
report. Unless legally required, Occidental expressly disclaims any obligation to publicly update or revise any forward-looking statements,
as a result of new information, future events or otherwise.
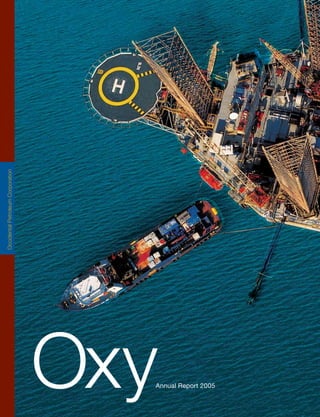
ON THE cOvEr:
A Dolphin Energy Limited drilling rig in Qatar’s North Field. Occidental holds a 24.5-percent interest in the Dolphin Project,
a premier transborder natural gas project that will bring 2 billion cubic feet of natural gas per day from Qatar to markets in
the United Arab Emirates.
3. Oxy in Brief
16
3
1
10
2
4
5 14 13 15
11 12
6
7
8
9
1. Elk Hills 7. Ecuador 13. United Arab Emirates
2. Long Beach 8. Bolivia 14. Qatar
3. Hugoton 9. Argentina 15. Pakistan
4. Permian Basin 10. Libya 16. Russia
5. Horn Mountain 11. Yemen
6. Colombia 12. Oman
Occidental Petroleum Corporation (NYSE: OXY) is a world leader in oil and
natural gas exploration and production, and a major North American chemical
manufacturer. With oil and natural gas operations in the United States, the
Middle East – North Africa region and Latin America, Occidental is helping to
meet the world’s energy needs.
In the United States, Occidental is the largest oil producer in Texas and the largest natural gas producer
in California, with additional operations in Kansas, Oklahoma and New Mexico. Occidental also has
an interest in a single non-operated property in the Gulf of Mexico. In the Middle East – North Africa,
Occidental has assets in Libya, Oman, Qatar, Yemen and is a partner in the transborder Dolphin Project
that will supply natural gas from Qatar to markets in the United Arab Emirates. Our Latin American
operations include producing assets in Argentina, Bolivia, Colombia and Ecuador. In addition, the
company has assets in Russia and Pakistan.
Occidental Chemical Corporation (OxyChem) manufactures vinyls and specialty chemical products
in addition to chlorine and caustic soda — the building blocks for such indispensable products as
pharmaceuticals, water disinfectants, detergents and others.
Worldwide, Occidental is committed to safeguarding the environment, protecting the safety and health of
employees and neighboring communities and upholding the highest standards of social responsibility.
4. Return on Equity
Net Income
Stated as Percent
$ in Billions
41
17 21 28
5.3
1.0 1.5 2.6
41.000
5.300000
35.875
4.416667
30.750
3.533333
25.625
20.500
2.650000
15.375
1.766667
10.250
0.883333
5.125
0.000
0.000000
2002
2003
2004
2005
2002
2003
2004
2005
Dr. Ray R. Irani
Chairman, President and Chief Executive Officer
Report to Stockholders
2005 was another record-setting year for Occidental as net income, operating cash
flow and year-end proved oil and gas reserves again reached new highs. Occidental
and our stockholders continued to reap the benefits from management’s execution
of its long-term strategy to generate top quartile financial returns among our oil and
gas industry peers. While the industry as a whole has benefited from high commodity
prices, Occidental has outperformed its competitors in capturing the value of high
prices on an equivalent barrel of production basis and delivering it to the bottom line.
In addition to positioning the oil and gas segment reserve replacement high; and (5) generating top
for sustainable growth and profitability, we took quartile returns on equity and capital employed.
steps to strengthen the chemical segment that The results of these collaborative efforts are
enable us to benefit from improving margins in a evident in the company’s overall performance.
growing global economy.
M a r k e t Pe r f o rMa n c e
Above all, our strong performance is a testimonial Occidental’s year-end closing stock price of $79.88
to the combined efforts of our board of directors, per share was the highest year-end stock price in
management team and global work force in the company’s history. Our 2005 total return to
creating significant long-term value for our stock- stockholders, based on stock price appreciation
holders. Everyone in our organization, from plus dividend reinvestment, was 39 percent. Over
employees turning valves in the field to the senior the past five years, Occidental’s total return to
executives, is focused on the key metrics that drive stockholders of 279 percent substantially outper-
our performance: (1) optimizing profit and free formed the total return of 166 percent recorded by
cash flow for every equivalent barrel we produce; the Standard & Poor’s 500 Oil and Gas Exploration
(2) controlling costs; (3) maintaining top quartile oil and Production Index and 59 percent by the
and gas finding and development costs; (4) keeping Standard & Poor’s 500 Oil and Gas Integrated Index.
2 Occidental Petroleum Corporation
5. Return on Capital Common Stockholders’
Total Debt
Debt-to-Capitalization
Employed* Stated as Percent Equity $ in Billions
Ratio Stated as Percent $ in Billions
33 7.9 10.6 15.0
3.0
17
11 15 20 6.3
4.8 4.6 3.9
43 37 27
15
4.80
12
3.84
34.400002
9
2.88
25.800001
6
1.92
17.200001
3
0.96
8.600000
0
0.00
0.000000
2002
2003
2004
2005
2002
2003
2004
2005
2002
2003
2004
2005
2002
2003
2004
2005
* OCEisearningsbeforeinterestexpenseandtaxeffectofinterestexpenseoverstockholders’equityplusaveragetotaldebt.
R
the total. We expect capital expenditures to rise
f inancial Perfo r M a n c e
Occidental’s strong operational and financial by approximately $700 million in 2006, an increase
performance in 2005 resulted in net income and of 29 percent over the 2005 level, driven by the
operating cash flow rising to record highs for the large number of excellent growth projects in our
third consecutive year. Consolidated net income portfolio. Maintaining discipline in the investment
increased to $5.3 billion, more than double our of capital is critical to producing top quartile
record results in 2004 of $2.6 billion. Cash flow financial returns.
from operations rose to $5.3 billion, up 38 percent
Our 2005 return on capital employed was
from 2004. Total debt was reduced by nearly
33 percent, and the three-year average from 2003
$900 million, from $3.9 billion at year-end 2004
through 2005 was 23 percent. Our return on
to $3.0 billion at the end of 2005 — a reduction
equity in 2005 was 41 percent, and the three-
of 23 percent. Interest expense for 2005, excluding
year average was 31 percent. During that same
debt repayment charges, was $159 million,
three-year period, our stockholders’ equity grew
compared to $223 million in 2004. At year-end
by 138 percent — from $6.3 billion to $15 billion.
2005, Occidental had approximately $2.4 billion
of cash on hand. The strength of our balance In October 2005, the board of directors increased
sheet led each of the four major rating agencies the quarterly dividend to $0.36 per share, for
to upgrade our credit rating to the “single A” level. an annual rate of $1.44 per share, compared
Our strong balance sheet enhances our ability to the previous annual rate of $1.24 per share.
to compete successfully for large international Occidental has paid quarterly cash dividends
growth projects. without interruption since 1975. We will
continue to evaluate our dividend policy at least
Capital expenditures for 2005 were $2.4 billion,
annually and continue to look favorably upon
compared to $1.8 billion in 2004. The oil and gas
additional increases commensurate with manage-
segment accounted for more than 90 percent of
ment’s long-term free cash flow outlook.
3
Annual Report 2005
6. Oil Natural Gas Production* Oil Natural Gas Proved Reserves*
Million BOE
Thousand BOE/Day
2,241 2,311 2,471 2,532 2,707
568
476 515 547 566
2707.000000
568
497
2255.833333
426
1804.666667
355
1353.500000
284
213
902.333333
142
451.166667
71
0.000000
0
543 556 667 688 681 International
223 International
161 189 202 227
1,698 1,755 1,804 1,844 2,026 U.S.
345 U.S.
315 326 345 339
2001
2001
2002
2003
2004
2005
2002
2003
2004
2005
* ncludesconsolidatedsubsidiariesandinvestmentsinotherinterests.
I
Oil Gas In 2005, we continued adding proved oil and gas
reserves well ahead of production. Occidental’s
oPe rat i o n s Pe r f o rM a n c e
consolidated subsidiaries produced approximately
Oil and gas segment earnings for the year were
199 million BOE in 2005 while adding 380 million
a record $6.3 billion, 47 percent higher than the
BOE of proved reserves from all sources, for a
previous record in 2004. The improvement was
production replacement rate of 191 percent. At
mainly the result of higher combined oil and gas
year-end 2005, Occidental’s total worldwide
prices. Oil and gas income on a barrel of oil
proved reserves rose to a record 2.71 billion BOE.
equivalent (BOE) basis — after taxes and before
interest expense — was $20.01, which we believe The completion of the acquisition of Vintage
will place Occidental in the top quartile of large Petroleum in January 2006 increased Occidental’s
capitalization oil and gas industry peers for the worldwide pro forma proved reserves by 342 million
seventh consecutive year. BOE, excluding approximately 72 million BOE of
Vintage reserves held for sale, to a record 3.05
Worldwide oil and natural gas production averaged
billion BOE. The United States accounted for
568,000 BOE per day in 2005, or a total of 207
69 percent of the total, followed by the Middle East
million BOE for the year, which was slightly higher
with 16 percent, Latin America with 13 percent
than in 2004. Our oil and gas production for the
and 2 percent for other operations.
fourth quarter 2005 averaged a quarterly record
high of 589,000 equivalent barrels per day, up United States In 2005, Occidental produced an
4.8 percent from the third quarter and 5.6 percent average of approximately 345,000 BOE per day
from the fourth quarter 2004. The improvement in our U.S. operations, or 61 percent of our total
in the fourth quarter reflects a full quarter of worldwide production. The largest operation is in
production from Libya, the start up of the Mukhaizna the Permian Basin of West Texas and Southeastern
project and the resumption of full production at New Mexico, which averaged 189,000 BOE per
Horn Mountain in the Gulf of Mexico in the wake day, or 33 percent of our worldwide production.
of the hurricanes. Production from California averaged about
4 Occidental Petroleum Corporation
7. Mukhaizna Sirte Basin, Permian Basin,
project, Oman Libya United States
Left: Safah Field, Oman
116,000 BOE per day, which was 20 percent of Libya contributed an average of 8,000 BOE per
the worldwide total. The other domestic operations day to Occidental’s 2005 net worldwide production,
averaged about 40,000 BOE per day. which reflects an annualized rate for the partial year
of operations. During the fourth quarter 2005,
In May 2005, Occidental acquired oil and gas
Occidental’s net production from Libya averaged
producing assets from ExxonMobil in the Permian
24,000 BOE per day. Occidental’s total exploration
Basin. This strategic acquisition, together with two
and production acreage in Libya encompasses an
smaller acquisitions completed in the first quarter
area of approximately 130,000 square kilometers,
of 2005, further strengthened Occidental’s industry-
making Occidental the largest net holder of oil and
leading position in the Permian Basin and is
gas acreage in the country.
consistent with our strategy of focusing on large,
long-lived assets in our core geographic areas. In March 2005, Occidental and its partners signed
agreements with Libya’s National Oil Company for
Middle East – North Africa Occidental’s net
nine of the 15 exploration blocks awarded in the
2005 production from our Middle East – North
EPSA-4 oil and gas licensing round in January.
Africa operations averaged 103,000 BOE per
Occidental is the operator and holds a 90-percent
day and accounted for 18 percent of our total
exploration working interest in onshore Blocks 106
worldwide production.
and 124 in the Sirte Basin, Blocks 131 and 163
in the Murzuk Basin and Block 59 in the Cyrenaica
In late September 2005, Occidental had its first
Basin. Liwa Energy, owned by the Government
lifting of Libyan crude oil after resuming operations
of the Emirate of Abu Dhabi, holds the remaining
in July in its historical Libyan contract areas.
10-percent interest. Occidental is currently
Occidental was required to leave its oil exploration
gathering and processing seismic data and
and production operations in the prolific Sirte
expects to drill three to five exploration wells in
Basin in 1986 when the U.S. government barred
areas 106 and 124 in the second half of 2006.
American companies from doing business in Libya.
Occidental also holds a 35-percent exploration
During the interim, the producing properties have
working interest in offshore Blocks 35, 36, 52
been operated by a subsidiary of Libya’s National
and 53, with Liwa holding a 10-percent share.
Oil Corporation.
5
Annual Report 2005
8. “Occidental’s position in Latin America is significantly
enhanced with the acquisition of Vintage Petroleum.
Vintage has a sizeable operation in Argentina with
substantial growth potential as well as a much smaller
position in Bolivia. Production from the former Vintage
properties in Argentina averaged approximately 37,000
BOE per day in December 2005.”
The Australian company, Woodside Petroleum Ltd., two billion cubic feet per day of natural gas from
has a 55-percent interest and is the operator for Qatar’s giant North Field and the construction of
these offshore blocks. related processing facilities in Qatar. The other
entails construction of the new 48-inch diameter,
In July 2005, the Sultanate of Oman approved a
260-mile long Dolphin Energy Pipeline to transport
contract for Occidental and its partners to develop
the gas from Qatar to markets in the United Arab
the giant Mukhaizna oil field, one of the largest
Emirates. As the production from Dolphin ramps up
oilfields in Oman. Under the terms of a new
to its peak, Occidental’s net share is expected to be
Production Sharing Contract, Occidental will be
in the range of 55,000 to 60,000 BOE per day.
operator of the field and hold a 45-percent interest.
Located in central Oman, the Mukhaizna field was Latin America Our 2005 production from Colombia
discovered in 1975 by Petroleum Development and Ecuador averaged 74,000 barrels of oil per
Oman (PDO). When Occidental became operator day. In September 2005, Occidental signed an
of the field in September 2005, the field was agreement with Colombia’s national oil company,
producing approximately 8,500 barrels of oil per Ecopetrol, for an enhanced oil recovery (EOR)
day. Occidental and its partners expect to invest project in Colombia’s oldest and largest oil field,
more than $3 billion to implement a large-scale La Cira-Infantas. If this phased project is successful,
steam flood to increase gross production to Occidental could recover approximately 80 million
approximately 150,000 barrels per day within the net barrels of reserves at full development, with net
next few years and to recover an estimated one production rising to 20,000 BOE per day by 2010.
billion barrels of oil over the life of the project. At
Occidental’s position in Latin America is signifi-
peak production, Occidental’s net share is expected
cantly enhanced with the acquisition of Vintage
to average 30,000 barrels per day.
Petroleum. Vintage has a sizeable operation in
Work on the $4 billion Dolphin Project, the premier Argentina with substantial growth potential as well
transborder natural gas project in the Middle East, as a much smaller position in Bolivia. Production
is proceeding on schedule toward a projected start from the former Vintage properties in Argentina
up in late 2006. Occidental has a 24.5-percent averaged approximately 37,000 BOE per day in
interest. There are two components of this project. December 2005.
One involves the initial development of approximately
6 Occidental Petroleum Corporation
10. Employee Recordable Injury Illness Trend*
Rate Per 100 Employees
Average of all U.S. industries
7.40 7.10 6.70 6.30 6.10 5.70 5.30 5.00 4.80
Muscat, Oman
0.88 0.73 0.68 0.65 0.83 0.69 0.62 0.68 0.34 0.47 Occidental
1996
1997
1998
1999
2000
2001
2002
2003
2004
2005
* heUSindustrydatafor2005arenotyetavailable.
T
Average of all industries in 2004: 4.8
chemicals among the lowest of all U.S. industries. We are
committed to maintaining a safe workplace by
oPerat i o n s Pe r f o rM a n c e
continuously evaluating our management systems
Our chemical earnings of $607 million were
to ensure our world-class safety standards remain
47 percent higher than in 2004. The increase
on the cutting edge.
was due to continued improvement in most
sectors of the economy in which the company’s Occidental’s environmental and safety programs
core products are sold, particularly the building continue to receive international recognition.
and construction markets. Improved economic We were honored by the U.S. Environmental
growth resulted in a tightening of supplies for our Protection Agency as the International Partner
major products, leading to margin improvement of the Year for the Natural Gas STAR program.
through the year as higher prices more than offset This honor was bestowed on Occidental for
increased energy and feedstock costs. In addition, helping the EPA promote emission reductions
our core chemical business was strengthened by of methane (a greenhouse gas) in South American
the acquisition of two chlor-alkali (chlorine and countries by coordinating an international
co-product caustic soda) plants from Vulcan conference in Bogotá, Colombia. Occidental’s
Materials Company, which increased Occidental’s Texas operations were honored with the Nature
annual chlor-alkali capacity by 23 percent to Conservancy’s Leadership Award for implementing
3.3 million tons. environmentally protective operational practices
and assisting in habitat restoration programs
Health, Environment and Safety (at Mad Island Marsh Preserve). In addition,
Responsible HES management is one of our highest OxyChem received one of the chemical industry’s
priorities. Occidental has comprehensive systems most prestigious awards, the American Chemistry
in place to protect the environment and the health Council’s Responsible Care® Leadership Award,
and safety of employees, contractors, neighbors presented annually to a company that demonstrates
and customers. Our 2005 Employee Injury and sustained safety and environmental excellence.
Illness Incidence Rate (IIR) was 0.47, which was
8 Occidental Petroleum Corporation
11. Oxy Oman’s Mad Island
health clinic Marsh Preserve, Texas
Left: OxyChem’s Taft, Louisiana plant
corporate Social responsibility Whether in the U.S. or in the emerging economies
of our international locations, it is Occidental’s
Occidental strives to maintain a desirable presence
policy to be a responsible business partner
and be a positive influence in every community
and a “good neighbor” engaged in promoting
where we operate. Our businesses help promote
community, educational, environmental and
economic development and improve the overall
human rights advances.
quality of life in these communities by providing
well-paying jobs, broader opportunities, the
Looking Ahead
transfer of technical knowledge and expertise,
We have a pipeline of short- and medium-term
revenue through payroll and tax dollars and
projects with a portfolio of high quality assets that
community support.
will keep our combined oil and gas production
In 2005, we made excellent progress in growing at a sustainable annual rate between
implementing our new corporate-wide human 5 and 7 percent. We expect our base production
rights policy. As of December 2005, we have in 2010 to grow to between 700,000 and 785,000
trained more than 1,100 employees and 800 equivalent barrels of oil per day.
contractors on the policy in Latin America, the
This production outlook does not depend on new
Middle East and the U.S. Training is continuing
exploration success, new EOR projects or new
in 2006 as we incorporate new employees and
asset acquisitions. Growth is expected to come
new operations. In Colombia, we have initiated
from the company’s Argentina assets that were
a risk assessment of a new production area
recently acquired from Vintage Petroleum, the
as required by the policy. In addition, our foreign
giant Dolphin gas project in Qatar and the United
contracts are being updated to include human
Arab Emirates, the Mukhaizna project in Oman,
rights provisions and we continue to receive
and Libya.
positive feedback on the policy from employees,
contractors and from representatives of human In addition, the company plans to grow its
rights organizations. California production through a combination of
primary drilling and EOR projects at its Elk Hills
9
Annual Report 2005
13. “We are currently pursuing a number of new growth
opportunities in our core operating areas that could
increase production in 2010 to between 805,000
and 950,000 equivalent barrels per day, for a potential
annual growth rate (at midpoint) of approximately
10 percent over five years.”
operation and by increasing production from required to sustain growth of 5 to 7 percent.
former Vintage properties in Southern California. The extra cash will initially be used to increase
The company also has a large inventory of EOR our growth rate and to buy back shares. Our
projects in the Permian Basin in Texas and New preference is to grow the business at a faster
Mexico, where it expects to offset moderate rate, but if the new projects we are currently
decline rates. considering encounter timing delays or don’t
meet our financial criteria, we will use the
Equally important, we are committed to maintaining
excess cash to purchase additional shares. We
the disciplined execution of our capital program that
will compare the potential for value creation of
funds these projects to keep our financial returns
new projects with share repurchases and asset
solidly in the top quartile among our industry peers
acquisitions and make decisions based on
and to maintain our “single A” credit rating.
what we believe will create the greatest value
Finally, we are currently pursuing a number of new for our stockholders over the long term.
growth opportunities in our core operating areas
Above all, we remain focused on the fundamentals
that could increase production in 2010 to between
of our business, which is the key to keeping our
805,000 and 950,000 equivalent barrels per day,
returns on equity and capital employed in the
for a potential annual growth rate (at midpoint) of
top quartile among our industry peers — and
approximately 10 percent over five years.
ultimately generating top quartile total returns
We plan to repurchase 10 million Occidental for our stockholders.
common shares in the short term. We also expect
to repurchase an additional 20 million shares over
Dr. Ray R. Irani
the intermediate term from free cash flow and the
Chairman, President and Chief Executive Officer
proceeds from Vintage asset sales. If oil prices
remain above $50 per barrel, we will generate
significant free cash flow in excess of what is
11
Annual Report 2005
14. Board and Officers
Board of Directors Officers
Dr. Ray R. Irani Dr. Ray R. Irani
1,7,8
Chairman, President and Chief Executive Officer, Chairman, President and Chief Executive Officer
Occidental Petroleum Corporation
Stephen I. Chazen
Spencer Abraham 4 Senior Executive Vice President and Chief Financial Officer
Chairman and Chief Executive Officer,
The Abraham Group, LLC;
former U.S. Secretary of Energy e x e c u t i v e v i c e P r e s i d e n ts
Donald P. de Brier
Ronald W. Burkle 3
Executive Vice President, General Counsel and Secretary
Managing Partner, The Yucaipa Companies
Richard W. Hallock
John S. Chalsty 3
Executive Vice President — Human Resources
Chairman, Muirfield Capital Management LLC;
former Chairman, Donaldson, Lufkin Jenrette, Inc.
James M. Lienert
Edward P. Djerejian 4,5 Executive Vice President — Finance and Planning
Director, James A. Baker III Institute for Public Policy;
John W. Morgan
former U.S. Ambassador
Executive Vice President;
R. Chad Dreier 2,3 President, Oxy Oil and Gas — Western Hemisphere
Chairman, President and Chief Executive Officer,
R. Casey Olson
The Ryland Group, Inc.
Executive Vice President;
John E. Feick 2,4 President, Oxy Oil and Gas — Eastern Hemisphere
Chairman, Matrix Solutions Inc.
Irvin W. Maloney 1,2,3,7 v i c e P r e s i d e n ts a n d k ey e x e c u t i v e s
Retired Chairman and Chief Executive Officer,
B. Chuck Anderson
Dataproducts Corporation
President, OxyChem
Rodolfo Segovia 1,4,5
James R. Havert
Member of the Executive Committee, Inversiones Sanford;
Vice President and Treasurer
former President, Ecopetrol — Colombian national oil company
Kenneth J. Huffman
Aziz D. Syriani 1,2,5,6,8
Vice President — Investor Relations
President and Chief Executive Officer, The Olayan Group
Jim A. Leonard
Rosemary Tomich 1,2,3,4,5,7
Vice President and Controller
Owner, Hope Cattle Company and A.S. Tomich
Construction Company; Chairman and Chief Executive
Robert M. McGee
Officer, Livestock Clearing, Inc.
Vice President — Government Relations
Walter L. Weisman 4,5 Lawrence P. Meriage
Private investor; former Chairman and Chief Executive
Vice President — Communications and Public Affairs
Officer, American Medical International, Inc.
Donald L. Moore, Jr.
Vice President and Chief Information Officer
Member of the Executive Committee
1
Roy Pineci
Member of the Audit Committee
2
Vice President — Internal Audit
Member of the Executive Compensation
3
and Human Resources Committee
Todd A. Stevens
Member of the Environmental, Health,
4
Vice President — Acquisitions and Corporate Finance
and Safety Committee
Member of the Corporate Governance, Nominating and
5
Michael S. Stutts
Social Responsibility Committee
Vice President — Tax; Chief Tax Counsel
Lead Independent Director
6
Richard A. Swan
Member of the Charitable Contributions Committee
7
Vice President — Health, Environment and Safety
Member of the Dividend Committee
8
12 Occidental Petroleum Corporation
15. Investor Information
c o rPo rat e h e a d qua rt e r s t ra n s f e r ag e n t a n d r e g i s t ra r
Occidental Petroleum Corporation Mellon Investor Services LLC
10889 Wilshire Boulevard Shareholder Relations
Los Angeles, California 90024-4201 Newport Office Center VII
(310) 208-8800 480 Washington Boulevard
www.oxy.com Jersey City, New Jersey 07310
(800) 622-9231
in v e s to r r e lat i o n s www.melloninvestor.com/isd
1230 Avenue of the Americas
s to c k e xc h a n g e l i s t i n g
16th Floor
Common Stock
New York, New York 10020-1508
(212) 603-8111 New York Stock Exchange (NYSE)
investorrelations_newyork@oxy.com
d i v i d e n d r e i n v e s tM e n t P la n
sto c k h o l d e r r e lat i o n s Occidental stockholders owning 25 or more shares of
10889 Wilshire Boulevard common or preferred stock registered in their name are
Los Angeles, California 90024-4201 eligible to purchase additional shares of common stock
(310) 443-6459 under the Dividend Reinvestment Plan by investing
dividends on a minimum of 25 shares and optional cash
oil and gas payments of up to $10,000 per month. Information may
be obtained from: Mellon Investor Services LLC at
Occidental Oil and Gas Corporation
www.melloninvestor.com.
10889 Wilshire Boulevard
Los Angeles, California 90024-4201
a n n ua l c e rt i f i c at i o n s
(310) 208-8800
Occidental has filed the certifications of the chief
Occidental Energy Marketing, Inc.
executive officer and chief financial officer required by
5 Greenway Plaza
Section 302 of the Sarbanes-Oxley Act of 2002 as
Houston, Texas 77046-0506
Exhibits 31.1 and 31.2 to its 2005 Annual Report on
P.O. Box 27570
Form 10-K filed with the Securities and Exchange
Houston, Texas 77227-7570
Commission. In addition, in 2005, Occidental submitted
(713) 215-7000
to the NYSE a certificate of the chief executive
www.oogc.com
officer stating that he is not aware of any violation by
the company of the NYSE corporate governance
c h eM i c a l s
listing standards.
Occidental chemical corporation
Occidental Tower c u r r e n t n ews a n d
5005 LBJ Freeway g e n e ra l i n f o rM at i o n
Dallas, Texas 75244-6119
Information about Occidental, including news releases
P.O. Box 809050
as soon as issued, is available on the Internet at
Dallas, Texas 75380-9050
www.oxy.com. In addition, a toll-free telephone number:
(972) 404-3800
1-888-OXYPETE; (1-888-699-7383) may be called to
www.oxychem.com
request our investor package.
o c c i d e n ta l in t e r nat i o na l a d d i t i o na l P u b l i c at i o n s
co rP o rat i o n ava i la b l e to s to c k h o l d e r s
1717 Pennsylvania Avenue, N.W.
The Health, Environment and Safety Annual Report and
Suite 400
the Social Responsibility Report, and Occidental’s
Washington, D.C. 20006-4614
Corporate Governance Principles are available upon
(202) 857-3000
request by writing to Occidental, and at www.oxy.com.
au d i to r s
KPMG LLP
Los Angeles, California