SlideShare uma empresa Scribd logo
1 de 6
Baixar para ler offline
ConocoPhillips
                                                      Houston, Texas 77079

Preliminary
FINANCIAL HIGHLIGHTS
                                                                                         Millions of Dollars
                                                                        Three Months Ended            Six Months Ended
                                                                              June 30                       June 30
                                                                        2007          2006           2007           2006
Revenues and Other Income
 Sales and other operating revenues*                                $ 47,370           47,149     $ 88,690          94,055
 Equity in earnings of affiliates                                      1,506            1,164        2,435           2,124
 Other income                                                            521              163        1,139             224
                                                                      49,397           48,476       92,264          96,403
Costs and Expenses
 Purchased crude oil, natural gas and products                           30,820        29,448         57,535        62,903
 Production and operating expenses                                        2,557         2,694          5,049         4,909
 Selling, general and administrative expenses                               604           610          1,131         1,176
 Exploration expenses                                                       259           134            521           246
 Depreciation, depletion and amortization                                 2,016         1,965          4,040         3,145
 Impairment - expropriated assets                                         4,588             -          4,588             -
 Impairments                                                                 98            50             97            50
 Taxes other than income taxes*                                           4,697         4,421          9,071         8,808
 Accretion on discounted liabilities                                         81            73            160           133
 Interest and debt expense                                                  319           360            626           475
 Foreign currency transaction (gains) losses                               (179)           18           (178)           40
 Minority interests                                                          19            21             40            39
                                                                         45,879        39,794         82,680        81,924

 Income before income taxes                                               3,518         8,682          9,584        14,479
                                                                          3,217         3,496          5,737         6,002
 Provision for income taxes
Net Income                                                                  301         5,186          3,847         8,477

Net Income per share of common stock (dollars)
 Basic                                                              $      0.18          3.13     $     2.34          5.58
 Diluted                                                            $      0.18          3.09     $     2.31          5.49

Average common shares outstanding (in thousands)
 Basic                                                              1,635,848       1,654,758     1,641,569      1,519,593
 Diluted                                                            1,657,999       1,678,445     1,663,618      1,542,752


*Includes excise taxes on petroleum products sales:                 $      4,069         3,922    $     7,910         7,912


                                                               1
ConocoPhillips
                               Houston, Texas 77079

Preliminary
SELECTED FINANCIAL DATA
                                                                 Millions of Dollars
                                                Three Months Ended              Six Months Ended
                                                      June 30                        June 30
                                                2007          2006             2007          2006
SUMMARY OF NET INCOME (LOSS)
 E&P
  United States                             $     1,055         1,300        $ 1,971         2,481
  International                                  (3,459)        2,004         (2,046)        3,376
    Total E&P                                    (2,404)        3,304            (75)        5,857
 Midstream                                          102           108            187           218
 R&M
  United States                                  1,879          1,433          2,775         1,730
  International                                    479            275            719           368
    Total R&M                                    2,358          1,708          3,494         2,098
 LUKOIL Investment                                 526            387            782           636
 Chemicals                                          68            103            150           252
 Emerging Businesses                               (12)           (12)           (13)           (4)
 Corporate and other                              (337)          (412)          (678)         (580)
 Consolidated                               $      301          5,186        $ 3,847         8,477


                                        2
ConocoPhillips
                                             Houston, Texas 77079

Preliminary
SELECTED FINANCIAL DATA
                                                          Three Months Ended                 Six Months Ended
                                                                June 30                           June 30
                                                          2007         2006                 2007          2006


Effective tax rate %                                           91.4 %        40.3             59.9 %        41.5

                                                                            Millions of Dollars
FOREIGN CURRENCY GAINS (LOSSES)
AFTER-TAX
 E&P                                                      $     152           (34)      $      169           (27)
 Midstream                                                       (1)            -               (1)            -
 R&M                                                             (2)           25               (2)           31
 LUKOIL Investment                                                -             1                -             1
 Chemicals                                                        -             -                -             -
 Emerging Businesses                                              -             -                -             -
 Corporate and other                                            (16)          (36)             (30)          (44)
                                                          $     133           (44)      $      136           (39)

CASH FLOWS FROM OPERATING ACTIVITIES
 Net Income                                               $      301        5,186       $ 3,847           8,477
 Depreciation, depletion and amortization                      2,016        1,965          4,040          3,145
 Impairment - expropriated assets                              4,588                       4,588
 Impairments                                                      98           50             97              50
 Dry hole costs and leasehold impairments                        133           47            281              85
 Accretion on discounted liabilities                              81           73            160             133
 Deferred taxes                                                  103         (390)           180            (222)
 Undistributed equity earnings                                  (678)        (687)        (1,235)           (754)
 Gain on asset dispositions                                     (428)         (53)          (927)            (56)
 Other                                                           182          189             88             (14)
 Working capital adjustments                                  (1,630)      (1,536)           520          (1,200)
 Net cash provided by operating activities                $ 4,766           4,844       $ 11,639          9,644

CAPITAL EXPENDITURES AND INVESTMENTS
 E&P
  United States                                           $   873             756       $ 1,716           1,175
  International                                             1,275           1,416         3,002           3,203
                                                            2,148           2,172         4,718           4,378
 Midstream                                                      2               1             2               2
 R&M                                                          271             475           476           2,110
 LUKOIL Investment                                              -             648             -           1,260
 Chemicals                                                      -               -             -               -
 Emerging Businesses                                           34              28            65              40
 Corporate and other                                           45              78            86             126
                                                          $ 2,500           3,402       $ 5,347           7,916


OTHER

                                                               At June 30, 2007         At December 31, 2006
 Total debt                                                        $22,812                     27,134
 Common stockholders' equity                                       $84,928                     82,646


                                                      3
ConocoPhillips
                                                                      Houston, Texas 77079


Preliminary
OPERATING HIGHLIGHTS
                                                       BY SEGMENT

                                                                Three Months Ended              Six Months Ended
                                                                      June 30                        June 30
                                                                2007          2006            2007           2006
                                                                            Thousands of Barrels Daily
E&P
 Crude oil produced
  United States
     Alaska                                                          267            279              272       281
     Lower 48                                                        105            120              104        92
                                                                     372            399              376       373
   Norway                                                            145            192              162       190
   United Kingdom                                                     48             57               52        59
   Canada                                                             19             27               20        25
   China                                                              32             34               35        30
   Indonesia                                                          13             14               13        14
   Vietnam                                                            22             22               22        26
   Timor Sea                                                          26             39               25        39
   Libya                                                              47             74               46        37
   Other                                                              36             66               48        58
   Total consolidated                                                760            924              799       851
   Equity affiliates
     Canada                                                           28               -              26         -
     Russia                                                           15              15              15        15
     Venezuela                                                        85             106              83       108
      Total Worldwide                                                888           1,045             923       974

 Syncrude                                                             21             19               22        18

 Natural gas liquids produced
  United States
     Alaska*                                                          18             20               20        21
     Lower 48                                                         71             70               70        50
                                                                      89             90               90        71
   Norway                                                              5              8                7         9
   United Kingdom                                                      6              4                5         4
   Canada                                                             28             30               30        20
   Timor Sea                                                          14             20               13        20
   Other                                                               3              -                2         1
     Total Worldwide                                                 145            152              147       125

                                                                      15             14               16        14
  *Includes reinjected volumes sold lease-to-lease.


                                                                             Millions of Cubic Feet Daily
 Natural gas produced*
  United States
     Alaska                                                           100            163             111       163
     Lower 48                                                       2,219          2,265           2,205     1,767
                                                                    2,319          2,428           2,316     1,930
   Norway                                                             202            260             225       265
   United Kingdom                                                     668            796             726       823
   Canada                                                           1,133          1,204           1,142       816
   China                                                               12             10              11         5
   Timor Sea                                                          250            251             247       198
   Indonesia                                                          329            323             330       309
   Vietnam                                                             12             19              13        22
   Libya                                                                9              -               7         -
   Other                                                              190            207             201       164
   Total consolidated                                               5,124          5,498           5,218     4,532
   Equity affiliates
     Venezuela                                                          9             10               9        10
      Total Worldwide                                               5,133          5,508           5,227     4,542
 *Represents quantities available for sale. Excludes
  gas equivalent of NGL shown above.

 Liquefied natural gas sales                                         521            432              506       349

LUKOIL Investment
 Production (MBOE/D)*                                                 473           403              460       363
 Refinery crude oil throughput (MB/D)*                                184           168              202       165
 *Represents our estimated net share of LUKOIL.


                                                                               4
ConocoPhillips
                                                     Houston, Texas 77079

Preliminary
OPERATING HIGHLIGHTS
                                                                 Three Months Ended                      Six Months Ended
                                                                       June 30                                June 30
                                                                 2007          2006                     2007          2006
E&P
                                                                                           Per Unit
  Average sales prices
   Crude oil (per barrel)
     United States
       Alaska                                                $    63.26              66.02         $ 59.38            62.33
       Lower 48                                                   58.50              59.63           53.95            57.08
         Total U.S.                                               61.91              64.09           57.86            61.06
     International                                                67.16              67.27           61.16            64.12
     Total consolidated                                           64.55              65.89           59.61            62.75
     Equity affiliates*                                           47.74              52.28           44.24            47.53
       Total Worldwide                                            61.97              64.34           57.53            60.76
   Natural gas (per MCF)
     United States
       Alaska                                                       4.04              3.42                 4.12         3.50
       Lower 48                                                     6.51              5.81                 6.36         6.41
         Total U.S.                                                 6.49              5.78                 6.34         6.37
     International                                                  6.42              5.92                 6.46         6.43
     Total consolidated                                             6.45              5.86                 6.41         6.40
     Equity affiliates*                                             0.37              0.36                 0.42         0.29
       Total Worldwide                                              6.44              5.85                 6.40         6.39
*Excludes our equity share of LUKOIL reported in the LUKOIL Investment segment.


Midstream
                                                                              Thousands of Barrels Daily
  Natural gas liquids extracted
   Consolidated
    United States                                                     23                   22               19           22
    International                                                      -                    -                -            -
   Equity affiliates
    United States                                                     181              183                 177          181
    International                                                       7                6                   8            6
                                                                      211              211                 204          209


                                                                                           Per Barrel
  U.S. product prices
  Weighted average NGL**
   Consolidated                                              $    45.19              41.73         $ 41.46             39.69
   DCP                                                            44.30              41.18           40.43             39.24

**Prices are based on index prices from the Mont Belvieu and Conway market hubs that are
 weighted by natural gas liquids component and location mix.


                                                                  5
ConocoPhillips
                                                               Houston, Texas 77079


                                                                  Three Months Ended                            Six Months Ended
                                                                        June 30                                      June 30
                                                                  2007           2006                          2007          2006
                                                                Thousands of Barrels Daily                   Thousands of Barrels Daily
R&M
 United States
  Crude oil capacity                                                  2,033               2,208                  2,033         2,208
  Crude oil runs                                                      1,896               2,000                  1,917         1,921
  Refinery production                                                 2,087               2,198                  2,119         2,093

 International*
   Crude oil capacity                                                    696                 693                  696            608
   Crude oil runs                                                        650                 649                  637            570
   Refinery production                                                   664                 695                  654            599

 U.S. petroleum products sales volumes
  Gasoline                                                            1,300               1,300                  1,279         1,279
  Distillates                                                           827                 820                    845           817
  Other products                                                        503                 555                    491           536
                                                                      2,630               2,675                  2,615         2,632
 International                                                          739                 871                    726           784
                                                                      3,369               3,546                  3,341         3,416

                                                                               Per Gallon                                Per Gallon
 U.S. average sales prices**
  Gasoline-wholesale                                             $      2.50                2.32             $    2.19          2.06
  Gasoline-retail                                                       2.68                2.47                  2.36          2.19
  Distillates-wholesale                                                 2.24                2.24                  2.09          2.08

*Includes ConocoPhillips' share of equity affiliates, except for our share of LUKOIL, which is reported in
 the LUKOIL Investment segment.
**Excludes excise taxes.


                                                                             6

Mais conteúdo relacionado

Mais de finance1

AT&T First-Quarter Earnings Package
AT&T First-Quarter Earnings PackageAT&T First-Quarter Earnings Package
AT&T First-Quarter Earnings Packagefinance1
 
AT&T Quarterly Earnings - 2Q 2008
AT&T Quarterly Earnings - 2Q 2008AT&T Quarterly Earnings - 2Q 2008
AT&T Quarterly Earnings - 2Q 2008finance1
 
AT&T Third-Quarter Earnings Package
AT&T Third-Quarter Earnings PackageAT&T Third-Quarter Earnings Package
AT&T Third-Quarter Earnings Packagefinance1
 
AT&T Fourth-Quarter Earnings Package
AT&T Fourth-Quarter Earnings PackageAT&T Fourth-Quarter Earnings Package
AT&T Fourth-Quarter Earnings Packagefinance1
 
GE# 2000 Proxy Statement
GE# 2000 Proxy Statement GE# 2000 Proxy Statement
GE# 2000 Proxy Statement finance1
 
GE# 2001 Proxy Statement (PDF)
GE# 2001 Proxy Statement (PDF)GE# 2001 Proxy Statement (PDF)
GE# 2001 Proxy Statement (PDF)finance1
 
GE# 2002 Proxy Statement
GE# 2002 Proxy Statement GE# 2002 Proxy Statement
GE# 2002 Proxy Statement finance1
 
GE# 2003 Proxy Statement
GE# 2003 Proxy Statement GE# 2003 Proxy Statement
GE# 2003 Proxy Statement finance1
 
GE# 2004 Proxy Statement
GE# 2004 Proxy Statement GE# 2004 Proxy Statement
GE# 2004 Proxy Statement finance1
 
GE# 2005 Proxy Statement
GE# 2005 Proxy Statement GE# 2005 Proxy Statement
GE# 2005 Proxy Statement finance1
 
GE# 2006 Proxy Statement
GE# 2006 Proxy Statement GE# 2006 Proxy Statement
GE# 2006 Proxy Statement finance1
 
onoco phillips 2004First Quarter
onoco phillips 2004First Quarteronoco phillips 2004First Quarter
onoco phillips 2004First Quarterfinance1
 
conoco phillips 2004Second Quarter
conoco phillips 2004Second Quarterconoco phillips 2004Second Quarter
conoco phillips 2004Second Quarterfinance1
 
conoco phillips 2004Third Quarter
conoco phillips 2004Third Quarterconoco phillips 2004Third Quarter
conoco phillips 2004Third Quarterfinance1
 
conoco phillips 2004Fourth Quarter
conoco phillips 2004Fourth Quarterconoco phillips 2004Fourth Quarter
conoco phillips 2004Fourth Quarterfinance1
 
conoco phillips 2005First Quarter
conoco phillips 2005First Quarterconoco phillips 2005First Quarter
conoco phillips 2005First Quarterfinance1
 
conoco phillips 2005Fourth Quarter
conoco phillips 2005Fourth Quarterconoco phillips 2005Fourth Quarter
conoco phillips 2005Fourth Quarterfinance1
 
conoco phillips 2006First Quarter
conoco phillips 2006First Quarter conoco phillips 2006First Quarter
conoco phillips 2006First Quarter finance1
 
conoco phillips 2006Second Quarter
conoco phillips 2006Second Quarterconoco phillips 2006Second Quarter
conoco phillips 2006Second Quarterfinance1
 
conoco phillips 2006Third Quarter
conoco phillips 2006Third Quarterconoco phillips 2006Third Quarter
conoco phillips 2006Third Quarterfinance1
 

Mais de finance1 (20)

AT&T First-Quarter Earnings Package
AT&T First-Quarter Earnings PackageAT&T First-Quarter Earnings Package
AT&T First-Quarter Earnings Package
 
AT&T Quarterly Earnings - 2Q 2008
AT&T Quarterly Earnings - 2Q 2008AT&T Quarterly Earnings - 2Q 2008
AT&T Quarterly Earnings - 2Q 2008
 
AT&T Third-Quarter Earnings Package
AT&T Third-Quarter Earnings PackageAT&T Third-Quarter Earnings Package
AT&T Third-Quarter Earnings Package
 
AT&T Fourth-Quarter Earnings Package
AT&T Fourth-Quarter Earnings PackageAT&T Fourth-Quarter Earnings Package
AT&T Fourth-Quarter Earnings Package
 
GE# 2000 Proxy Statement
GE# 2000 Proxy Statement GE# 2000 Proxy Statement
GE# 2000 Proxy Statement
 
GE# 2001 Proxy Statement (PDF)
GE# 2001 Proxy Statement (PDF)GE# 2001 Proxy Statement (PDF)
GE# 2001 Proxy Statement (PDF)
 
GE# 2002 Proxy Statement
GE# 2002 Proxy Statement GE# 2002 Proxy Statement
GE# 2002 Proxy Statement
 
GE# 2003 Proxy Statement
GE# 2003 Proxy Statement GE# 2003 Proxy Statement
GE# 2003 Proxy Statement
 
GE# 2004 Proxy Statement
GE# 2004 Proxy Statement GE# 2004 Proxy Statement
GE# 2004 Proxy Statement
 
GE# 2005 Proxy Statement
GE# 2005 Proxy Statement GE# 2005 Proxy Statement
GE# 2005 Proxy Statement
 
GE# 2006 Proxy Statement
GE# 2006 Proxy Statement GE# 2006 Proxy Statement
GE# 2006 Proxy Statement
 
onoco phillips 2004First Quarter
onoco phillips 2004First Quarteronoco phillips 2004First Quarter
onoco phillips 2004First Quarter
 
conoco phillips 2004Second Quarter
conoco phillips 2004Second Quarterconoco phillips 2004Second Quarter
conoco phillips 2004Second Quarter
 
conoco phillips 2004Third Quarter
conoco phillips 2004Third Quarterconoco phillips 2004Third Quarter
conoco phillips 2004Third Quarter
 
conoco phillips 2004Fourth Quarter
conoco phillips 2004Fourth Quarterconoco phillips 2004Fourth Quarter
conoco phillips 2004Fourth Quarter
 
conoco phillips 2005First Quarter
conoco phillips 2005First Quarterconoco phillips 2005First Quarter
conoco phillips 2005First Quarter
 
conoco phillips 2005Fourth Quarter
conoco phillips 2005Fourth Quarterconoco phillips 2005Fourth Quarter
conoco phillips 2005Fourth Quarter
 
conoco phillips 2006First Quarter
conoco phillips 2006First Quarter conoco phillips 2006First Quarter
conoco phillips 2006First Quarter
 
conoco phillips 2006Second Quarter
conoco phillips 2006Second Quarterconoco phillips 2006Second Quarter
conoco phillips 2006Second Quarter
 
conoco phillips 2006Third Quarter
conoco phillips 2006Third Quarterconoco phillips 2006Third Quarter
conoco phillips 2006Third Quarter
 

Último

(办理学位证)加拿大萨省大学毕业证成绩单原版一比一
(办理学位证)加拿大萨省大学毕业证成绩单原版一比一(办理学位证)加拿大萨省大学毕业证成绩单原版一比一
(办理学位证)加拿大萨省大学毕业证成绩单原版一比一S SDS
 
Amil Baba In Pakistan amil baba in Lahore amil baba in Islamabad amil baba in...
Amil Baba In Pakistan amil baba in Lahore amil baba in Islamabad amil baba in...Amil Baba In Pakistan amil baba in Lahore amil baba in Islamabad amil baba in...
Amil Baba In Pakistan amil baba in Lahore amil baba in Islamabad amil baba in...amilabibi1
 
Call Girls Near Delhi Pride Hotel, New Delhi|9873777170
Call Girls Near Delhi Pride Hotel, New Delhi|9873777170Call Girls Near Delhi Pride Hotel, New Delhi|9873777170
Call Girls Near Delhi Pride Hotel, New Delhi|9873777170Sonam Pathan
 
call girls in Nand Nagri (DELHI) 🔝 >༒9953330565🔝 genuine Escort Service 🔝✔️✔️
call girls in  Nand Nagri (DELHI) 🔝 >༒9953330565🔝 genuine Escort Service 🔝✔️✔️call girls in  Nand Nagri (DELHI) 🔝 >༒9953330565🔝 genuine Escort Service 🔝✔️✔️
call girls in Nand Nagri (DELHI) 🔝 >༒9953330565🔝 genuine Escort Service 🔝✔️✔️9953056974 Low Rate Call Girls In Saket, Delhi NCR
 
The Triple Threat | Article on Global Resession | Harsh Kumar
The Triple Threat | Article on Global Resession | Harsh KumarThe Triple Threat | Article on Global Resession | Harsh Kumar
The Triple Threat | Article on Global Resession | Harsh KumarHarsh Kumar
 
《加拿大本地办假证-寻找办理Dalhousie毕业证和达尔豪斯大学毕业证书的中介代理》
《加拿大本地办假证-寻找办理Dalhousie毕业证和达尔豪斯大学毕业证书的中介代理》《加拿大本地办假证-寻找办理Dalhousie毕业证和达尔豪斯大学毕业证书的中介代理》
《加拿大本地办假证-寻找办理Dalhousie毕业证和达尔豪斯大学毕业证书的中介代理》rnrncn29
 
Current Economic situation of Pakistan .pptx
Current Economic situation of Pakistan .pptxCurrent Economic situation of Pakistan .pptx
Current Economic situation of Pakistan .pptxuzma244191
 
GOODSANDSERVICETAX IN INDIAN ECONOMY IMPACT
GOODSANDSERVICETAX IN INDIAN ECONOMY IMPACTGOODSANDSERVICETAX IN INDIAN ECONOMY IMPACT
GOODSANDSERVICETAX IN INDIAN ECONOMY IMPACTharshitverma1762
 
The AES Investment Code - the go-to counsel for the most well-informed, wise...
The AES Investment Code -  the go-to counsel for the most well-informed, wise...The AES Investment Code -  the go-to counsel for the most well-informed, wise...
The AES Investment Code - the go-to counsel for the most well-informed, wise...AES International
 
(办理学位证)美国加州州立大学东湾分校毕业证成绩单原版一比一
(办理学位证)美国加州州立大学东湾分校毕业证成绩单原版一比一(办理学位证)美国加州州立大学东湾分校毕业证成绩单原版一比一
(办理学位证)美国加州州立大学东湾分校毕业证成绩单原版一比一S SDS
 
Bladex 1Q24 Earning Results Presentation
Bladex 1Q24 Earning Results PresentationBladex 1Q24 Earning Results Presentation
Bladex 1Q24 Earning Results PresentationBladex
 
government_intervention_in_business_ownership[1].pdf
government_intervention_in_business_ownership[1].pdfgovernment_intervention_in_business_ownership[1].pdf
government_intervention_in_business_ownership[1].pdfshaunmashale756
 
NO1 WorldWide Love marriage specialist baba ji Amil Baba Kala ilam powerful v...
NO1 WorldWide Love marriage specialist baba ji Amil Baba Kala ilam powerful v...NO1 WorldWide Love marriage specialist baba ji Amil Baba Kala ilam powerful v...
NO1 WorldWide Love marriage specialist baba ji Amil Baba Kala ilam powerful v...Amil baba
 
2024 Q1 Crypto Industry Report | CoinGecko
2024 Q1 Crypto Industry Report | CoinGecko2024 Q1 Crypto Industry Report | CoinGecko
2024 Q1 Crypto Industry Report | CoinGeckoCoinGecko
 
magnetic-pensions-a-new-blueprint-for-the-dc-landscape.pdf
magnetic-pensions-a-new-blueprint-for-the-dc-landscape.pdfmagnetic-pensions-a-new-blueprint-for-the-dc-landscape.pdf
magnetic-pensions-a-new-blueprint-for-the-dc-landscape.pdfHenry Tapper
 
letter-from-the-chair-to-the-fca-relating-to-british-steel-pensions-scheme-15...
letter-from-the-chair-to-the-fca-relating-to-british-steel-pensions-scheme-15...letter-from-the-chair-to-the-fca-relating-to-british-steel-pensions-scheme-15...
letter-from-the-chair-to-the-fca-relating-to-british-steel-pensions-scheme-15...Henry Tapper
 
The Core Functions of the Bangko Sentral ng Pilipinas
The Core Functions of the Bangko Sentral ng PilipinasThe Core Functions of the Bangko Sentral ng Pilipinas
The Core Functions of the Bangko Sentral ng PilipinasCherylouCamus
 
Tenets of Physiocracy History of Economic
Tenets of Physiocracy History of EconomicTenets of Physiocracy History of Economic
Tenets of Physiocracy History of Economiccinemoviesu
 
Governor Olli Rehn: Dialling back monetary restraint
Governor Olli Rehn: Dialling back monetary restraintGovernor Olli Rehn: Dialling back monetary restraint
Governor Olli Rehn: Dialling back monetary restraintSuomen Pankki
 

Último (20)

(办理学位证)加拿大萨省大学毕业证成绩单原版一比一
(办理学位证)加拿大萨省大学毕业证成绩单原版一比一(办理学位证)加拿大萨省大学毕业证成绩单原版一比一
(办理学位证)加拿大萨省大学毕业证成绩单原版一比一
 
Amil Baba In Pakistan amil baba in Lahore amil baba in Islamabad amil baba in...
Amil Baba In Pakistan amil baba in Lahore amil baba in Islamabad amil baba in...Amil Baba In Pakistan amil baba in Lahore amil baba in Islamabad amil baba in...
Amil Baba In Pakistan amil baba in Lahore amil baba in Islamabad amil baba in...
 
Call Girls Near Delhi Pride Hotel, New Delhi|9873777170
Call Girls Near Delhi Pride Hotel, New Delhi|9873777170Call Girls Near Delhi Pride Hotel, New Delhi|9873777170
Call Girls Near Delhi Pride Hotel, New Delhi|9873777170
 
call girls in Nand Nagri (DELHI) 🔝 >༒9953330565🔝 genuine Escort Service 🔝✔️✔️
call girls in  Nand Nagri (DELHI) 🔝 >༒9953330565🔝 genuine Escort Service 🔝✔️✔️call girls in  Nand Nagri (DELHI) 🔝 >༒9953330565🔝 genuine Escort Service 🔝✔️✔️
call girls in Nand Nagri (DELHI) 🔝 >༒9953330565🔝 genuine Escort Service 🔝✔️✔️
 
The Triple Threat | Article on Global Resession | Harsh Kumar
The Triple Threat | Article on Global Resession | Harsh KumarThe Triple Threat | Article on Global Resession | Harsh Kumar
The Triple Threat | Article on Global Resession | Harsh Kumar
 
《加拿大本地办假证-寻找办理Dalhousie毕业证和达尔豪斯大学毕业证书的中介代理》
《加拿大本地办假证-寻找办理Dalhousie毕业证和达尔豪斯大学毕业证书的中介代理》《加拿大本地办假证-寻找办理Dalhousie毕业证和达尔豪斯大学毕业证书的中介代理》
《加拿大本地办假证-寻找办理Dalhousie毕业证和达尔豪斯大学毕业证书的中介代理》
 
Current Economic situation of Pakistan .pptx
Current Economic situation of Pakistan .pptxCurrent Economic situation of Pakistan .pptx
Current Economic situation of Pakistan .pptx
 
GOODSANDSERVICETAX IN INDIAN ECONOMY IMPACT
GOODSANDSERVICETAX IN INDIAN ECONOMY IMPACTGOODSANDSERVICETAX IN INDIAN ECONOMY IMPACT
GOODSANDSERVICETAX IN INDIAN ECONOMY IMPACT
 
The AES Investment Code - the go-to counsel for the most well-informed, wise...
The AES Investment Code -  the go-to counsel for the most well-informed, wise...The AES Investment Code -  the go-to counsel for the most well-informed, wise...
The AES Investment Code - the go-to counsel for the most well-informed, wise...
 
(办理学位证)美国加州州立大学东湾分校毕业证成绩单原版一比一
(办理学位证)美国加州州立大学东湾分校毕业证成绩单原版一比一(办理学位证)美国加州州立大学东湾分校毕业证成绩单原版一比一
(办理学位证)美国加州州立大学东湾分校毕业证成绩单原版一比一
 
Bladex 1Q24 Earning Results Presentation
Bladex 1Q24 Earning Results PresentationBladex 1Q24 Earning Results Presentation
Bladex 1Q24 Earning Results Presentation
 
government_intervention_in_business_ownership[1].pdf
government_intervention_in_business_ownership[1].pdfgovernment_intervention_in_business_ownership[1].pdf
government_intervention_in_business_ownership[1].pdf
 
NO1 WorldWide Love marriage specialist baba ji Amil Baba Kala ilam powerful v...
NO1 WorldWide Love marriage specialist baba ji Amil Baba Kala ilam powerful v...NO1 WorldWide Love marriage specialist baba ji Amil Baba Kala ilam powerful v...
NO1 WorldWide Love marriage specialist baba ji Amil Baba Kala ilam powerful v...
 
2024 Q1 Crypto Industry Report | CoinGecko
2024 Q1 Crypto Industry Report | CoinGecko2024 Q1 Crypto Industry Report | CoinGecko
2024 Q1 Crypto Industry Report | CoinGecko
 
Q1 2024 Newsletter | Financial Synergies Wealth Advisors
Q1 2024 Newsletter | Financial Synergies Wealth AdvisorsQ1 2024 Newsletter | Financial Synergies Wealth Advisors
Q1 2024 Newsletter | Financial Synergies Wealth Advisors
 
magnetic-pensions-a-new-blueprint-for-the-dc-landscape.pdf
magnetic-pensions-a-new-blueprint-for-the-dc-landscape.pdfmagnetic-pensions-a-new-blueprint-for-the-dc-landscape.pdf
magnetic-pensions-a-new-blueprint-for-the-dc-landscape.pdf
 
letter-from-the-chair-to-the-fca-relating-to-british-steel-pensions-scheme-15...
letter-from-the-chair-to-the-fca-relating-to-british-steel-pensions-scheme-15...letter-from-the-chair-to-the-fca-relating-to-british-steel-pensions-scheme-15...
letter-from-the-chair-to-the-fca-relating-to-british-steel-pensions-scheme-15...
 
The Core Functions of the Bangko Sentral ng Pilipinas
The Core Functions of the Bangko Sentral ng PilipinasThe Core Functions of the Bangko Sentral ng Pilipinas
The Core Functions of the Bangko Sentral ng Pilipinas
 
Tenets of Physiocracy History of Economic
Tenets of Physiocracy History of EconomicTenets of Physiocracy History of Economic
Tenets of Physiocracy History of Economic
 
Governor Olli Rehn: Dialling back monetary restraint
Governor Olli Rehn: Dialling back monetary restraintGovernor Olli Rehn: Dialling back monetary restraint
Governor Olli Rehn: Dialling back monetary restraint
 

conoco phillips 2007http://www.conocophillips.com/newsroom/news_releases/2007news/07-25-2007.htm

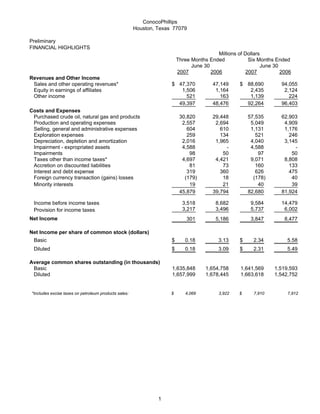
  • 1. ConocoPhillips Houston, Texas 77079 Preliminary FINANCIAL HIGHLIGHTS Millions of Dollars Three Months Ended Six Months Ended June 30 June 30 2007 2006 2007 2006 Revenues and Other Income Sales and other operating revenues* $ 47,370 47,149 $ 88,690 94,055 Equity in earnings of affiliates 1,506 1,164 2,435 2,124 Other income 521 163 1,139 224 49,397 48,476 92,264 96,403 Costs and Expenses Purchased crude oil, natural gas and products 30,820 29,448 57,535 62,903 Production and operating expenses 2,557 2,694 5,049 4,909 Selling, general and administrative expenses 604 610 1,131 1,176 Exploration expenses 259 134 521 246 Depreciation, depletion and amortization 2,016 1,965 4,040 3,145 Impairment - expropriated assets 4,588 - 4,588 - Impairments 98 50 97 50 Taxes other than income taxes* 4,697 4,421 9,071 8,808 Accretion on discounted liabilities 81 73 160 133 Interest and debt expense 319 360 626 475 Foreign currency transaction (gains) losses (179) 18 (178) 40 Minority interests 19 21 40 39 45,879 39,794 82,680 81,924 Income before income taxes 3,518 8,682 9,584 14,479 3,217 3,496 5,737 6,002 Provision for income taxes Net Income 301 5,186 3,847 8,477 Net Income per share of common stock (dollars) Basic $ 0.18 3.13 $ 2.34 5.58 Diluted $ 0.18 3.09 $ 2.31 5.49 Average common shares outstanding (in thousands) Basic 1,635,848 1,654,758 1,641,569 1,519,593 Diluted 1,657,999 1,678,445 1,663,618 1,542,752 *Includes excise taxes on petroleum products sales: $ 4,069 3,922 $ 7,910 7,912 1
  • 2. ConocoPhillips Houston, Texas 77079 Preliminary SELECTED FINANCIAL DATA Millions of Dollars Three Months Ended Six Months Ended June 30 June 30 2007 2006 2007 2006 SUMMARY OF NET INCOME (LOSS) E&P United States $ 1,055 1,300 $ 1,971 2,481 International (3,459) 2,004 (2,046) 3,376 Total E&P (2,404) 3,304 (75) 5,857 Midstream 102 108 187 218 R&M United States 1,879 1,433 2,775 1,730 International 479 275 719 368 Total R&M 2,358 1,708 3,494 2,098 LUKOIL Investment 526 387 782 636 Chemicals 68 103 150 252 Emerging Businesses (12) (12) (13) (4) Corporate and other (337) (412) (678) (580) Consolidated $ 301 5,186 $ 3,847 8,477 2
  • 3. ConocoPhillips Houston, Texas 77079 Preliminary SELECTED FINANCIAL DATA Three Months Ended Six Months Ended June 30 June 30 2007 2006 2007 2006 Effective tax rate % 91.4 % 40.3 59.9 % 41.5 Millions of Dollars FOREIGN CURRENCY GAINS (LOSSES) AFTER-TAX E&P $ 152 (34) $ 169 (27) Midstream (1) - (1) - R&M (2) 25 (2) 31 LUKOIL Investment - 1 - 1 Chemicals - - - - Emerging Businesses - - - - Corporate and other (16) (36) (30) (44) $ 133 (44) $ 136 (39) CASH FLOWS FROM OPERATING ACTIVITIES Net Income $ 301 5,186 $ 3,847 8,477 Depreciation, depletion and amortization 2,016 1,965 4,040 3,145 Impairment - expropriated assets 4,588 4,588 Impairments 98 50 97 50 Dry hole costs and leasehold impairments 133 47 281 85 Accretion on discounted liabilities 81 73 160 133 Deferred taxes 103 (390) 180 (222) Undistributed equity earnings (678) (687) (1,235) (754) Gain on asset dispositions (428) (53) (927) (56) Other 182 189 88 (14) Working capital adjustments (1,630) (1,536) 520 (1,200) Net cash provided by operating activities $ 4,766 4,844 $ 11,639 9,644 CAPITAL EXPENDITURES AND INVESTMENTS E&P United States $ 873 756 $ 1,716 1,175 International 1,275 1,416 3,002 3,203 2,148 2,172 4,718 4,378 Midstream 2 1 2 2 R&M 271 475 476 2,110 LUKOIL Investment - 648 - 1,260 Chemicals - - - - Emerging Businesses 34 28 65 40 Corporate and other 45 78 86 126 $ 2,500 3,402 $ 5,347 7,916 OTHER At June 30, 2007 At December 31, 2006 Total debt $22,812 27,134 Common stockholders' equity $84,928 82,646 3
  • 4. ConocoPhillips Houston, Texas 77079 Preliminary OPERATING HIGHLIGHTS BY SEGMENT Three Months Ended Six Months Ended June 30 June 30 2007 2006 2007 2006 Thousands of Barrels Daily E&P Crude oil produced United States Alaska 267 279 272 281 Lower 48 105 120 104 92 372 399 376 373 Norway 145 192 162 190 United Kingdom 48 57 52 59 Canada 19 27 20 25 China 32 34 35 30 Indonesia 13 14 13 14 Vietnam 22 22 22 26 Timor Sea 26 39 25 39 Libya 47 74 46 37 Other 36 66 48 58 Total consolidated 760 924 799 851 Equity affiliates Canada 28 - 26 - Russia 15 15 15 15 Venezuela 85 106 83 108 Total Worldwide 888 1,045 923 974 Syncrude 21 19 22 18 Natural gas liquids produced United States Alaska* 18 20 20 21 Lower 48 71 70 70 50 89 90 90 71 Norway 5 8 7 9 United Kingdom 6 4 5 4 Canada 28 30 30 20 Timor Sea 14 20 13 20 Other 3 - 2 1 Total Worldwide 145 152 147 125 15 14 16 14 *Includes reinjected volumes sold lease-to-lease. Millions of Cubic Feet Daily Natural gas produced* United States Alaska 100 163 111 163 Lower 48 2,219 2,265 2,205 1,767 2,319 2,428 2,316 1,930 Norway 202 260 225 265 United Kingdom 668 796 726 823 Canada 1,133 1,204 1,142 816 China 12 10 11 5 Timor Sea 250 251 247 198 Indonesia 329 323 330 309 Vietnam 12 19 13 22 Libya 9 - 7 - Other 190 207 201 164 Total consolidated 5,124 5,498 5,218 4,532 Equity affiliates Venezuela 9 10 9 10 Total Worldwide 5,133 5,508 5,227 4,542 *Represents quantities available for sale. Excludes gas equivalent of NGL shown above. Liquefied natural gas sales 521 432 506 349 LUKOIL Investment Production (MBOE/D)* 473 403 460 363 Refinery crude oil throughput (MB/D)* 184 168 202 165 *Represents our estimated net share of LUKOIL. 4
  • 5. ConocoPhillips Houston, Texas 77079 Preliminary OPERATING HIGHLIGHTS Three Months Ended Six Months Ended June 30 June 30 2007 2006 2007 2006 E&P Per Unit Average sales prices Crude oil (per barrel) United States Alaska $ 63.26 66.02 $ 59.38 62.33 Lower 48 58.50 59.63 53.95 57.08 Total U.S. 61.91 64.09 57.86 61.06 International 67.16 67.27 61.16 64.12 Total consolidated 64.55 65.89 59.61 62.75 Equity affiliates* 47.74 52.28 44.24 47.53 Total Worldwide 61.97 64.34 57.53 60.76 Natural gas (per MCF) United States Alaska 4.04 3.42 4.12 3.50 Lower 48 6.51 5.81 6.36 6.41 Total U.S. 6.49 5.78 6.34 6.37 International 6.42 5.92 6.46 6.43 Total consolidated 6.45 5.86 6.41 6.40 Equity affiliates* 0.37 0.36 0.42 0.29 Total Worldwide 6.44 5.85 6.40 6.39 *Excludes our equity share of LUKOIL reported in the LUKOIL Investment segment. Midstream Thousands of Barrels Daily Natural gas liquids extracted Consolidated United States 23 22 19 22 International - - - - Equity affiliates United States 181 183 177 181 International 7 6 8 6 211 211 204 209 Per Barrel U.S. product prices Weighted average NGL** Consolidated $ 45.19 41.73 $ 41.46 39.69 DCP 44.30 41.18 40.43 39.24 **Prices are based on index prices from the Mont Belvieu and Conway market hubs that are weighted by natural gas liquids component and location mix. 5
  • 6. ConocoPhillips Houston, Texas 77079 Three Months Ended Six Months Ended June 30 June 30 2007 2006 2007 2006 Thousands of Barrels Daily Thousands of Barrels Daily R&M United States Crude oil capacity 2,033 2,208 2,033 2,208 Crude oil runs 1,896 2,000 1,917 1,921 Refinery production 2,087 2,198 2,119 2,093 International* Crude oil capacity 696 693 696 608 Crude oil runs 650 649 637 570 Refinery production 664 695 654 599 U.S. petroleum products sales volumes Gasoline 1,300 1,300 1,279 1,279 Distillates 827 820 845 817 Other products 503 555 491 536 2,630 2,675 2,615 2,632 International 739 871 726 784 3,369 3,546 3,341 3,416 Per Gallon Per Gallon U.S. average sales prices** Gasoline-wholesale $ 2.50 2.32 $ 2.19 2.06 Gasoline-retail 2.68 2.47 2.36 2.19 Distillates-wholesale 2.24 2.24 2.09 2.08 *Includes ConocoPhillips' share of equity affiliates, except for our share of LUKOIL, which is reported in the LUKOIL Investment segment. **Excludes excise taxes. 6