2. Research J. Pharm. and Tech. 4(5): May 2011
Ondansetron is a potent antagonist of Serotonin (5 HT3) Preparation of standard solution: Firstly, stock solution-1
receptor which has been proved effective in prevention of of OSH was prepared by dissolving 10 mg of drug in 100
chemotherapy and radiotherapy-induced nausea and ml of PBS pH 7.4, so as to get a solution of 1 mg/ml
vomiting. It can control diarrhoea and nausea in up to 100% concentration. Then stock solution -2 was prepared by
of patients and occasionally ameliorate the flushing. In this taking 10 ml from the previous stock solution and
work an attempt was made to formulate and evaluate TDDS dissolving in 100 ml of PBS pH 7.4, so as to get a solution
for sustained release OSH by solvent casting method. Low of 100 mg/ml concentration. Accurately measured aliquot
molecular weight, good permeability, poor bioavailability portions of standard drug solution, like 0.4 ml, 0.6 ml, 0.8
(60%) and shorter half-life (5-6 h) of OSH made it a ml, 1.0 ml, 1.2 ml, 1.4 ml and 1.6 ml were taken from stock
suitable drug candidate for the development of Transdermal solution-2 and were transferred in to 10 ml volumetric
patches. The main objective of formulating the Transdermal flasks and were diluted up to the mark with PBS pH 7.4.
system was to prolong the drug release time, reduce the Absorbance of each solution was measured at max of 310
frequency of administration and to improve patient nm against PBS pH 7.4 as the blank, by using UV-
compliance. spectrophotometer. A graph of concentration of drug vs.
absorbance was plotted.
MATERIALS AND METHODS:
Materials: Ondansetron hydrochloride was obtained as a Formulation of Transdermal Patches16, 17
generous gift from Sun Pharmaceuticals (Baroda, India). Preparation of blank patches: Polymers of single or in
Eudragit RL100 and Eudragit RS100 were procured from combination were accurately weighed and dissolved in
Aurobindo Pharmaceuticals (Hyderabad, India). Di-butyl respective solvent and then casted in a Petri-dish with
phthalate, menthol, hydroxypropyl methylcellulose, ethyl mercury as the plain surface. The films were allowed to dry
cellulose, cellulose acetate phthalate were purchased from overnight at room temperature.
SD Fine Chemicals (Mumbai, India). All the polymers
received were of pharmaceutical grade and were used as Development of Transdermal Patches: Mercury substrate
received. Other materials and solvents used were of method was employed in preparing transdermal patches of
analytical grade. OSH.
Methodology: Table 1: Formulations of OSH Transdermal Patch
Formu EC: RL: PVA: HPMC SOLVENT
Preformulation study:
lation PVP RS PVP K4M:
Solubility study: OSH has very low aqueous solubility and code PVP
has not been reported in any official book, so determination F1 8:2 - - - CHLOROFORM
of solubility is important. The solubility was determined in F2 7:3 - - - CHLOROFORM
distilled water and Phosphate Buffered Saline (PBS) pH F3 6:4 - - CHLOROFORM
7.4. F4 5:5 - - - CHLOROFORM
F5 4:6 - - - CHLOROFORM
F6 - 8:2 - - ACETONE
Saturated solution of OSH was prepared using 10 ml of F7 - 6:4 - - ACETONE
distilled water/ PBS pH 7.4 in 25 ml volumetric flasks in F8 - 5:5 - - ACETONE
triplicate. Precautions were taken so that the drug remained F9 - 4:6 - - ACETONE
in medium in excess. Then by employing mechanical F10 - 8:2 - WATER
F11 - - 6:4 - WATER
shaker, the flasks were shaken for 48 h and the sampling F12 - - 5:5 - WATER
was done on 24th & 48th h. The sample withdrawn (1 ml F13 - - - 8:2 EDCM
after filtration) was diluted with appropriate medium and F14 - - - 6:4 EDCM
analyzed by using UV spectrophotometer (Systronic Pc- F15 - - - 5:5 EDCM
Based Double-Beam Spectrophotometer 2202, Ahmedabad, F16 4:6 EDCM
India) at 310 nm and 303.5 nm for PBS and distilled water F17 2:8 EDCM
EDCM= Ethanol: Dichloromethane
respectively.15
Mercury Substrate Method: The polymers,
Construction of standard graph: Standard graph of OSH
hydroxypropyl methylcellulose, ethyl cellulose, cellulose
was plotted in PBS pH 7.4 which was selected from
acetate phthalate, Eudragit RL100 and Eudragit RS100,
solubility study. OSH was estimated spectrophotometrically
poly vinyl Pyrrolidone, poly vinyl alcohol were taken in a
at max of 310 nm.
weighing bottle. About 10ml of solvent mixture of
dichloromethane: methanol (6:4) / chloroform / acetone
Preparation of Phosphate Buffer pH 7.4: Accurately
were added and shaked to prevent the formation of lumps
measured 250 ml of 0.2 M potassium dihydrogen phosphate
and kept aside for swelling of polymers. After complete
(KDHP) was taken in a 1000 ml of volumetric flask and
solubilization of polymers in mixture of solvent, required
added 195.5 ml of 0.2 M sodium hydroxide, and then water
quantity of dibutyl phthalate was added to the mixture and
was added to make up the volume and adjusted pH 7.4 by
stirred. Finally weighed quantity of OSH was dissolved in
using 0.2 M KDHP/sodium hydroxide.
5ml of solvent mixture, added to the polymer solution and
mixed well. It was set-aside for some time to exclude any
807
3. Research J. Pharm. and Tech. 4(5): May 2011
entrapped air and was then transferred into a previously membranes (in weight %) was calculated in terms of
cleaned Petri plate (70.00 cm2) and kept aside for solvent percentage increase in weight of membrane over the initial
evaporation. The rate of solvent evaporation was controlled weight of the specimen. The experiments were carried out
by inverting a glass funnel over the Petri plate. After 12h, in triplicate and the average values were used for the
the dried films were taken out and stored in a desiccator. calculation. The percentage degree of swelling (DS) was
The composition of the patches is given in Table 1. calculated as
Evaluation of Transdermal Patches: DS%= Ws-Wd/Wd * 100
Physical Methods: Where Ws and Wd indicate the weight of the swollen
Weight Variation: All the transdermal patches were and dry membranes respectively
visually inspected for color, clarity, flexibility &
smoothness. Drug Content Determination: The patch of area 3.83 cm2
was cut and dissolved in PBS pH 7.4. Then ethanol and
Thickness: Thickness of the patches was assessed at 3 dichloromethane were added to the mixture to make
different points using digital micrometer (Digital Caliper, polymer soluble, and the remaining volume was made up
Aerospace, India). For each formulation, three randomly with PBS pH 7.4 to 100 ml in 100 ml volumetric flask.1 ml
selected patches were used. was withdrawn from the solution and diluted to 10 ml. The
absorbance of the solution was found at 310 nm and
Physical Appearance: Three disks of 2x2 cm were cut and concentration was calculated. By correcting dilution factor,
weighed on electronic balance (Shimadzu, Aux*220) for the drug content was calculated.21
weight variation test. The test was done to check the
uniformity of weight and thus check the batch- to- batch Water Vapour Transmission Rate: Glass vials of 5 ml
variation. 16 capacity were washed thoroughly and dried to a constant
weight in an oven. About 1 g of fused calcium chloride was
Flatness: Longitudinal strips were cut out from each patch, taken in the vials and the polymer films of 3.83 cm2 were
one the centre and two from either side. The length of each fixed over the brim with the help of an adhesive tape. Then
strip was measured and the variation in the length was the vials were weighed and stored in a humidity chamber of
measured by determining present constriction, considering 80-90 % RH condition for a period of 24 h. The vials were
0% constriction equivalent to 100% flatness18. removed and weighed at 24 h time intervals to note down
the weight gain. The values are noted in table 4. Water
Folding Endurance: The folding endurance of the vapour transmission rate is expressed as the number of
prepared patch was measured manually. A strip of the film grams of moisture gained/hr/cm2. 22
(4x3 cm) was cut evenly and repeatedly folded at the same
place till it was broken. The thinner the patch more flexible Water Vapour Transmission Rate= Final weight-Initial
it is.19 weight/ Time*Area
Moisture Uptake: The patches were placed in the
Permeation Studies:
desiccators containing 200 ml of saturated potassium
In vitro Permeation Studies using Dialysis Membrane: In
chloride to get the humidity inside the desiccators at 84 %
vitro permeation of OSH from Transdermal patches through
RH. After 3 days the films were taken and weighed, the
dialysis membrane (Hi-Media) with molecular weight cut
percentage moisture absorption of the patch was found.19
off of 12000 was studied. The membrane was mounted over
a Franz diffusion cell and a transdermal patch. The receiver
% moisture absorbed= Final weight-Initial weight/ Initial compartment of the diffusion cell was filled with 15.0 ml of
weight * 100. PBS pH 7.4 and the setup was placed over a magnetic
stirrer with temperature maintained at 370C. Samples of 3
Moisture Content: The patches were weighed ml were withdrawn and replenished immediately from the
individually and kept in a desiccator containing fused receiver compartment at 1, 2, 3, 4, 6 and 12h. They were
calcium chloride at 40 ºC for 24 h. The patches were stored in refrigerated condition till the analysis was
reweighed until a constant weight was obtained. Moisture performed. The content of drug in the samples was
content was calculated in percentage based on the analyzed by UV-Visible spectrophotometer at 310 nm.
difference between the initial and constant final weights. An .
average of three readings was noted20. Ex vivo Rat Skin Permeation Studies:
Preparation of skin: A full thickness of skin was excised
Swelling Study: Completely dried membranes with a from dorsal site of dead rat and was washed with water. The
specified area (3.83 cm2) were weighed and put in fatty tissue layer was removed by using nails of fingers. The
desiccators for 24 h. They were removed and exposed to outer portion with hairs was applied with depilatory and
relative humidity conditions of 75 % (containing saturated allowed to dry. With the help of wet cotton the hairs were
solution of sodium chloride) in desiccators. Weight was scrubbed and washed with normal saline solution. The skin
taken on a single pan balance periodically until a constant was kept in normal saline solution and stored in refrigerator
weight was obtained. The swelling capacity of the
808
4. Research J. Pharm. and Tech. 4(5): May 2011
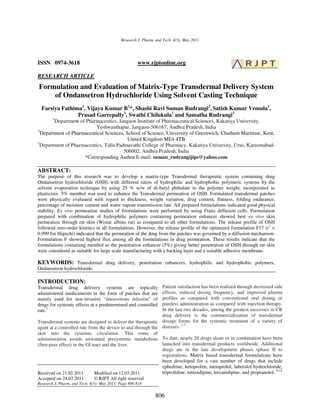
until further use. The skin was allowed to equilibrate with Table 3: Standard graph of OSH in PBS pH 7.4
room temperature prior to use and was mounted between CONCENTRATION(µG/ML) ABSORBANCE
donor and receptor compartment of cell. It was clamped in 0 0.00
2 0.129
such a way that the dermal side was in contact with receptor 4 0.231
23
medium . 6 0.359
8 0.482
Method: PBS pH 7.4 was used as receptor solution. The 10 0.591
volume of diffusion cell was 15 ml and stirred with 12 0.697
14 0.837
magnetic beads. The temperature was maintained at 37 ± 16 0.982
1°C with the help of hot plate. The diffusion was carried out Slope 0.06
for 10 h and 3 ml sample was withdrawn at an interval of 1 R2 0.998
h. The same volume of PBS pH 7.4 was added to receptor
compartment to maintain sink conditions and the samples
were analyzed at 310 nm.
Analysis of Permeation Data:
Determination of Flux: The flux (J) of OSH was
calculated from the slope of the plot of cumulative amount
of drug permeated per cm2 of skin at steady state against the
time using linear regression analysis. The steady state
permeability coefficient (Kp) of the drug through rat
epidermis was calculated by equation:
Kp =J / C
Where, J= flux (µg/cm2/hr) and C= concentration of drug
in the patch Fig.1: Standard curve of OSH
Kinetic Modeling of Drug Release: Various models were
tested for explaining the kinetics of drug release. To analyze
the mechanism of the drug release rate kinetics of the
dosage form, the obtained data were fitted into zero-order,
first order, Higuchi, and Korsmeyer-Peppas release
model.24-27
Stability study of Optimized Formulation: Stability
studies were carried out at 45 °C and 75% RH for three
months (climatic zone IV condition for accelerated testing)
to assess their long-term (2 years) stability of Transdermal
formulation. The protocols of stability studies were in
compliance with the guidelines in the WHO document for
stability testing of products intended for the global market.
After 3 months samples were withdrawn and evaluated for
physical properties and in vitro diffusion study. 28 Fig2a: In-vitro release profile of F1-F7
RESULTS AND DISCUSSION:
Preformulation study: Preformulation studies were
primarily done to investigate the physical properties of
drug.
Solubility Study: Ondansetron was best soluble in the PBS
Buffer pH 7.4. The solubility results are shown in Table 2.
Table 2: Solubility data for OSH
SOLUBILITY TIME DURATION SOLUBILITY
MEDIUM ( g/ml)
Distilled water 24 hours 62.03±3.35
48 hours 78.63±1.25
Buffer pH 7.4 24 hours 82.14±1.49
48 hours 96.34±1.92 Fig.2b: In-vitro release profile of F8-F12
809
6. Research J. Pharm. and Tech. 4(5): May 2011
Fig.2c: In vitro release profile of F13-F17 Fig.3b: Ex vivo release profile of F8-F12
Fig.3a: Ex vivo release profile of F1-F7 Fig.3c: Ex vivo release profile of F13-F17
Table 6b: Ex vivo diffusion release data for F8-F12
Cumulative % drug permeated
Time F8 F9 F10 F11 F12
0 0.00 0.00 0.00 0.00 0.00
1 4.36±0.61 4.59±0.71 4.85±0.81 4.94±0.85 4.99±0.89
2 7.70±0.63 8.03±0.72 8.57±0.83 8.83±0.87 8.96±0.92
3 10.70±0.67 11.88±0.75 12.61±0.86 13.63±0.89 14.23±0.95
4 15.09±0.69 16.37±0.77 18.01±0.89 19.20±0.93 20.04±0.98
5 20.42±0.72 21.65±0.81 23.42±0.91 24.27±0.96 25.70±1.02
6 25.73±0.74 27.45±0.83 29.00±0.94 31.21±0.99 30.63±1.06
12 54.84±0.75 56.64±0.85 59.25±0.97 61.88±1.03 63.17±1.11
Release profile data with mean ±SD
Table 6c: Ex vivo diffusion release data for F13-F17
Cumulative % drug permeated
Time F13 F14 F15 F16 F17
0 0.00 0.00 0.00 0.00 0.00
1 4.27±0.81 5.02±0.85 6.01±0.91 8.19±0.97 8.27±1.01
2 8.57±0.82 9.03±0.87 9.57±0.93 16.16±0.99 17.3±1.04
3 12.65±0.85 15.04±0.91 17.00±0.96 23.10±1.02 24.28±10.8
4 17.79±0.87 21.28±0.93 22.15±0.97 32.59±1.06 35.36±1.11
5 24.59±0.89 26.90±0.95 28.15±0.98 40.17±1.09 42.84±1.14
6 31.61±0.92 31.78±0.97 35.33±0.99 48.59±1.11 48.76±1.18
12 60.27±0.94 63.64±0.99 68.47±1.02 70.63±1.15 73.15±1.21
Release profile data with mean ±SD
811
7. Research J. Pharm. and Tech. 4(5): May 2011
Table 7: Ex vivo skin permeation steady state flux, permeability coefficients of Transdermal patches
Formulation code Flux (µgcm-2h-1) Permeability coefficient (Kp)
F1 4.266 0.533
F2 4.336 0.542
F3 4.433 0.554
F4 4.676 0.584
F5 4.851 0.606
F6 4.928 0.616
F7 5.041 0.630
F8 4.686 0.585
F9 4.824 0.603
F10 5.035 0.629
F11 5.268 0.658
F12 5.355 0.669
F13 5.203 0.65
F14 5.388 0.673
F15 5.779 0.722
F16 5.683 0.710
F17 5.937 0.742
Table 8: Ex vivo skin permeation kinetics followed by formulations of OSH Transdermal patches
Formulation code Zero order model First order model R2 Higuchi model Peppas model
R2 R2
n R2
F6 0.990 0.847 0.958 0.992 0.989
F8 0.994 0.771 0.971 0.703 0979
F17 0.971 0.970 0.972 0.766 0.991
Table 9: Physical evaluation data of OSH Transdermal patches before and after 3 months
Formulation Weight Thickness Folding (%)Moisture (%)Moist WVT Drug Swellability
code variation (mm) endurance uptake ure Rate(g.cm2/ content (%)±SD
(mg) ±SD ±SD ±SD ±SD content day X10-4 (%)±SD
±SD ±SD
F6 Before 66.39±1.8 0.025±1.6 71±1.8 4.75±1.08 4.63±0.67 3.14±0.17 98.34±0.3 21.67±0.46
After 66.58±1.6 0.027±1.6 72±2.1 4.97±1.17 4.82±1.38 3.25±0.18 99.17±0.3 22.01±0.38
F8 Before 67.28±1.7 0.045±1.8 77±1 4.93±0.6 3.12±0.3 3.66±0.13 99.38±0.4 38.59±0.61
After 67.91±1.7 0.046±1.7 78±1 4.98±0.6 3.26±0.3 3.82±0.12 99.75±0.4 39.48±0.45
F17 Before 64.46±1.5 0.036±1.3 79±1 5.03±0.4 5.01±0.6 4.38±0.21 98.83±0.7 48.34±0.42
After 64.83±1.4 0.037±1.3 80±2 4.98±0.5 4.99±0.7 4.48±0.21 99.15±0.8 48.92±0.64
Table10: In vitro drug release data of optimized formulations before and after 3 months
OPTIMIZED Before stability After stability
FORMULATION
CODE 0 month 1st month 2nd month 3rd month
F6 92.98±1.18 93.06±1.19 93.13±1.20 93.21±1.21
F8 93.19±0.49 93.38±0.51 93.45±0.52 93.49±0.54
F17 98.43±0.75 98.56±0.76 98.62±0.77 98.71±0.79
SIMILARITY FACTOR 80.23
Table 11: Ex vivo skin permeation steady state flux, permeability coefficient, kinetics followed by optimized formulations of transdermal
patches
Formulation Flux (µgcm-2h-1) Permeability Zero order First order Peppas model
code coefficient (Kp) model R2 model R2 HiguchimodelR2
n R2
F6 4.968 0.636 0.987 0.849 0.921 0.993 0.991
F8 4.716 0.592 0.999 0.781 0.976 0.711 0981
F17 5.981 0.761 0.999 0.975 0.977 0.774 0.992
Standard graph of OSH in PBS pH 7.4: Standard graph The physical evaluation of Transdermal patches for all
of drug was plotted as per the procedure in experimental formulations was performed. Weight variation was found in
method and its linearity was shown in table 3 and graph. the range of 64.21±1.4 to 68.94±1.8 and thickness was
The standard graph showed good linearity with R2 of 0.998 found to be between 0.024±1.6 to 0.047±1.9. The results of
which indicates that it obeys “Beer-Lambert’s” law. flatness study showed that none of the formulations had the
difference in the strip lengths before and after longitudinal
812
8. Research J. Pharm. and Tech. 4(5): May 2011
cut, indicating 100% flatness, thus they could maintain a the slope (0.992) indicated that the drug released by zero
smooth surface when applied to the skin. The folding order type as shown in Table 8.
endurance was found to be in the range of 71±0.9 to 80±2
which indicated that the patches would not break and would Stability: After storage, the formulations were subjected to
maintain their integrity with general skin folding when drug content, physical evaluation and in vitro release
used. The folding endurance of Eudragit patches was higher studies. The statistical analysis of these parameters after
than patches containing Ethyl cellulose and PVA-PVP. storage at 45 °C and 75% RH for three months showed no
Drug content was found to be in the range of 96.48±0.5 to significant change Table 9-11.
101.17±0.3 indicating that the drug was uniformly
distributed throughout the patches and evidenced by the low ACKNOWLEDGEMENTS:
values of SD. Hydrophilic polymers showed considerable We would like to express our deepest gratitude towards
swelling, as they increased the surface wettability and Prof. Stephen. R. Wicks, University of Greenwich, U.K.,
consequently water penetration within the matrix varied Prof. D. Rambhau and Prof. Shashank Apte, Natco
between 12.73 to 48.92%. Research Centre, Hyderabad for their noble guidance
throughout the project.
Patches containing higher amount of PVP showed good
water vapour transmission (4.48±0.21) than that of Eudragit CONCLUSION:
and Ethyl cellulose patches. The enhancement of water Seventeen formulations were prepared using different
vapour permeation with increase of PVP is due to the polymers in different ratios and combinations, along with
irregular arrangement of molecules in the amorphous state, plasticizers and penetration enhancer. Mercury was used as
which causes the molecules to be spaced further apart than a substrate for pouring the polymeric solution. The films
in crystal. Hence the specific volume is increased and the were evaluated for uniformity of thickness, weight
density decreased compared to that of crystal, which leads variation, drug content, folding endurance, % elongation, %
to the absorption of vapour into their interstices. All the moisture absorption, moisture content, water vapour
formulations were permeable to water vapour. transmission study, in vitro release and ex-vivo diffusion
studies using Franz diffusion cell. The formulations
Diffusion Studies: followed the Higuchi’s model for the drug diffusion study.
In vitro Release: The in vitro release studies were Since the formulations follow Higuchi’s model, thus they
conducted for all the formulations and the data was indicate diffusion mechanism. The Peppa’s plot showed the
represented in tables 5a, b and c. The in-vitro release n value of 0.766 for formulation F17, thus indicating non-
profiles for all the formulations were shown in fig.2a, b and fickian diffusion. There is scope for the further study and
c. The percentage release was found to be highest (98.43%) development of the Ondansetron Hydrochloride
for formulation carrying PVA: PVP in ratio 2:8 because of Transdermal patches.
the hydrophilic nature of the polymer.
REFERENCES:
Ex vivo Permeation Studies: The cumulative amount 1) Chien YW. Novel Drug Delivery Systems. Drugs and the
permeated was calculated and presented in tables 6a, b and Pharmaceutical Sciences. Marcel Dekker, New York. 1992.
c and figures 3a, b and c. It was higher in case of PVA-PVP 2) Kydonieus A and Berner B. Transdermal Delivery of Drugs.
polymer containing matrix. CRC Press, Boca Raton, Florida. 1987.
3) Chien Y. Transdermal Controlled System Medications. Marcel
Dekker, New York. 1987.
The reason for high release from PVA-PVP polymers could 4) Hadgraft J and Guy R. Transdermal Drug Delivery:
be explained by the hydrophilic nature of the polymers and Developmental Issues and Research Initiatives. Marcel Dekker,
due to leaching of PVP and pore formation. This leads to an New York. 1989.
increase in the external film area exposed to the solvent, 5) Gurney R and Teubner A. Dermal and Transdermal Drug
Delivery. Stuttgart: Wissenschaftliche Verlagsgesellschaft, 1993.
increased internal porosity and decreased tortuosity. The
6) Ghosh T, Pfister W and Yum S. Transdermal and Topical Drug
enhancement in solubility of drug increased with Delivery Systems. Interpharm Press, Buffalo Grove, Illinois.
thermodynamic activity that facilitated permeation of dug 1997.
across the skin. The patch coded F1 (EC: PVP 8:2) showed 7) Brahmankar DM and Jaiswal SB. Biopharmaceutics and
the slowest permeation. This could be attributed to the Pharmacokinetics- A Treatise. Vallabh Prakashan, New Delhi,
hydrophobic nature of the polymer which helped to retain India. 1995.
8) Aquil M, Sultana Y and Ali A. Matrix type transdermal drug
the drug in the matrix by reducing the penetration of the delivery systems of metoprolol tartrate: In vitro characterization.
solvent molecules into the patch. On the basis of the ex vivo Acta Pharm, 53; 2003: 119-125.
skin permeability experiment, it appeared that menthol at a 9) Ramesh G, Vamshi Vishnu Y, Kishan V and Madhusudan Rao Y.
concentration of 5% w/w was effective for enhancing the Development of nitrendipine transdermal patches: in vitro and ex
transdermal transport of Ondansetron. The permeability vivo characterization. Current Drug Del, 4; 2007: 69-76.
10) Singh J, Tripathi KP and Sakia TR. Effect of penetration
coefficients were in the order of 0.533 to 0.742 (table-7). enhancers on the in vitro transport of ephedrine through rat skin
and human epidermis from matrix based transdermal
Kinetic Modelling of Drug Release: The drug release formulations. Drug Dev. Ind. Pharm, 19; 1993: 1623-1628.
from OSH matrix patches was best explained by the
Korsmeyer and Peppas model and zero order. The value of
813
9. Research J. Pharm. and Tech. 4(5): May 2011
11) Valenta C and Almasi-Szabo I. In vitro diffusion studies of
ketoprofen transdermal therapeutic system. Drug Dev. Ind.
Pharm, 21, 1995:1799-1805.
12) Krishna R and Pandit JK. Transdermal delivery of Propranolol.
Drug Dev. Ind. Pharm, 20, 1994: 2459-2465.
13) Aqil M, Zafar S, Ali A and Ahmad S. Transdermal drug delivery
of labetolol hydrochloride: System Development, In vitro; Ex
vivo, and In vivo characterization. Curr Drug Deliv, 2(2); 2005:
125-31.
14) Shin, S. and Lee, H. Enhanced transdermal delivery of
triprolidine from the ethylene-vinyl acetate matrix. Eur. J. Pharm.
Biopharm, 54; 2002: 161-164
15) Murthy S N, Sateesh M and Hamsa V. Drug release from
terbutaline sulphate Transdermal Films across human cadaver
skin, Indian J Pharm Sci. 59(2); 75-76
16) Saxena M, Mutalik S and Reddy MS. Formulation and evaluation
of Transdermal patches of metoclopramide hydrochloride. Indian
drugs. 43(9); 2006:740-5.
17) Ubaidulla U, Reddy MV and Ruckmani K. Transdermal
therapeutic system of Carvedilol: Effect of hydrophilic and
hydrophobic matrix on in vitro and in vivo characteristics. AAPS
Pharmsci Tech. 2007; 8(1).
18) Arora P and Mukherjee B. Design, development,
physicochemical and in vitro and in vivo evaluation of
Transdermal patches containing diclofenac diethylammonium
salt. J Pharm Sci. 91; 2002: 2076-2089.
19) Devi K, Saisivum S, Maria GR, Deepti PU. Design and
evaluation of matrix diffusion controlled Transdermal patches of
verapamil hydrochloride. Drug Dev Ind Pharm. 5; 2003: 495-503.
20) Rajan R. et al Design and in vitro evaluation of Chlorpheniramine
maleate from different Eudragit based matrix patches: Effect of
plasticizer and chemical enhancers. Ars Pharm. 50 (4); 2010:177-
194.
21) Prashant M, Satturwar S, Fulzele V and Avinash K. Dorle
Evaluation of polymerized rosin for the formulation and
development Transdermal drug delivery systems. AAPS
PharmSciTech 6(4); 2005:48-53.
22) Carmelo Puglia and Francesco Bonina. Effect of Polyunsaturated
Fatty Acids and some conventional Penetration Enhancers on
Transdermal Delivery of Atenolol. Drug Delivery. 15; 2008:
107–112.
23) Bharkatiya M and Nema RK. Skin penetration enhancement
techniques J. Young Pharm. 1(2); 2010:110-115.
24) Higuchi T. Mechanism of sustained-action medication:
theoretical analysis of rate of release of solid drugs dispersed in
solid matrices, J. Pharm Sci. 52; 1963:1145-1149.
25) Higuchi T. Rate of release of medicaments from ointment bases
containing drugs in suspension. J. Pharm Sci. 50; 1961:874-875.
26) Korsmeyer R, Gurny R and Peppas N. Mechanisms of solute
release from porous hydrophilic polymers. Int J. Pharm. 15;
1983:25-35.
27) Peppas NA. Analysis of Fickian and non-Fickian drug release
from polymers. Pharm Acta Helv. 60; 1985:110-111
28) Eseldin K, Rakesh KS, Esmaeil B and Abd-alkadar ZA.
Transdermal Drug Delivery System- Design and Evaluation.
International Journal of Advances in Pharmaceutical Sciences.1;
2010: 201-211.
814