SlideShare uma empresa Scribd logo
1 de 22
Baixar para ler offline
Ulus, F., Kose, O, Ertek, G. and Sen, S. (2006). "Financial benchmarking of transportation
companies in the New York Stock Exchange (NYSE) through data envelopment analysis (DEA)
and visualization.” 4th International Logistics and Supply Chain Congress, İzmir, Turkey.

Note: This is the final draft version of this paper. Please cite this paper (or this final draft) as
above. You can download this final draft from http://research.sabanciuniv.edu.


    FINANCIAL BENCHMARKING OF TRANSPORTATION COMPANIES
           IN THE NEW YORK STOCK EXCHANGE (NYSE) THROUGH
       DATA ENVELOPMENT ANALYSIS (DEA) AND VISUALIZATION


                             Firdevs Ulus1, Özlem Köse2, Gürdal Ertek3, and Simay Şen4


                                                                   Abstract

In this paper, we present a benchmarking study of industrial transportation companies traded in
the New York Stock Exchange (NYSE). There are two distinguishing aspects of our study: First,
instead of using operational data for the input and the output items of the developed Data
Envelopment Analysis (DEA) model, we use financial data of the companies that are readily
available on the Internet. Secondly, we visualize the efficiency scores of the companies in relation
to the subsectors and the number of employees. These visualizations enable us to discover


1
  Sabancı University, Turkey,
2
  Sabancı University, Turkey,
3
  Sabancı University, Turkey,
4
  Sabancı University, Turkey,


4th International Logistics and Supply Chain Management Congress
interesting insights about the companies within each subsector, and about subsectors in
comparison to each other. The visualization approach that we employ can be used in any DEA
study that contains subgroups within a group. Thus, our paper also contains a methodological
contribution.


Keywords: Financial benchmarking, Data Envelopment Analysis, Data Visualization, Logistics,
Transportation, Delivery Services, Railroad Transportation, Marine Transportation, Trucking,
New York Stock Exchange


1. Introduction

Logistics is often considered as “movement of goods”, a definition which is not totally wrong, but has to degree of
limited meaning. In fact, with its growing field of operations, including transportation, planning, warehousing and
many more disciplines, logistics has become an indispensable part of the business world especially in recent
decades. The statistics covering many sectors point out this fact: 10 to 35% of gross sales of companies are spent on
logistics costs (Projects Monitor).

Logistics is a component of the value chain which can bring significant competitive advantage to the firm. A well
known example of this fact is the great success of Wal-Mart in the retail industry (Stalk, Evans, & Shulman, 1992).
Wal-Mart is reported to achieve its phenomenal success thanks to its efficient logistics operations and specifically to
its successful implementation of crossdocking. Companies may prefer to carry out the logistics operations within
their own structure or may prefer to outsource it to companies that are specialized in logistics, namely “logistics
companies”. The main cost component in logistics is typically transportation. So we have decided to focus on the
industrial transportation sector, and analyzed industrial transportation companies.

Financial benchmarking makes it possible to compare companies in an industry based on their financial
statements. Companies can compare their financial statements and managerial strategies with those of their
competitors, and can identify suitable strategies to prevail in their industries. Financial benchmarking is a subject
which is commonly examined in the academic environment. There are some visualization approaches such as Self
Organizing Maps (SOM), and some mathematical methods such as Stochastic Frontier Approach (SFA),
Distribution-Free Approach (DFA), Data Envelopment Analysis (DEA), etc. In this paper, we prefer to employ DEA
since it has some eligibility among all other methods besides the advantage that it is a nonparametric technique
which requires fewer assumptions (Weill, 2004). Furthermore, Weill’s (2004) study proves that DEA is also
consistent with standard measures of performance such as DFA and SFA. In addition to its consistency, DEA can
reveal the reason for a company being inefficient, and shows how to restore the fund to its optimum of efficiency
(Galagedera & Silvapulle, 2002).


4th International Logistics and Supply Chain Management Congress
In this study, we gathered the financial statements for 2005 of the industrial transportation companies traded in
New York Stock Exchange (NYSE), and carried out a benchmarking study among them through DEA. The results of
DEA were visualized by Miner3D (Miner3D) in order to detect patterns and derive useful insights.


2. Methodologies

2.1 Data Envelopment Analysis

Data Envelopment Analysis (DEA) is an approach which is used to measure efficiency (or productivity) of an
activity or entity (named Decision Making Unit, DMU). Measuring total productivity is difficult with multiple
inputs and outputs since it requires choosing weights for inputs and outputs. The most useful property of DEA is
the fact that it does not make any assumptions to choose these weights: Instead, the weights are directly derived
from the data. The “best” weights, which have the most adequate properties to be used for benchmarking of the
DMUs, are chosen by the model itself. Thus, these weights are not fixed but they are defined as variables. Since the
weights of the inputs and outputs are determined from the data, their units do not need to be congruent. In other
words, the units can be of different types (ex: workers, machines, dollars, units). The DMUs which have the highest
rank of efficiency levels all together determine the efficient frontier and the other (inefficient) DMUs’ scores are
calculated according to this efficient frontier. The efficient DMUs that reside on the efficient frontier and have
efficiency equal to 1 are same as or superior than the inefficient DMUs (that have efficiency less than 1) in all
productivity dimensions. However, they can not be superior to each other in every dimension, i.e., they are inferior
to each other in at least one dimension. Thus, the efficiencies measured in DEA can be alternatively defined as the
relative efficiencies.

The properties explained above are illustrated in the example below. If there is one input (in this case, number of
employees) and two outputs (sales and number of customers); a given data of 7 DMUs can be visualized as in Figure
1. The DMUs B, E, C and F create the efficient frontier and they all are efficient, whereas the DMUs A, D and G form
the set of inefficient DMUs. The efficiencies of the DMUs on the frontier are all equal to 1, since they have the
perfect efficiency compared to others. The inefficient DMUs’ efficiencies are calculated by taking the efficient
frontier into account. For instance, the efficiency of D is |OD| / |OP|.


4th International Logistics and Supply Chain Management Congress
Figure 1. One input & two output case of DEA


The example above is a very simple one, and it is not possible to figure out the components of the graph such easily
when there are multiple inputs and outputs (which is the usual case in real world problems). Thus, a mathematical
modelling approach is devised in order to deal with the more complex problems.

One of the best known models generated to cope with this difficulty is the CCR Model, developed by Charnes,
Cooper & Rhodes (1978). CCR assumes that there is constant-returns-to-scale, which possibly is not the case in a
large number of real life problems. There are two variations of the CCR model, one of them is the input-oriented
model, and the other one is the output-oriented model. The input-oriented model is given below (Cooper, Seiford, &
Tone, 2006), with             denoting efficiency (virtual output/virtual input), X and Y denoting matrices formed
composed of sets of xj and yj vectors for the variables, i.e., X=(xj), Y=(yj).


( DLPI o ) min 
                   x0  X  0
                   Y  yo
                   0

In this model, the objective is to minimize the input by concurrently keeping the output at least the same. In the
output oriented CCR Model below, the objective is to maximize the output level by making use of at most the same
amount of input:


4th International Logistics and Supply Chain Management Congress
( DLPOo ) max 
                     x 0  X  0
                    y 0  Y  0
                     0

These two variations do not change the DMUs on the efficient frontier, but calculate the projections of the DMUs
differently.

Another known DEA Model is the BCC Model which is developed by Banker, Charnes, & Cooper (1984). Almost all
of the characteristics of the CCR Model also prevail for BCC Model. However, unlike the CCR Model, BCC Model
enables the problem to be variable-returns-to-scale. This property is assured through a convexity constraint which
makes the production frontier to be spanned by the convex hull of the DMUs. The mathematical model of input-
oriented BCC Model (Cooper, Seiford, & Tone, 2006) can be written as:


          ( BCC o ) max  B
                                B x 0  X  0
                               Y  y 0
                               e  1
                               0

where X=(xj) is the matrix of input variables and Y=(yj) is the output matrix of variables,  is a column vector and e
is the raw vector of 1’s. (See Appendix -Section 7.1- for further mathematical explanation of the models.)

In this study, the BCC Model is utilized since it can accommodate variable-returns-to-scale, without the restriction
of constant-returns-to-scale. Also, the input-oriented model is found to be more appropriate for this study since it is
much easier to set actionable goals for the input values in shorter time periods (Culliane, Song & Wang, 2005).


2.2 Data Visualization

Data visualization is a fundamental component of data analysis, and especially helps the analyst with detecting
outliers, finding patterns that are not suggested by standard statistical techniques, and coming up with new
hypotheses. The book by Chambers et al. (1983) is the classic source of reference for data visualization carried out
within the context of statistics. The visualizations (referred to as “graphical methods”) include quantile plots,
histograms, box plots, symmetry plots, scatter plots, quantile-quantile plots, etc., and could be generated by the
computers of 1980’s. However, these visualizations focused mostly on supporting statistical analysis, could display
a very limited number of data points, and did not make effective use of colors.

The field of computer science known as information visualization has emerged in the 1990’s and extends the
graphical methods of 1980’s to new dimensions. In information visualization, the idea is to detect undiscovered
patterns, come up with actionable insights, and generate maximum benefit out of –typically large scale– data.


4th International Logistics and Supply Chain Management Congress
Information visualization is built on ideas from data mining, statistics, and computer graphics; and compensates
for the shortcomings of graphical methods of 1980’s. Well-known sources on information visualization include
books by Spence (2001) and Soukup & Davidson (2002), web sites such as Olive (Olive), IV (IV), and review papers
including Keim (2002) and Hoffman & Grinstein (2002).

The visualization method that we employ in this paper is the “colored scatter plot” developed in the 1980’s, and is
referred to as “starfield display” in the information visualization literature. This visualization method is very simple,
yet can enable a great understanding of the visualized data. We carry out our visualizations using the Miner3D
software (Miner3D).


3. Related Literature

We believe that the work most related to our research is the one by Min and Joo (2006), where the authors carry
out a benchmarking study of six third party logistics (3PL) providers using DEA. They use financial data of accounts
receivables, salaries & wages, operating expenses and property & equipment as inputs in the model and operating
income as the output. Their study spans the years 1999-2002. The authors discovered that the strength of
companies’ service performances and the diversity of their 3PL services are correlated to their operational
efficiencies. The authors suggest several survival strategies based on their observations from the DEA.

DEA has also been employed in studies related with logistics and transportation, for comparing container ports’
efficiencies (Turner, Windle, & Dresner, 2004; Cullinane et al., 2006), estimating productivity of the trucking
industry in U.S. states with respect to fatalities (Weber, & Weber, 2004), deriving efficiency scores of urban rail
firms (Graham, 2006) and urban transit systems (Boame, 2004), evaluating performances of airlines (Chiou, &
Chen, 2006), and measuring operational pruductivity of warehouses (Hackman et al., 2001).

Scatter plot visualizations similar to the ones in our paper can be found in Frazelle (2002, pages 61-63), where
efficiency scores of warehouses (referred to as “Warehouse Performance Index”) are plotted against warehouse
sizes and material handling systems investments. These visualizations provide warehouse and logistics managers
with critical insights on strategic warehouse design issues.


4. Analysis and Results

4.1 Data Collection

The data for benchmarking is obtained from New York Stock Exchange (NYSE) and company websites: The marine
transportation, transportation, trucking, delivery and railroad subsectors of the industrial transportation sector are
selected for the study (NYSE Industries). There are 19 marine transportation, 9 transportation, 2 trucking, 3
delivery and 10 railroad companies listed under this sector. The annual reports of these companies for the year
2005 are compiled from their SEC (The Securities and Exchange Commission) filings. A company from marine


4th International Logistics and Supply Chain Management Congress
transportation (K-Sea Transportation Partners L.P.) and two companies from transportation (PHH Corporation,
Air castle Limited) have no annual reports available on the Internet for the year 2005; so these companies were not
considered. Also, Southeast Airport Group was eliminated from the transportation companies list since its business
includes mostly transportation of people. As a result, there are a total of 39 industrial transportation companies
that were benchmarked in this study and this number provides a very suitable working atmosphere for DEA.
Boussofiane et al. (1991) suggest that the number of DMUs to include in DEA should be at least equal to the number
of inputs multiplied by the number of outputs. In our study, this translates into at least 9 DMUs during the analysis
of each subsector.

In compiling the data from the annual reports, the income statements and the balance sheets were used. The total
revenue, total operating expenses, net income values were taken from the income statement, and total assets, total
liabilities and total shareholders equity data were taken from the balance sheet. All values were taken in millions of
US $. The reason for the selection of these values were the facts that it was possible to obtain them for all
companies and in their usage as inputs and outputs in DEA can be considered as simpler compared to other
potential data. The data that we used in DEA can be downloaded from the internet (Ertek). The inputs and outputs
in the DEA analysis were selected as follows:

         Inputs: Total operating expenses, Total assets, and Total liabilities

         Outputs: Total revenue, Net income, and Total shareholders equity

We have not been able to find a standard scheme for the selection of input and outputs in financial benchmarking
literature and thus have made the selections in the light of the fact that in DEA achieving more amount/quantity of
an output with less amount/quantity of an input is always preferred.


4.2 Visual Analysis

By feeding these inputs and outputs to the DEA-Solver software (Cooper, Seiford, & Tone, 2006), the efficiencies of
each DMU were determined. According to the results that were achieved, there are 12 transportation companies
that were found to be efficient. Efficiency scores of these companies and the inefficient ones are provided in the
Appendix - Section 7.2. These efficiency scores were then visualized by the Miner3D software (Miner3D) to search
for the possible patterns. The first graph plots the efficiency scores against the subsectors (Figure 2):

In Figure 2, the x-axis and also the colors indicate the subsectors under the industrial transportation sector. Blue
stands for delivery services (D), dark green stands for marine transportation (M), light green stands for railroad
(R), yellow stands for transportation (T) and red stands for trucking (U) companies.


4th International Logistics and Supply Chain Management Congress
Figure 2. Efficiency related with the subsectors


By examining Figure 2, one can discover the following insights:

Seven from among the 18 marine transportation companies are fully efficient, i.e. they all have efficiency scores of 1.
These companies are Arlington Tankers Ltd. (ATB), Diana Shipping Inc. (DSX), Ship Finance International Ltd.
(SFL), Frontline Ltd. (FRO), General Maritime Corp. (GMR), Seaspan Corp. (SSW) and Overseas Shipholding
Group Inc. (OSG). Also, there are four additional companies in this subsector, having a score greater than 0.80 and
these are U.S. Shipping Partners L.P. (USS), Double Hull Tankers Inc (DHT), Teekay Shipping Corp. (TK), and
Maritrans Inc. (TUG). When these 11 most efficient companies were investigated in detail, it was found out that
most of them focus on transportation of oil and petroleum. Among these 11 companies only DSX and SSW are not
operating in this subsector of marine transportation. One of these companies, DSX, transports coal, iron ore, grain
and dry cargoes. The other one, SSW, provides charter services to container liner companies. It can be said that
both of the services that these companies are involved in have the property of being unique among the marine
transportation companies in NYSE. Furthermore, in marine transportation subsector there are only two companies
having low (less than 0.5) efficiencies. These are Kirby Corp. (KSP) and Horizon Lines Holding Corp. (HRZ). Both


4th International Logistics and Supply Chain Management Congress
of them do not serve in the field of petroleum and oil transportation but they focus on different kinds of services.
KSP is a barge operator and HRZ is involved in transport of cargo such as building materials, consumer goods, and
food to and from the continental US and Alaska, Hawaii, Guam, and Puerto Rico.

In the field of transportation services, only one firm, World Fuel Services Corp. (INT), is fully efficient and the rest
of them have efficiency scores less than or equal to 0.5. The success of INT can be explained by the fact that it is the
only transportation firm that runs its business through integration of both marine and aircraft modes. This
company holds more than 10% of the global marine fuels market, and provides 24-hour fueling service to aircraft at
1,500 airports in more than 160 countries. It is possible to state that the considerably higher ranking marine
transportation sector in our research channel a significant portion of their financial resources to INT and this may
be the explanation behind its success. Meanwhile, we were amused to observe that the value of 0.5 acts much as a
border in all the subsectors (except delivery services) that separates the “leaders” and the “laggards” of that
subsector.

It is not so easy to see a definite pattern in the subsector of railway transportation. The graph gives the impression
that almost half of the companies are above the rank of 0.50. Considering the only two companies that have
efficiency scores of 1, namely Union Pacific Corp. (UNP) and Canadian National Railway Co. (CNI), it can be
possible to discover an interesting insight. UNP is involved in the business of transporting coal, chemicals,
industrial products, and other freight by using a system of more than 32,000 route miles in 23 states in two-thirds
of the western of US. On the other hand, CNI is recognized as Canadian’s top railroad operator. Both spread their
services over a wide network, a characteristic which is not possessed by the other companies in this subsector. A
detailed search on these “laggard” companies’ websites revealed that they mostly operate regionally.

In the subsectors of delivery and trucking services, it is difficult to see a pattern since there are too few companies.
Although it is not statistically appropriate to make generalizations, one can observe that delivery services have
much higher efficiencies compared to trucking services for the companies that we considered. The trucking
subsector has no companies having a score of 1; all the companies in this subsector have medium ranks of
efficiency.

The second graphical analysis from the results of the DEA shows the relation between the number of workers and
the efficiency scores (Figure 3).


4th International Logistics and Supply Chain Management Congress
Figure 3. Efficiency related with the number of employees


The first and obvious pattern in Figure 3 is the bimodal distribution of the railroad companies (indicated by the
label “R”). There are two major groups: One with small number of employees and low efficiency scores, and other
with large number of employees and high efficiency scores. These two groups are clearly separated. Although the
companies in each group have no clear patterns, the existence of two disconnected sets can lead one to hypothesize
that the railroad companies benefit from economies of scale.

When the marine transportation and transportation companies are examined, no clear pattern can be detected.
There companies all operate with less than 10,000 workers.

It is also not possible to identify a definite pattern about the trucking subsectors by considering the two trucking
companies that exist in NYSE.

Companies from the delivery subsector were not included in Figure 3. The reason for this was the fact that all of the
companies that belong to this industry have employee numbers between 40,000 and 407,000. Those numbers
would stand as clear outliers in the graph, and would cause a cluttering of the other companies in the graph. If we
sort the delivery companies amongst each other (Appendix – Section 7.2) it can be concluded that FedEx Corp.
(FDX) and United Parcel Service Inc. (UPS), which were the largest two delivery companies, have perfect efficiency


4th International Logistics and Supply Chain Management Congress
score of 1. Meanwhile, the considerably small TNT N.V. (TP) has significantly lower ranking in DEA results.
However, despite all these differences, all delivery companies have efficiency scores greater than 0.75, which leads
one to believe that this subsector of industrial transportation is more efficient than the other subsectors.


4.3 Marine Transportation

From marine transportation subsector in NYSE, 18 companies were considered. This number is sufficient to carry
out an independent analysis for this subsector. Thus we benchmarked these companies and found out a new
ranking amongst them. This new analysis gave a better understanding of this subsector’s own boundaries for being
efficient and made it possible to see the companies that should be taken as role models by the inefficient
companies. The reference sets found by DEA enable us to identify such patterns.

When the DEA is done for marine transportation subsector only, the most important change that can be observed is
the increase in the number of companies with efficiency score of 1 (Table 1).


4th International Logistics and Supply Chain Management Congress
Table 1. DEA results of the marine transportation subsector


RANK          SYMBOL                  DMU                                      SCORE


          1   ATB                     Arlington Tankers Ltd.                   1


          1   DSX                     Diana Shipping INC.                      1


          1   FRO                     Frontline Ltd.                           1


          1   GMR                     General Maritime Corp.                   1


          1   HRZ                     Horizon Lines Holding Corp.              1


          1   OSG                     Overseas Shipholding Group INC.          1


          1   SSW                     Seaspan Corp.                            1


          1   SFL                     Ship Finance International Ltd.          1


          1   TK                      Teekay Shipping Corp.                    1


        10    USS                     U.S. Shipping Partners L.P.              0.99


         11   DHT                     Double Hull Tankers Inc.                 0.90


         12   KSP                     Kirby Corp.                              0.87


         13   TUG                     Maritrans Inc.                           0.84


         14   NAT                     Nordic American Tanker Shipping Ltd.     0.70


         15   EXM                     Excell Maritime Carriers Ltd.            0.68


         16   OMM                     Omi Corp.                                0.68


         17   TNP                     Tsakos Energy Navigation Ltd.            0.64


        18    ISH                     International Shipholding Corp.          0.55


The independent analysis of the marine transportation subsector enables two companies (HRZ and TK) which did
not have perfect efficiencies to reach the ranking of 1. This result is meaningful because in the first analysis the
more efficient companies from other subsectors took place in efficient frontier instead of them. One of these two
companies, HRZ, became one of the most efficient companies; while in the analysis of whole data it was the worst
among the marine transportation subsector. This may seem strange however, it is possible that the efficient frontier


4th International Logistics and Supply Chain Management Congress
may differ dramatically for a subset of the DMUs compared to the complete set of DMUs. An example of such a
situtation for “one input & two outputs case” is illustrated in the Appendix - Section 7.3.

Table 2 involves the reference sets for the companies in the marine transportation subsector, which are not on the
efficient frontier. In our DEA for all companies, we did not made a research on reference sets, since the suggested
companies involved the companies from different subsectors, which would make the given set inadequate, due to
the difficulty of taking the policies of an other business subsector. Consequently, the table above gives only
references from the marine transportation sector, which would make the study more clear and meaningful. The
weights given on the right side of the reference DMUs sum up to 1 and if the firm is on the efficient frontier its only
reference is itself (with the weight of 1).


Table 2. Reference sets for the marine transportation companies


USS       DSX       0.34       SFL      0.66


DHT       ATB       0.20       DSX      0.77     SFL      0.03


KSP       GMR       0.35       HRZ      0.46     SFL      0.17     TK    0.02


TUG       DSX       0.40       SFL      0.60


NAT       DSX       0.79       SSW      0.08     SFL      0.13


EXM       DSX       0.93       GMR      0.04     SSW      0.03


OMM       FRO       0.06       GMR      0.14     OSG      0.08     SFL   0.66   TK   0.06


TNP       DSX       0.34       GMR      0.47     SFL      0.19


ISH       DSX       0.08       SFL      0.92


4.4 Railroad Transportation

In this section we repeat the results of an independent DEA for the railroad transportation subsector, because it is
the remaining candidate in the industrial transportation sector which has sufficient data for the study. Again for
this subsector, there is an increase in the number of companies which have efficiency scores of 1. BNI, CP, FLA and
GWR BNI, CP, FLA and GWR which are found inefficient in Section 4.2, are now found to be efficient in their
subsector. The reason for this increase in the number of efficient companies within this subsector is the same as the
reason for the marine transportation sector. The reference sets for the railroad transportation are shown in Table 4.


4th International Logistics and Supply Chain Management Congress
Table 3. DEA results of the railroad transportation subsector


Rank          SYMBOL         DMU                                         Score


         1    BNI            Burlington Northern Santa Fe Corp.          1


         1    CNI            Canadian National Railway Co.               1


         1    CP             Canadian Pacific Railway Ltd.               1


         1    FLA            Florida East Coast Industries Inc.          1


         1    GWR            Genese & Wyoming Inc.                       1


         1    UNP            Union Pacific Corp.                         1


         7    RRA            RailAmerica Inc.                            0.94


         8    NSC            Norfolk Southern Corp.                      0.92


         9    CSX            CSX Corp.                                   0.91


        10    KSU            Kansas City Southern                        0.79


Table 4. Reference sets for the railroad transportation companies


RRA           BNI           0.00          CP            0.01       GWR   0.99


NSC           BNI           0.20          CNI           0.73       CP    0.03    UNP   0.04


CSX           BNI           0.36          CNI           0.30       CP    0.31    UNP   0.02


KSU           BNI           0.05          CNI           0.02       CP    0.17    GWR   0.76


5. Conclusions and Future Research

We have carried out a financial benchmarking of industrial transportation companies using DEA and visualized the
results using Miner3D software. To the best of our knowledge, the colored scatter plots have not been used before
to visualize the results of DEA, thus we have made a methodological contribution. Our analysis revealed the
characteristics of companies within the subsectors of the industrial transportation sector, and compared the
efficiencies of different subsectors with each other.


4th International Logistics and Supply Chain Management Congress
There are two important future research areas that can be pursued as a continuation of our work. One is to carry
out formal statistical tests to prove or disprove the hypothesis formed by observing the visualizations. The other
area is the investigation of what other types of visualizations can be developed or adopted for analyzing the DEA
results.


6. References

Banker, R. D., Charnes, A., & Cooper, W. W. 1984. Some models for estimating technical and scale inefficiencies in
data envelopment analysis. Management Science, vol. 30: 1078–1092.


Boame, A. K. 2004. The technical efficiency of Canadian urban transit systems. Transportation Research Part
E, vol. 40: 401–416.


Chambers, J. M., Cleveland, W. S., Kleiner, B., & Tukey, P. A. 1983. Graphical methods for data analysis.
Pacific Grove, CA: Wadsworth & Brooks/Cole Publishing Company.


Charnes, A., Cooper, W. W., & Rhodes, E. 1978. Measuring the efficiency of decision making units. European
Journal of Operational Research, vol. 2: 429–444.


Chiou, Y., & Chen, Y. 2006. Route-based performance evaluation of Taiwanese domestic airlines using data
envelopment analysis. Transportation Research Part E, vol. 42: 116–127


Cooper, W. W., Seiford, L. M., & Tone, K. 2006. Introduction to data envelopment analysis and its uses.
New York, NY: Springer.


Cullinane, K., Wang, T., Song, D., & Ji, P. 2006. The technical efficiency of container ports: Comparing data
envelopment analysis and stochastic frontier analysis. Transportation Research Part A, vol. 40: 354–374.


Ertek. http://people.sabanciuniv.edu/ertekg/papers/2006/ulus_et_al_ilc2006.xls


4th International Logistics and Supply Chain Management Congress
Frazelle, E. H. 2002. World-class warehousing and material handling. McGraw-Hill.


Galagedera, D. U. A & Silvapulle, P. 2002. Australian mutual fund performance appraisal using data envelopment
analysis. Managerial Finance, 28(9): 60–73.


Graham, D. J. 2006. Productivity and efficiency in urban railways: Parametric and non-parametric estimates.
Transportation Research Part E.


Hackman, S. T., Frazelle, E. H., Griffin, P. M., Griffin, S. O., & Vlasta, D. A. 2001. Benchmarking warehousing and
distribution operations: an input-output approach. Journal of Productivity Analysis, vol. 16: 79–100.


Hoffman, P. E. & Grinstein, G. G. 2002. A survey of visualizations for high-dimensional data mining. Chapter 2,
Information visualization in data mining and knowledge discovery, Eds: Fayyad, U., Grinstein, G. G.,
& Wierse, A. 47–82


IV. http://iv.homeunix.org


Keim, D. A. 2002. Information visualization and visual data mining. IEEE Transactions on Visualization
and Computer Graphics, 8(1): 1–8


Min J. & Joo S. J. 2006. Benchmarking the operational efficiency of third party logistics providers using data
envelopment analysis. Supply Chain Management: An International Journal, 11(3): 259–265.


Miner3D. http://www.miner3d.com


NYSE. http://www.nyse.com


4th International Logistics and Supply Chain Management Congress
NYSE Industries. http://www.nyse.com/about/listed/industry.shtml?ListedComp=All


Olive (On-line Library of Information Visualization Environments). http://otal.umd.edu/Olive/


Projects Monitor. http://www.projectsmonitor.com/detailnews.asp?newsid=6968


Soukup, T., & Davidson, I. 2002. Visual data mining. New York, NY: John Wiley & Sons.


Spence, R. 2001. Information visualization. Essex, England: ACM Press.


Stalk, G., Evans, P. & Shulman, L. E. 1992. Competing on capabilities: the new rules of corporate strategy.
Harvard Business Review, 70(2)


Turner, H., Windle R. & Dresner M. 2004. North American containerport productivity: 1984–1997.
Transportation Research Part E, vol. 40: 339–356.


Weber, M. M., & Weber, W. L. 2004. Productivity and efficiency in the trucking industry. International Journal
of Physical Distribution & Logistics Management, 34 (1): 39-61


Weill, L. 2004. Measuring cost efficiency in European banking: a comparison of frontier techniques. Journal of
Productivity Analysis, vol. 21: 133–152.


7. Appendix


7.1 Further Explanation for the Models in Section 2.1


4th International Logistics and Supply Chain Management Congress
The objective of the CCR model is to maximize the efficiency  (virtual output / virtual input) for each DMU, in
order to obtain the values for the input “weights” (vi) and the output “weights” (ur) as variables. Also, the ratio of
virtual output to virtual input should not exceed 1 for any DMU. Thus, the fractional model can be written as:

                           s

                      u y
                       i 1
                                   i     io
( FPo ) max          m

                      v
                       j 1
                                   j   x jo

                        s

                      u y
                      i 1
                               i        ik

                      m
                                               1 k  1,...,n
                      v
                      j 1
                               j   x jk

                     u, v  0


The fractional model can be transformed into the linear model shown below.

                        s
( LPo ) max    u i yio
                      i 1
                      m

                     v x
                      j 1
                               j        jo    1

                       s                          m

                     u y
                      i 1
                               i       ik       v j x jk k  1,...,n
                                                  j 1

                     u, v  0


Finally, when the dual of the linear model is taken according to the variables shown in Table 6, the input oriented
CCR Model (DLPI0) is obtained as written in Section 2.1.


Table 6. The dual variables of CCR Model

Multiplier form                               Envelopment form           Envelopment form   Multiplier form


Constraint (LP0)                              Variable (DLP0)            Constraint (LP0)   Variable (DLP0)


Vx0=1                                                                   x0-X ≥ 0         v≥0


-vX+uY ≤ 0                                    ≥0                        Y ≥ y0            u≥0


4th International Logistics and Supply Chain Management Congress
The output oriented CCR Model is obtained similarly. Instead of maximizing the efficiency, the objective of the
fractional model minimizes the inverse of efficiency (1/ = virtual input / virtual output =). While taking the dual
for the linear model which is obtained from the fractional one;  stands for the dual variable of the second
constraint. By following these steps one can easily find the output oriented CCR Model given before.


The BCC Model presented in the body text is obtained by a very similar way of obtaining the input oriented CCR
Model. The only difference is the convexity constraint (e = 1) which allows the variable returns to scale.


4th International Logistics and Supply Chain Management Congress
7.2 Results of BCC input-oriented DEA for all industrial transportation companies in
NYSE


Table 5. Results of BCC input-oriented DEA


 Rank         DMU                                                  Symbol   Industry         Efficiency


         1    World Fuel Services Corp.                            INT      Transportation   1.00


         1    FedEx Corp.                                          FDX      Delivery         1.00


         1    Union Pacific Corp.                                  UNP      Railroad         1.00


         1    United Parcel Service Inc.                           UPS      Delivery         1.00


         1    Arlington Tankers Ltd.                               ATB      Marine           1.00


         1    Diana Shipping Inc.                                  DSX      Marine           1.00


         1    Canadian National Railway Corp.                      CNI      Railroad         1.00


         1    Ship Finance International Ltd.                      SFL      Marine           1.00


         1    Frontline Ltd.                                       FRO      Marine           1.00


         1    General Maritime Corp.                               GMR      Marine           1.00


         1    Seaspan Corp.                                        SSW      Marine           1.00


         1    Overseas Shipholding Group Inc.                      OSG      Marine           1.00


        13    U.S. Shipping Partners L.P.                          USS      Marine           0.99


        14    Burlington Northern Santa Fe Corp.                   BNI      Railroad         0.90


        15    Double Hull Tankers Inc.                             DHT      Marine           0.89


        16    Teekay Shipping Corp.                                TK       Marine           0.89


        17    Canadian Pacific Railway Ltd.                        CP       Railroad         0.87


        18    Norfolk Southern Corp.                               NSC      Railroad         0.86


4th International Logistics and Supply Chain Management Congress
19    Maritrans Inc.                                       TUG   Marine           0.84


       20     TNT N.V.                                             TP    Delivery         0.77


        21    CSX Corp.                                            CSX   Railroad         0.77


        22    Knight Transportation Inc.                           KNX   Trucking         0.70


        23    Nordic American Tanker Shipping Ltd.                 NAT   Marine           0.69


        24    Excell Maritime Carriers Ltd.                        EXM   Marine           0.65


        25    Tsakos Energy Navigation Ltd.                        TNP   Marine           0.64


        26    Omi Corp.                                            OMM   Marine           0.60


        27    Con-Way Inc.                                         CNW   Trucking         0.55


       28     International Shipholding Corp.                      ISH   Marine           0.55


        29    Kansas City Southern                                 KSU   Railroad         0.50


       30     Ryder System Inc.                                    R     Transportation   0.50


        31    Grupo TMM SA                                         TMM   Transportation   0.48


        32    Macquarie Infrastructure CO Trust                    MIC   Transportation   0.45


        33    Kirby Corp.                                          KSP   Marine           0.35


        34    Florida East Coast Industries Inc.                   FLA   Railroad         0.33


        35    Horizon Lines Holding Corp.                          HRZ   Marine           0.32


        36    TAL International Group                              TAL   Transportation   0.31


        37    Genese & Wyoming Inc.                                GWR   Railroad         0.28


       38     RailAmerica Inc.                                     RRA   Railroad         0.24


        39    Interpool Inc.                                       IPX   Transportation   0.17


4th International Logistics and Supply Chain Management Congress
7.3 Example for a dramatic change in efficient frontier

The example of a dramatic change in efficient frontier can be shown on the graph of the “one input & two output
case” example from section 2.1. If F and G are removed from the DEA analysis, the efficient frontier moves to its
new position shown by the red line in Figure 4 and the efficiency of D (which used to be less than 1) now becomes 1.


                     Figure 4. The change in efficient frontier when DMUs F and G are removed.


4th International Logistics and Supply Chain Management Congress

Mais conteúdo relacionado

Destaque

Algorithms for generalized mean variance problems
Algorithms for generalized mean variance problemsAlgorithms for generalized mean variance problems
Algorithms for generalized mean variance problemsguest5fe40a
 
Denoising Process Based on Arbitrarily Shaped Windows
Denoising Process Based on Arbitrarily Shaped WindowsDenoising Process Based on Arbitrarily Shaped Windows
Denoising Process Based on Arbitrarily Shaped WindowsCSCJournals
 
Online Multi-Person Tracking Using Variance Magnitude of Image colors and Sol...
Online Multi-Person Tracking Using Variance Magnitude of Image colors and Sol...Online Multi-Person Tracking Using Variance Magnitude of Image colors and Sol...
Online Multi-Person Tracking Using Variance Magnitude of Image colors and Sol...Pourya Jafarzadeh
 
Digital marketing performance report - Q3 2011 - Efficient Frontier
Digital marketing performance report - Q3 2011 - Efficient FrontierDigital marketing performance report - Q3 2011 - Efficient Frontier
Digital marketing performance report - Q3 2011 - Efficient FrontierRomain Fonnier
 
Polyu Reference letter
Polyu Reference letterPolyu Reference letter
Polyu Reference letterKelvin Lam
 
Nduati Michelle Wanjiku Undergraduate Project
Nduati Michelle Wanjiku Undergraduate ProjectNduati Michelle Wanjiku Undergraduate Project
Nduati Michelle Wanjiku Undergraduate ProjectMichelle Nduati
 
Portfolio Balancing V3
Portfolio Balancing V3Portfolio Balancing V3
Portfolio Balancing V3IngemarAEH
 
Efficient Frontier Searching of Fixed Income Portfolio under CROSS
Efficient Frontier Searching of Fixed Income Portfolio under CROSSEfficient Frontier Searching of Fixed Income Portfolio under CROSS
Efficient Frontier Searching of Fixed Income Portfolio under CROSSSun Zhi
 
Portfolio Optimization Project Report
Portfolio Optimization Project ReportPortfolio Optimization Project Report
Portfolio Optimization Project ReportJohn Cui
 
ma574-final-paper
ma574-final-paperma574-final-paper
ma574-final-paperXuan Ning
 
CAPM Fama French
CAPM Fama FrenchCAPM Fama French
CAPM Fama FrenchAhmedSaba
 
67004276
6700427667004276
67004276prabu10
 
Fuzzy portfolio optimization_Yuxiang Ou
Fuzzy portfolio optimization_Yuxiang OuFuzzy portfolio optimization_Yuxiang Ou
Fuzzy portfolio optimization_Yuxiang OuYuxiang Ou
 

Destaque (20)

Output.pdf 12 env
Output.pdf 12 envOutput.pdf 12 env
Output.pdf 12 env
 
Algorithms for generalized mean variance problems
Algorithms for generalized mean variance problemsAlgorithms for generalized mean variance problems
Algorithms for generalized mean variance problems
 
6-ABSTRACT
6-ABSTRACT6-ABSTRACT
6-ABSTRACT
 
Genero
GeneroGenero
Genero
 
Denoising Process Based on Arbitrarily Shaped Windows
Denoising Process Based on Arbitrarily Shaped WindowsDenoising Process Based on Arbitrarily Shaped Windows
Denoising Process Based on Arbitrarily Shaped Windows
 
Online Multi-Person Tracking Using Variance Magnitude of Image colors and Sol...
Online Multi-Person Tracking Using Variance Magnitude of Image colors and Sol...Online Multi-Person Tracking Using Variance Magnitude of Image colors and Sol...
Online Multi-Person Tracking Using Variance Magnitude of Image colors and Sol...
 
Digital marketing performance report - Q3 2011 - Efficient Frontier
Digital marketing performance report - Q3 2011 - Efficient FrontierDigital marketing performance report - Q3 2011 - Efficient Frontier
Digital marketing performance report - Q3 2011 - Efficient Frontier
 
Polyu Reference letter
Polyu Reference letterPolyu Reference letter
Polyu Reference letter
 
Project Report
Project ReportProject Report
Project Report
 
Portfolio Analysis
Portfolio AnalysisPortfolio Analysis
Portfolio Analysis
 
Project final
Project finalProject final
Project final
 
Nduati Michelle Wanjiku Undergraduate Project
Nduati Michelle Wanjiku Undergraduate ProjectNduati Michelle Wanjiku Undergraduate Project
Nduati Michelle Wanjiku Undergraduate Project
 
Portfolio Balancing V3
Portfolio Balancing V3Portfolio Balancing V3
Portfolio Balancing V3
 
Efficient Frontier Searching of Fixed Income Portfolio under CROSS
Efficient Frontier Searching of Fixed Income Portfolio under CROSSEfficient Frontier Searching of Fixed Income Portfolio under CROSS
Efficient Frontier Searching of Fixed Income Portfolio under CROSS
 
Portfolio Optimization Project Report
Portfolio Optimization Project ReportPortfolio Optimization Project Report
Portfolio Optimization Project Report
 
ma574-final-paper
ma574-final-paperma574-final-paper
ma574-final-paper
 
CAPM Fama French
CAPM Fama FrenchCAPM Fama French
CAPM Fama French
 
SSRN-id2554642
SSRN-id2554642SSRN-id2554642
SSRN-id2554642
 
67004276
6700427667004276
67004276
 
Fuzzy portfolio optimization_Yuxiang Ou
Fuzzy portfolio optimization_Yuxiang OuFuzzy portfolio optimization_Yuxiang Ou
Fuzzy portfolio optimization_Yuxiang Ou
 

Semelhante a Financial Benchmarking Of Transportation Companies In The New York Stock Exchange (Nyse) Through Data Envelopment Analysis (Dea) And Visualization

Financial benchmarking of transportation companies in the New York Stock Exch...
Financial benchmarking of transportation companies in the New York Stock Exch...Financial benchmarking of transportation companies in the New York Stock Exch...
Financial benchmarking of transportation companies in the New York Stock Exch...Gurdal Ertek
 
Benchmarking The Turkish Apparel Retail Industry Through Data Envelopment Ana...
Benchmarking The Turkish Apparel Retail Industry Through Data Envelopment Ana...Benchmarking The Turkish Apparel Retail Industry Through Data Envelopment Ana...
Benchmarking The Turkish Apparel Retail Industry Through Data Envelopment Ana...ertekg
 
Benchmarking the Turkish apparel retail industry through data envelopment ana...
Benchmarking the Turkish apparel retail industry through data envelopment ana...Benchmarking the Turkish apparel retail industry through data envelopment ana...
Benchmarking the Turkish apparel retail industry through data envelopment ana...Gurdal Ertek
 
Rich routing problems arising in supply chain management (2012)
Rich routing problems arising in supply chain management (2012)Rich routing problems arising in supply chain management (2012)
Rich routing problems arising in supply chain management (2012)siska_suryanto
 
DEA-Based Benchmarking Models In Supply Chain Management: An Application-Orie...
DEA-Based Benchmarking Models In Supply Chain Management: An Application-Orie...DEA-Based Benchmarking Models In Supply Chain Management: An Application-Orie...
DEA-Based Benchmarking Models In Supply Chain Management: An Application-Orie...ertekg
 
Data envelopment analysis
Data envelopment analysisData envelopment analysis
Data envelopment analysisGlory Maker
 
Dea-based benchmarking models in supply chain management: an application-orie...
Dea-based benchmarking models in supply chain management: an application-orie...Dea-based benchmarking models in supply chain management: an application-orie...
Dea-based benchmarking models in supply chain management: an application-orie...Gurdal Ertek
 
HOPX Crossover Operator for the Fixed Charge Logistic Model with Priority Bas...
HOPX Crossover Operator for the Fixed Charge Logistic Model with Priority Bas...HOPX Crossover Operator for the Fixed Charge Logistic Model with Priority Bas...
HOPX Crossover Operator for the Fixed Charge Logistic Model with Priority Bas...IJECEIAES
 
Linear modeling in Transportation problem: Need of reliable Public transporta...
Linear modeling in Transportation problem: Need of reliable Public transporta...Linear modeling in Transportation problem: Need of reliable Public transporta...
Linear modeling in Transportation problem: Need of reliable Public transporta...IOSR Journals
 
5. working on data using R -Cleaning, filtering ,transformation, Sampling
5. working on data using R -Cleaning, filtering ,transformation, Sampling5. working on data using R -Cleaning, filtering ,transformation, Sampling
5. working on data using R -Cleaning, filtering ,transformation, Samplingkrishna singh
 
An application of fuzzy cognitive mapping in optimization of inventory functi...
An application of fuzzy cognitive mapping in optimization of inventory functi...An application of fuzzy cognitive mapping in optimization of inventory functi...
An application of fuzzy cognitive mapping in optimization of inventory functi...iaemedu
 
Sgd teaching-consulting-10-jan-2009 (1)
Sgd teaching-consulting-10-jan-2009 (1)Sgd teaching-consulting-10-jan-2009 (1)
Sgd teaching-consulting-10-jan-2009 (1)Sanjeev Deshmukh
 
Optimal Allocation Policy for Fleet Management
Optimal Allocation Policy for Fleet ManagementOptimal Allocation Policy for Fleet Management
Optimal Allocation Policy for Fleet ManagementYogeshIJTSRD
 
A Comparative Study Of Machine Learning Algorithms For Industry-Specific Frei...
A Comparative Study Of Machine Learning Algorithms For Industry-Specific Frei...A Comparative Study Of Machine Learning Algorithms For Industry-Specific Frei...
A Comparative Study Of Machine Learning Algorithms For Industry-Specific Frei...Karla Long
 
A framework for visualizing association mining results
A framework for visualizing association mining resultsA framework for visualizing association mining results
A framework for visualizing association mining resultsGurdal Ertek
 
Ijariie1117 volume 1-issue 1-page-25-27
Ijariie1117 volume 1-issue 1-page-25-27Ijariie1117 volume 1-issue 1-page-25-27
Ijariie1117 volume 1-issue 1-page-25-27IJARIIE JOURNAL
 

Semelhante a Financial Benchmarking Of Transportation Companies In The New York Stock Exchange (Nyse) Through Data Envelopment Analysis (Dea) And Visualization (20)

Financial benchmarking of transportation companies in the New York Stock Exch...
Financial benchmarking of transportation companies in the New York Stock Exch...Financial benchmarking of transportation companies in the New York Stock Exch...
Financial benchmarking of transportation companies in the New York Stock Exch...
 
Benchmarking The Turkish Apparel Retail Industry Through Data Envelopment Ana...
Benchmarking The Turkish Apparel Retail Industry Through Data Envelopment Ana...Benchmarking The Turkish Apparel Retail Industry Through Data Envelopment Ana...
Benchmarking The Turkish Apparel Retail Industry Through Data Envelopment Ana...
 
Newsletter 20.pdf
Newsletter 20.pdfNewsletter 20.pdf
Newsletter 20.pdf
 
Benchmarking the Turkish apparel retail industry through data envelopment ana...
Benchmarking the Turkish apparel retail industry through data envelopment ana...Benchmarking the Turkish apparel retail industry through data envelopment ana...
Benchmarking the Turkish apparel retail industry through data envelopment ana...
 
DEA
DEADEA
DEA
 
Rich routing problems arising in supply chain management (2012)
Rich routing problems arising in supply chain management (2012)Rich routing problems arising in supply chain management (2012)
Rich routing problems arising in supply chain management (2012)
 
DEA-Based Benchmarking Models In Supply Chain Management: An Application-Orie...
DEA-Based Benchmarking Models In Supply Chain Management: An Application-Orie...DEA-Based Benchmarking Models In Supply Chain Management: An Application-Orie...
DEA-Based Benchmarking Models In Supply Chain Management: An Application-Orie...
 
Data envelopment analysis
Data envelopment analysisData envelopment analysis
Data envelopment analysis
 
Dea-based benchmarking models in supply chain management: an application-orie...
Dea-based benchmarking models in supply chain management: an application-orie...Dea-based benchmarking models in supply chain management: an application-orie...
Dea-based benchmarking models in supply chain management: an application-orie...
 
DEA-Solver-Pro Version 14d- Newsletter17
DEA-Solver-Pro Version 14d- Newsletter17DEA-Solver-Pro Version 14d- Newsletter17
DEA-Solver-Pro Version 14d- Newsletter17
 
HOPX Crossover Operator for the Fixed Charge Logistic Model with Priority Bas...
HOPX Crossover Operator for the Fixed Charge Logistic Model with Priority Bas...HOPX Crossover Operator for the Fixed Charge Logistic Model with Priority Bas...
HOPX Crossover Operator for the Fixed Charge Logistic Model with Priority Bas...
 
Linear modeling in Transportation problem: Need of reliable Public transporta...
Linear modeling in Transportation problem: Need of reliable Public transporta...Linear modeling in Transportation problem: Need of reliable Public transporta...
Linear modeling in Transportation problem: Need of reliable Public transporta...
 
G0211056062
G0211056062G0211056062
G0211056062
 
5. working on data using R -Cleaning, filtering ,transformation, Sampling
5. working on data using R -Cleaning, filtering ,transformation, Sampling5. working on data using R -Cleaning, filtering ,transformation, Sampling
5. working on data using R -Cleaning, filtering ,transformation, Sampling
 
An application of fuzzy cognitive mapping in optimization of inventory functi...
An application of fuzzy cognitive mapping in optimization of inventory functi...An application of fuzzy cognitive mapping in optimization of inventory functi...
An application of fuzzy cognitive mapping in optimization of inventory functi...
 
Sgd teaching-consulting-10-jan-2009 (1)
Sgd teaching-consulting-10-jan-2009 (1)Sgd teaching-consulting-10-jan-2009 (1)
Sgd teaching-consulting-10-jan-2009 (1)
 
Optimal Allocation Policy for Fleet Management
Optimal Allocation Policy for Fleet ManagementOptimal Allocation Policy for Fleet Management
Optimal Allocation Policy for Fleet Management
 
A Comparative Study Of Machine Learning Algorithms For Industry-Specific Frei...
A Comparative Study Of Machine Learning Algorithms For Industry-Specific Frei...A Comparative Study Of Machine Learning Algorithms For Industry-Specific Frei...
A Comparative Study Of Machine Learning Algorithms For Industry-Specific Frei...
 
A framework for visualizing association mining results
A framework for visualizing association mining resultsA framework for visualizing association mining results
A framework for visualizing association mining results
 
Ijariie1117 volume 1-issue 1-page-25-27
Ijariie1117 volume 1-issue 1-page-25-27Ijariie1117 volume 1-issue 1-page-25-27
Ijariie1117 volume 1-issue 1-page-25-27
 

Mais de ertekg

Rule-based expert systems for supporting university students
Rule-based expert systems for supporting university studentsRule-based expert systems for supporting university students
Rule-based expert systems for supporting university studentsertekg
 
Optimizing the electric charge station network of EŞARJ
Optimizing the electric charge station network of EŞARJOptimizing the electric charge station network of EŞARJ
Optimizing the electric charge station network of EŞARJertekg
 
Competitiveness of Top 100 U.S. Universities: A Benchmark Study Using Data En...
Competitiveness of Top 100 U.S. Universities: A Benchmark Study Using Data En...Competitiveness of Top 100 U.S. Universities: A Benchmark Study Using Data En...
Competitiveness of Top 100 U.S. Universities: A Benchmark Study Using Data En...ertekg
 
Industrial Benchmarking through Information Visualization and Data Envelopmen...
Industrial Benchmarking through Information Visualization and Data Envelopmen...Industrial Benchmarking through Information Visualization and Data Envelopmen...
Industrial Benchmarking through Information Visualization and Data Envelopmen...ertekg
 
Modelling the supply chain perception gaps
Modelling the supply chain perception gapsModelling the supply chain perception gaps
Modelling the supply chain perception gapsertekg
 
Risk Factors and Identifiers for Alzheimer’s Disease: A Data Mining Analysis
Risk Factors and Identifiers for Alzheimer’s Disease:  A Data Mining AnalysisRisk Factors and Identifiers for Alzheimer’s Disease:  A Data Mining Analysis
Risk Factors and Identifiers for Alzheimer’s Disease: A Data Mining Analysisertekg
 
Text Mining with RapidMiner
Text Mining with RapidMinerText Mining with RapidMiner
Text Mining with RapidMinerertekg
 
Competitive Pattern-Based Strategies under Complexity: The Case of Turkish Ma...
Competitive Pattern-Based Strategies under Complexity: The Case of Turkish Ma...Competitive Pattern-Based Strategies under Complexity: The Case of Turkish Ma...
Competitive Pattern-Based Strategies under Complexity: The Case of Turkish Ma...ertekg
 
Supplier and Buyer Driven Channels in a Two-Stage Supply Chain
Supplier and Buyer Driven Channels in a  Two-Stage Supply ChainSupplier and Buyer Driven Channels in a  Two-Stage Supply Chain
Supplier and Buyer Driven Channels in a Two-Stage Supply Chainertekg
 
Simulation Modeling For Quality And Productivity In Steel Cord Manufacturing
Simulation Modeling For Quality And Productivity In Steel Cord ManufacturingSimulation Modeling For Quality And Productivity In Steel Cord Manufacturing
Simulation Modeling For Quality And Productivity In Steel Cord Manufacturingertekg
 
Visual and analytical mining of transactions data for production planning f...
Visual and analytical mining of transactions data  for production planning  f...Visual and analytical mining of transactions data  for production planning  f...
Visual and analytical mining of transactions data for production planning f...ertekg
 
A Tutorial On Crossdocking
A Tutorial On CrossdockingA Tutorial On Crossdocking
A Tutorial On Crossdockingertekg
 
Application Of Local Search Methods For Solving A Quadratic Assignment Probl...
Application Of Local Search Methods For Solving  A Quadratic Assignment Probl...Application Of Local Search Methods For Solving  A Quadratic Assignment Probl...
Application Of Local Search Methods For Solving A Quadratic Assignment Probl...ertekg
 
Optimizing Waste Collection In An Organized Industrial Region: A Case Study
Optimizing Waste Collection  In An Organized Industrial Region: A Case StudyOptimizing Waste Collection  In An Organized Industrial Region: A Case Study
Optimizing Waste Collection In An Organized Industrial Region: A Case Studyertekg
 
Demonstrating Warehousing Concepts Through Interactive Animations
Demonstrating Warehousing Concepts Through Interactive AnimationsDemonstrating Warehousing Concepts Through Interactive Animations
Demonstrating Warehousing Concepts Through Interactive Animationsertekg
 
A Framework for Visualizing Association Mining Results
A Framework for Visualizing  Association Mining ResultsA Framework for Visualizing  Association Mining Results
A Framework for Visualizing Association Mining Resultsertekg
 
Compiere kurulumu
Compiere kurulumuCompiere kurulumu
Compiere kurulumuertekg
 
Application of the Cutting Stock Problem to a Construction Company: A Case Study
Application of the Cutting Stock Problem to a Construction Company: A Case StudyApplication of the Cutting Stock Problem to a Construction Company: A Case Study
Application of the Cutting Stock Problem to a Construction Company: A Case Studyertekg
 
Visual Mining of Science Citation Data for Benchmarking Scientific and Techno...
Visual Mining of Science Citation Data for Benchmarking Scientific and Techno...Visual Mining of Science Citation Data for Benchmarking Scientific and Techno...
Visual Mining of Science Citation Data for Benchmarking Scientific and Techno...ertekg
 
An Open Source Java Code For Visualizing Supply Chain Problems
An Open Source Java Code For Visualizing Supply Chain ProblemsAn Open Source Java Code For Visualizing Supply Chain Problems
An Open Source Java Code For Visualizing Supply Chain Problemsertekg
 

Mais de ertekg (20)

Rule-based expert systems for supporting university students
Rule-based expert systems for supporting university studentsRule-based expert systems for supporting university students
Rule-based expert systems for supporting university students
 
Optimizing the electric charge station network of EŞARJ
Optimizing the electric charge station network of EŞARJOptimizing the electric charge station network of EŞARJ
Optimizing the electric charge station network of EŞARJ
 
Competitiveness of Top 100 U.S. Universities: A Benchmark Study Using Data En...
Competitiveness of Top 100 U.S. Universities: A Benchmark Study Using Data En...Competitiveness of Top 100 U.S. Universities: A Benchmark Study Using Data En...
Competitiveness of Top 100 U.S. Universities: A Benchmark Study Using Data En...
 
Industrial Benchmarking through Information Visualization and Data Envelopmen...
Industrial Benchmarking through Information Visualization and Data Envelopmen...Industrial Benchmarking through Information Visualization and Data Envelopmen...
Industrial Benchmarking through Information Visualization and Data Envelopmen...
 
Modelling the supply chain perception gaps
Modelling the supply chain perception gapsModelling the supply chain perception gaps
Modelling the supply chain perception gaps
 
Risk Factors and Identifiers for Alzheimer’s Disease: A Data Mining Analysis
Risk Factors and Identifiers for Alzheimer’s Disease:  A Data Mining AnalysisRisk Factors and Identifiers for Alzheimer’s Disease:  A Data Mining Analysis
Risk Factors and Identifiers for Alzheimer’s Disease: A Data Mining Analysis
 
Text Mining with RapidMiner
Text Mining with RapidMinerText Mining with RapidMiner
Text Mining with RapidMiner
 
Competitive Pattern-Based Strategies under Complexity: The Case of Turkish Ma...
Competitive Pattern-Based Strategies under Complexity: The Case of Turkish Ma...Competitive Pattern-Based Strategies under Complexity: The Case of Turkish Ma...
Competitive Pattern-Based Strategies under Complexity: The Case of Turkish Ma...
 
Supplier and Buyer Driven Channels in a Two-Stage Supply Chain
Supplier and Buyer Driven Channels in a  Two-Stage Supply ChainSupplier and Buyer Driven Channels in a  Two-Stage Supply Chain
Supplier and Buyer Driven Channels in a Two-Stage Supply Chain
 
Simulation Modeling For Quality And Productivity In Steel Cord Manufacturing
Simulation Modeling For Quality And Productivity In Steel Cord ManufacturingSimulation Modeling For Quality And Productivity In Steel Cord Manufacturing
Simulation Modeling For Quality And Productivity In Steel Cord Manufacturing
 
Visual and analytical mining of transactions data for production planning f...
Visual and analytical mining of transactions data  for production planning  f...Visual and analytical mining of transactions data  for production planning  f...
Visual and analytical mining of transactions data for production planning f...
 
A Tutorial On Crossdocking
A Tutorial On CrossdockingA Tutorial On Crossdocking
A Tutorial On Crossdocking
 
Application Of Local Search Methods For Solving A Quadratic Assignment Probl...
Application Of Local Search Methods For Solving  A Quadratic Assignment Probl...Application Of Local Search Methods For Solving  A Quadratic Assignment Probl...
Application Of Local Search Methods For Solving A Quadratic Assignment Probl...
 
Optimizing Waste Collection In An Organized Industrial Region: A Case Study
Optimizing Waste Collection  In An Organized Industrial Region: A Case StudyOptimizing Waste Collection  In An Organized Industrial Region: A Case Study
Optimizing Waste Collection In An Organized Industrial Region: A Case Study
 
Demonstrating Warehousing Concepts Through Interactive Animations
Demonstrating Warehousing Concepts Through Interactive AnimationsDemonstrating Warehousing Concepts Through Interactive Animations
Demonstrating Warehousing Concepts Through Interactive Animations
 
A Framework for Visualizing Association Mining Results
A Framework for Visualizing  Association Mining ResultsA Framework for Visualizing  Association Mining Results
A Framework for Visualizing Association Mining Results
 
Compiere kurulumu
Compiere kurulumuCompiere kurulumu
Compiere kurulumu
 
Application of the Cutting Stock Problem to a Construction Company: A Case Study
Application of the Cutting Stock Problem to a Construction Company: A Case StudyApplication of the Cutting Stock Problem to a Construction Company: A Case Study
Application of the Cutting Stock Problem to a Construction Company: A Case Study
 
Visual Mining of Science Citation Data for Benchmarking Scientific and Techno...
Visual Mining of Science Citation Data for Benchmarking Scientific and Techno...Visual Mining of Science Citation Data for Benchmarking Scientific and Techno...
Visual Mining of Science Citation Data for Benchmarking Scientific and Techno...
 
An Open Source Java Code For Visualizing Supply Chain Problems
An Open Source Java Code For Visualizing Supply Chain ProblemsAn Open Source Java Code For Visualizing Supply Chain Problems
An Open Source Java Code For Visualizing Supply Chain Problems
 

Último

Call US-88OO1O2216 Call Girls In Mahipalpur Female Escort Service
Call US-88OO1O2216 Call Girls In Mahipalpur Female Escort ServiceCall US-88OO1O2216 Call Girls In Mahipalpur Female Escort Service
Call US-88OO1O2216 Call Girls In Mahipalpur Female Escort Servicecallgirls2057
 
Youth Involvement in an Innovative Coconut Value Chain by Mwalimu Menza
Youth Involvement in an Innovative Coconut Value Chain by Mwalimu MenzaYouth Involvement in an Innovative Coconut Value Chain by Mwalimu Menza
Youth Involvement in an Innovative Coconut Value Chain by Mwalimu Menzaictsugar
 
Global Scenario On Sustainable and Resilient Coconut Industry by Dr. Jelfina...
Global Scenario On Sustainable  and Resilient Coconut Industry by Dr. Jelfina...Global Scenario On Sustainable  and Resilient Coconut Industry by Dr. Jelfina...
Global Scenario On Sustainable and Resilient Coconut Industry by Dr. Jelfina...ictsugar
 
Financial-Statement-Analysis-of-Coca-cola-Company.pptx
Financial-Statement-Analysis-of-Coca-cola-Company.pptxFinancial-Statement-Analysis-of-Coca-cola-Company.pptx
Financial-Statement-Analysis-of-Coca-cola-Company.pptxsaniyaimamuddin
 
Memorándum de Entendimiento (MoU) entre Codelco y SQM
Memorándum de Entendimiento (MoU) entre Codelco y SQMMemorándum de Entendimiento (MoU) entre Codelco y SQM
Memorándum de Entendimiento (MoU) entre Codelco y SQMVoces Mineras
 
Darshan Hiranandani [News About Next CEO].pdf
Darshan Hiranandani [News About Next CEO].pdfDarshan Hiranandani [News About Next CEO].pdf
Darshan Hiranandani [News About Next CEO].pdfShashank Mehta
 
Market Sizes Sample Report - 2024 Edition
Market Sizes Sample Report - 2024 EditionMarket Sizes Sample Report - 2024 Edition
Market Sizes Sample Report - 2024 EditionMintel Group
 
PSCC - Capability Statement Presentation
PSCC - Capability Statement PresentationPSCC - Capability Statement Presentation
PSCC - Capability Statement PresentationAnamaria Contreras
 
Cybersecurity Awareness Training Presentation v2024.03
Cybersecurity Awareness Training Presentation v2024.03Cybersecurity Awareness Training Presentation v2024.03
Cybersecurity Awareness Training Presentation v2024.03DallasHaselhorst
 
The-Ethical-issues-ghhhhhhhhjof-Byjus.pptx
The-Ethical-issues-ghhhhhhhhjof-Byjus.pptxThe-Ethical-issues-ghhhhhhhhjof-Byjus.pptx
The-Ethical-issues-ghhhhhhhhjof-Byjus.pptxmbikashkanyari
 
Church Building Grants To Assist With New Construction, Additions, And Restor...
Church Building Grants To Assist With New Construction, Additions, And Restor...Church Building Grants To Assist With New Construction, Additions, And Restor...
Church Building Grants To Assist With New Construction, Additions, And Restor...Americas Got Grants
 
Independent Call Girls Andheri Nightlaila 9967584737
Independent Call Girls Andheri Nightlaila 9967584737Independent Call Girls Andheri Nightlaila 9967584737
Independent Call Girls Andheri Nightlaila 9967584737Riya Pathan
 
Buy gmail accounts.pdf Buy Old Gmail Accounts
Buy gmail accounts.pdf Buy Old Gmail AccountsBuy gmail accounts.pdf Buy Old Gmail Accounts
Buy gmail accounts.pdf Buy Old Gmail AccountsBuy Verified Accounts
 
Flow Your Strategy at Flight Levels Day 2024
Flow Your Strategy at Flight Levels Day 2024Flow Your Strategy at Flight Levels Day 2024
Flow Your Strategy at Flight Levels Day 2024Kirill Klimov
 
Organizational Structure Running A Successful Business
Organizational Structure Running A Successful BusinessOrganizational Structure Running A Successful Business
Organizational Structure Running A Successful BusinessSeta Wicaksana
 
8447779800, Low rate Call girls in Rohini Delhi NCR
8447779800, Low rate Call girls in Rohini Delhi NCR8447779800, Low rate Call girls in Rohini Delhi NCR
8447779800, Low rate Call girls in Rohini Delhi NCRashishs7044
 
Call Us 📲8800102216📞 Call Girls In DLF City Gurgaon
Call Us 📲8800102216📞 Call Girls In DLF City GurgaonCall Us 📲8800102216📞 Call Girls In DLF City Gurgaon
Call Us 📲8800102216📞 Call Girls In DLF City Gurgaoncallgirls2057
 

Último (20)

Call US-88OO1O2216 Call Girls In Mahipalpur Female Escort Service
Call US-88OO1O2216 Call Girls In Mahipalpur Female Escort ServiceCall US-88OO1O2216 Call Girls In Mahipalpur Female Escort Service
Call US-88OO1O2216 Call Girls In Mahipalpur Female Escort Service
 
Youth Involvement in an Innovative Coconut Value Chain by Mwalimu Menza
Youth Involvement in an Innovative Coconut Value Chain by Mwalimu MenzaYouth Involvement in an Innovative Coconut Value Chain by Mwalimu Menza
Youth Involvement in an Innovative Coconut Value Chain by Mwalimu Menza
 
Global Scenario On Sustainable and Resilient Coconut Industry by Dr. Jelfina...
Global Scenario On Sustainable  and Resilient Coconut Industry by Dr. Jelfina...Global Scenario On Sustainable  and Resilient Coconut Industry by Dr. Jelfina...
Global Scenario On Sustainable and Resilient Coconut Industry by Dr. Jelfina...
 
Financial-Statement-Analysis-of-Coca-cola-Company.pptx
Financial-Statement-Analysis-of-Coca-cola-Company.pptxFinancial-Statement-Analysis-of-Coca-cola-Company.pptx
Financial-Statement-Analysis-of-Coca-cola-Company.pptx
 
Memorándum de Entendimiento (MoU) entre Codelco y SQM
Memorándum de Entendimiento (MoU) entre Codelco y SQMMemorándum de Entendimiento (MoU) entre Codelco y SQM
Memorándum de Entendimiento (MoU) entre Codelco y SQM
 
Darshan Hiranandani [News About Next CEO].pdf
Darshan Hiranandani [News About Next CEO].pdfDarshan Hiranandani [News About Next CEO].pdf
Darshan Hiranandani [News About Next CEO].pdf
 
Enjoy ➥8448380779▻ Call Girls In Sector 18 Noida Escorts Delhi NCR
Enjoy ➥8448380779▻ Call Girls In Sector 18 Noida Escorts Delhi NCREnjoy ➥8448380779▻ Call Girls In Sector 18 Noida Escorts Delhi NCR
Enjoy ➥8448380779▻ Call Girls In Sector 18 Noida Escorts Delhi NCR
 
Corporate Profile 47Billion Information Technology
Corporate Profile 47Billion Information TechnologyCorporate Profile 47Billion Information Technology
Corporate Profile 47Billion Information Technology
 
Market Sizes Sample Report - 2024 Edition
Market Sizes Sample Report - 2024 EditionMarket Sizes Sample Report - 2024 Edition
Market Sizes Sample Report - 2024 Edition
 
PSCC - Capability Statement Presentation
PSCC - Capability Statement PresentationPSCC - Capability Statement Presentation
PSCC - Capability Statement Presentation
 
Cybersecurity Awareness Training Presentation v2024.03
Cybersecurity Awareness Training Presentation v2024.03Cybersecurity Awareness Training Presentation v2024.03
Cybersecurity Awareness Training Presentation v2024.03
 
The-Ethical-issues-ghhhhhhhhjof-Byjus.pptx
The-Ethical-issues-ghhhhhhhhjof-Byjus.pptxThe-Ethical-issues-ghhhhhhhhjof-Byjus.pptx
The-Ethical-issues-ghhhhhhhhjof-Byjus.pptx
 
Japan IT Week 2024 Brochure by 47Billion (English)
Japan IT Week 2024 Brochure by 47Billion (English)Japan IT Week 2024 Brochure by 47Billion (English)
Japan IT Week 2024 Brochure by 47Billion (English)
 
Church Building Grants To Assist With New Construction, Additions, And Restor...
Church Building Grants To Assist With New Construction, Additions, And Restor...Church Building Grants To Assist With New Construction, Additions, And Restor...
Church Building Grants To Assist With New Construction, Additions, And Restor...
 
Independent Call Girls Andheri Nightlaila 9967584737
Independent Call Girls Andheri Nightlaila 9967584737Independent Call Girls Andheri Nightlaila 9967584737
Independent Call Girls Andheri Nightlaila 9967584737
 
Buy gmail accounts.pdf Buy Old Gmail Accounts
Buy gmail accounts.pdf Buy Old Gmail AccountsBuy gmail accounts.pdf Buy Old Gmail Accounts
Buy gmail accounts.pdf Buy Old Gmail Accounts
 
Flow Your Strategy at Flight Levels Day 2024
Flow Your Strategy at Flight Levels Day 2024Flow Your Strategy at Flight Levels Day 2024
Flow Your Strategy at Flight Levels Day 2024
 
Organizational Structure Running A Successful Business
Organizational Structure Running A Successful BusinessOrganizational Structure Running A Successful Business
Organizational Structure Running A Successful Business
 
8447779800, Low rate Call girls in Rohini Delhi NCR
8447779800, Low rate Call girls in Rohini Delhi NCR8447779800, Low rate Call girls in Rohini Delhi NCR
8447779800, Low rate Call girls in Rohini Delhi NCR
 
Call Us 📲8800102216📞 Call Girls In DLF City Gurgaon
Call Us 📲8800102216📞 Call Girls In DLF City GurgaonCall Us 📲8800102216📞 Call Girls In DLF City Gurgaon
Call Us 📲8800102216📞 Call Girls In DLF City Gurgaon
 

Financial Benchmarking Of Transportation Companies In The New York Stock Exchange (Nyse) Through Data Envelopment Analysis (Dea) And Visualization

  • 1. Ulus, F., Kose, O, Ertek, G. and Sen, S. (2006). "Financial benchmarking of transportation companies in the New York Stock Exchange (NYSE) through data envelopment analysis (DEA) and visualization.” 4th International Logistics and Supply Chain Congress, İzmir, Turkey. Note: This is the final draft version of this paper. Please cite this paper (or this final draft) as above. You can download this final draft from http://research.sabanciuniv.edu. FINANCIAL BENCHMARKING OF TRANSPORTATION COMPANIES IN THE NEW YORK STOCK EXCHANGE (NYSE) THROUGH DATA ENVELOPMENT ANALYSIS (DEA) AND VISUALIZATION Firdevs Ulus1, Özlem Köse2, Gürdal Ertek3, and Simay Şen4 Abstract In this paper, we present a benchmarking study of industrial transportation companies traded in the New York Stock Exchange (NYSE). There are two distinguishing aspects of our study: First, instead of using operational data for the input and the output items of the developed Data Envelopment Analysis (DEA) model, we use financial data of the companies that are readily available on the Internet. Secondly, we visualize the efficiency scores of the companies in relation to the subsectors and the number of employees. These visualizations enable us to discover 1 Sabancı University, Turkey, 2 Sabancı University, Turkey, 3 Sabancı University, Turkey, 4 Sabancı University, Turkey, 4th International Logistics and Supply Chain Management Congress
  • 2. interesting insights about the companies within each subsector, and about subsectors in comparison to each other. The visualization approach that we employ can be used in any DEA study that contains subgroups within a group. Thus, our paper also contains a methodological contribution. Keywords: Financial benchmarking, Data Envelopment Analysis, Data Visualization, Logistics, Transportation, Delivery Services, Railroad Transportation, Marine Transportation, Trucking, New York Stock Exchange 1. Introduction Logistics is often considered as “movement of goods”, a definition which is not totally wrong, but has to degree of limited meaning. In fact, with its growing field of operations, including transportation, planning, warehousing and many more disciplines, logistics has become an indispensable part of the business world especially in recent decades. The statistics covering many sectors point out this fact: 10 to 35% of gross sales of companies are spent on logistics costs (Projects Monitor). Logistics is a component of the value chain which can bring significant competitive advantage to the firm. A well known example of this fact is the great success of Wal-Mart in the retail industry (Stalk, Evans, & Shulman, 1992). Wal-Mart is reported to achieve its phenomenal success thanks to its efficient logistics operations and specifically to its successful implementation of crossdocking. Companies may prefer to carry out the logistics operations within their own structure or may prefer to outsource it to companies that are specialized in logistics, namely “logistics companies”. The main cost component in logistics is typically transportation. So we have decided to focus on the industrial transportation sector, and analyzed industrial transportation companies. Financial benchmarking makes it possible to compare companies in an industry based on their financial statements. Companies can compare their financial statements and managerial strategies with those of their competitors, and can identify suitable strategies to prevail in their industries. Financial benchmarking is a subject which is commonly examined in the academic environment. There are some visualization approaches such as Self Organizing Maps (SOM), and some mathematical methods such as Stochastic Frontier Approach (SFA), Distribution-Free Approach (DFA), Data Envelopment Analysis (DEA), etc. In this paper, we prefer to employ DEA since it has some eligibility among all other methods besides the advantage that it is a nonparametric technique which requires fewer assumptions (Weill, 2004). Furthermore, Weill’s (2004) study proves that DEA is also consistent with standard measures of performance such as DFA and SFA. In addition to its consistency, DEA can reveal the reason for a company being inefficient, and shows how to restore the fund to its optimum of efficiency (Galagedera & Silvapulle, 2002). 4th International Logistics and Supply Chain Management Congress
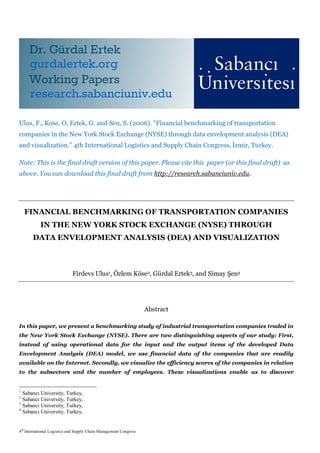
  • 3. In this study, we gathered the financial statements for 2005 of the industrial transportation companies traded in New York Stock Exchange (NYSE), and carried out a benchmarking study among them through DEA. The results of DEA were visualized by Miner3D (Miner3D) in order to detect patterns and derive useful insights. 2. Methodologies 2.1 Data Envelopment Analysis Data Envelopment Analysis (DEA) is an approach which is used to measure efficiency (or productivity) of an activity or entity (named Decision Making Unit, DMU). Measuring total productivity is difficult with multiple inputs and outputs since it requires choosing weights for inputs and outputs. The most useful property of DEA is the fact that it does not make any assumptions to choose these weights: Instead, the weights are directly derived from the data. The “best” weights, which have the most adequate properties to be used for benchmarking of the DMUs, are chosen by the model itself. Thus, these weights are not fixed but they are defined as variables. Since the weights of the inputs and outputs are determined from the data, their units do not need to be congruent. In other words, the units can be of different types (ex: workers, machines, dollars, units). The DMUs which have the highest rank of efficiency levels all together determine the efficient frontier and the other (inefficient) DMUs’ scores are calculated according to this efficient frontier. The efficient DMUs that reside on the efficient frontier and have efficiency equal to 1 are same as or superior than the inefficient DMUs (that have efficiency less than 1) in all productivity dimensions. However, they can not be superior to each other in every dimension, i.e., they are inferior to each other in at least one dimension. Thus, the efficiencies measured in DEA can be alternatively defined as the relative efficiencies. The properties explained above are illustrated in the example below. If there is one input (in this case, number of employees) and two outputs (sales and number of customers); a given data of 7 DMUs can be visualized as in Figure 1. The DMUs B, E, C and F create the efficient frontier and they all are efficient, whereas the DMUs A, D and G form the set of inefficient DMUs. The efficiencies of the DMUs on the frontier are all equal to 1, since they have the perfect efficiency compared to others. The inefficient DMUs’ efficiencies are calculated by taking the efficient frontier into account. For instance, the efficiency of D is |OD| / |OP|. 4th International Logistics and Supply Chain Management Congress
  • 4. Figure 1. One input & two output case of DEA The example above is a very simple one, and it is not possible to figure out the components of the graph such easily when there are multiple inputs and outputs (which is the usual case in real world problems). Thus, a mathematical modelling approach is devised in order to deal with the more complex problems. One of the best known models generated to cope with this difficulty is the CCR Model, developed by Charnes, Cooper & Rhodes (1978). CCR assumes that there is constant-returns-to-scale, which possibly is not the case in a large number of real life problems. There are two variations of the CCR model, one of them is the input-oriented model, and the other one is the output-oriented model. The input-oriented model is given below (Cooper, Seiford, & Tone, 2006), with  denoting efficiency (virtual output/virtual input), X and Y denoting matrices formed composed of sets of xj and yj vectors for the variables, i.e., X=(xj), Y=(yj). ( DLPI o ) min  x0  X  0 Y  yo 0 In this model, the objective is to minimize the input by concurrently keeping the output at least the same. In the output oriented CCR Model below, the objective is to maximize the output level by making use of at most the same amount of input: 4th International Logistics and Supply Chain Management Congress
  • 5. ( DLPOo ) max  x 0  X  0 y 0  Y  0  0 These two variations do not change the DMUs on the efficient frontier, but calculate the projections of the DMUs differently. Another known DEA Model is the BCC Model which is developed by Banker, Charnes, & Cooper (1984). Almost all of the characteristics of the CCR Model also prevail for BCC Model. However, unlike the CCR Model, BCC Model enables the problem to be variable-returns-to-scale. This property is assured through a convexity constraint which makes the production frontier to be spanned by the convex hull of the DMUs. The mathematical model of input- oriented BCC Model (Cooper, Seiford, & Tone, 2006) can be written as: ( BCC o ) max  B  B x 0  X  0 Y  y 0 e  1 0 where X=(xj) is the matrix of input variables and Y=(yj) is the output matrix of variables,  is a column vector and e is the raw vector of 1’s. (See Appendix -Section 7.1- for further mathematical explanation of the models.) In this study, the BCC Model is utilized since it can accommodate variable-returns-to-scale, without the restriction of constant-returns-to-scale. Also, the input-oriented model is found to be more appropriate for this study since it is much easier to set actionable goals for the input values in shorter time periods (Culliane, Song & Wang, 2005). 2.2 Data Visualization Data visualization is a fundamental component of data analysis, and especially helps the analyst with detecting outliers, finding patterns that are not suggested by standard statistical techniques, and coming up with new hypotheses. The book by Chambers et al. (1983) is the classic source of reference for data visualization carried out within the context of statistics. The visualizations (referred to as “graphical methods”) include quantile plots, histograms, box plots, symmetry plots, scatter plots, quantile-quantile plots, etc., and could be generated by the computers of 1980’s. However, these visualizations focused mostly on supporting statistical analysis, could display a very limited number of data points, and did not make effective use of colors. The field of computer science known as information visualization has emerged in the 1990’s and extends the graphical methods of 1980’s to new dimensions. In information visualization, the idea is to detect undiscovered patterns, come up with actionable insights, and generate maximum benefit out of –typically large scale– data. 4th International Logistics and Supply Chain Management Congress
  • 6. Information visualization is built on ideas from data mining, statistics, and computer graphics; and compensates for the shortcomings of graphical methods of 1980’s. Well-known sources on information visualization include books by Spence (2001) and Soukup & Davidson (2002), web sites such as Olive (Olive), IV (IV), and review papers including Keim (2002) and Hoffman & Grinstein (2002). The visualization method that we employ in this paper is the “colored scatter plot” developed in the 1980’s, and is referred to as “starfield display” in the information visualization literature. This visualization method is very simple, yet can enable a great understanding of the visualized data. We carry out our visualizations using the Miner3D software (Miner3D). 3. Related Literature We believe that the work most related to our research is the one by Min and Joo (2006), where the authors carry out a benchmarking study of six third party logistics (3PL) providers using DEA. They use financial data of accounts receivables, salaries & wages, operating expenses and property & equipment as inputs in the model and operating income as the output. Their study spans the years 1999-2002. The authors discovered that the strength of companies’ service performances and the diversity of their 3PL services are correlated to their operational efficiencies. The authors suggest several survival strategies based on their observations from the DEA. DEA has also been employed in studies related with logistics and transportation, for comparing container ports’ efficiencies (Turner, Windle, & Dresner, 2004; Cullinane et al., 2006), estimating productivity of the trucking industry in U.S. states with respect to fatalities (Weber, & Weber, 2004), deriving efficiency scores of urban rail firms (Graham, 2006) and urban transit systems (Boame, 2004), evaluating performances of airlines (Chiou, & Chen, 2006), and measuring operational pruductivity of warehouses (Hackman et al., 2001). Scatter plot visualizations similar to the ones in our paper can be found in Frazelle (2002, pages 61-63), where efficiency scores of warehouses (referred to as “Warehouse Performance Index”) are plotted against warehouse sizes and material handling systems investments. These visualizations provide warehouse and logistics managers with critical insights on strategic warehouse design issues. 4. Analysis and Results 4.1 Data Collection The data for benchmarking is obtained from New York Stock Exchange (NYSE) and company websites: The marine transportation, transportation, trucking, delivery and railroad subsectors of the industrial transportation sector are selected for the study (NYSE Industries). There are 19 marine transportation, 9 transportation, 2 trucking, 3 delivery and 10 railroad companies listed under this sector. The annual reports of these companies for the year 2005 are compiled from their SEC (The Securities and Exchange Commission) filings. A company from marine 4th International Logistics and Supply Chain Management Congress
  • 7. transportation (K-Sea Transportation Partners L.P.) and two companies from transportation (PHH Corporation, Air castle Limited) have no annual reports available on the Internet for the year 2005; so these companies were not considered. Also, Southeast Airport Group was eliminated from the transportation companies list since its business includes mostly transportation of people. As a result, there are a total of 39 industrial transportation companies that were benchmarked in this study and this number provides a very suitable working atmosphere for DEA. Boussofiane et al. (1991) suggest that the number of DMUs to include in DEA should be at least equal to the number of inputs multiplied by the number of outputs. In our study, this translates into at least 9 DMUs during the analysis of each subsector. In compiling the data from the annual reports, the income statements and the balance sheets were used. The total revenue, total operating expenses, net income values were taken from the income statement, and total assets, total liabilities and total shareholders equity data were taken from the balance sheet. All values were taken in millions of US $. The reason for the selection of these values were the facts that it was possible to obtain them for all companies and in their usage as inputs and outputs in DEA can be considered as simpler compared to other potential data. The data that we used in DEA can be downloaded from the internet (Ertek). The inputs and outputs in the DEA analysis were selected as follows:  Inputs: Total operating expenses, Total assets, and Total liabilities  Outputs: Total revenue, Net income, and Total shareholders equity We have not been able to find a standard scheme for the selection of input and outputs in financial benchmarking literature and thus have made the selections in the light of the fact that in DEA achieving more amount/quantity of an output with less amount/quantity of an input is always preferred. 4.2 Visual Analysis By feeding these inputs and outputs to the DEA-Solver software (Cooper, Seiford, & Tone, 2006), the efficiencies of each DMU were determined. According to the results that were achieved, there are 12 transportation companies that were found to be efficient. Efficiency scores of these companies and the inefficient ones are provided in the Appendix - Section 7.2. These efficiency scores were then visualized by the Miner3D software (Miner3D) to search for the possible patterns. The first graph plots the efficiency scores against the subsectors (Figure 2): In Figure 2, the x-axis and also the colors indicate the subsectors under the industrial transportation sector. Blue stands for delivery services (D), dark green stands for marine transportation (M), light green stands for railroad (R), yellow stands for transportation (T) and red stands for trucking (U) companies. 4th International Logistics and Supply Chain Management Congress
  • 8. Figure 2. Efficiency related with the subsectors By examining Figure 2, one can discover the following insights: Seven from among the 18 marine transportation companies are fully efficient, i.e. they all have efficiency scores of 1. These companies are Arlington Tankers Ltd. (ATB), Diana Shipping Inc. (DSX), Ship Finance International Ltd. (SFL), Frontline Ltd. (FRO), General Maritime Corp. (GMR), Seaspan Corp. (SSW) and Overseas Shipholding Group Inc. (OSG). Also, there are four additional companies in this subsector, having a score greater than 0.80 and these are U.S. Shipping Partners L.P. (USS), Double Hull Tankers Inc (DHT), Teekay Shipping Corp. (TK), and Maritrans Inc. (TUG). When these 11 most efficient companies were investigated in detail, it was found out that most of them focus on transportation of oil and petroleum. Among these 11 companies only DSX and SSW are not operating in this subsector of marine transportation. One of these companies, DSX, transports coal, iron ore, grain and dry cargoes. The other one, SSW, provides charter services to container liner companies. It can be said that both of the services that these companies are involved in have the property of being unique among the marine transportation companies in NYSE. Furthermore, in marine transportation subsector there are only two companies having low (less than 0.5) efficiencies. These are Kirby Corp. (KSP) and Horizon Lines Holding Corp. (HRZ). Both 4th International Logistics and Supply Chain Management Congress
  • 9. of them do not serve in the field of petroleum and oil transportation but they focus on different kinds of services. KSP is a barge operator and HRZ is involved in transport of cargo such as building materials, consumer goods, and food to and from the continental US and Alaska, Hawaii, Guam, and Puerto Rico. In the field of transportation services, only one firm, World Fuel Services Corp. (INT), is fully efficient and the rest of them have efficiency scores less than or equal to 0.5. The success of INT can be explained by the fact that it is the only transportation firm that runs its business through integration of both marine and aircraft modes. This company holds more than 10% of the global marine fuels market, and provides 24-hour fueling service to aircraft at 1,500 airports in more than 160 countries. It is possible to state that the considerably higher ranking marine transportation sector in our research channel a significant portion of their financial resources to INT and this may be the explanation behind its success. Meanwhile, we were amused to observe that the value of 0.5 acts much as a border in all the subsectors (except delivery services) that separates the “leaders” and the “laggards” of that subsector. It is not so easy to see a definite pattern in the subsector of railway transportation. The graph gives the impression that almost half of the companies are above the rank of 0.50. Considering the only two companies that have efficiency scores of 1, namely Union Pacific Corp. (UNP) and Canadian National Railway Co. (CNI), it can be possible to discover an interesting insight. UNP is involved in the business of transporting coal, chemicals, industrial products, and other freight by using a system of more than 32,000 route miles in 23 states in two-thirds of the western of US. On the other hand, CNI is recognized as Canadian’s top railroad operator. Both spread their services over a wide network, a characteristic which is not possessed by the other companies in this subsector. A detailed search on these “laggard” companies’ websites revealed that they mostly operate regionally. In the subsectors of delivery and trucking services, it is difficult to see a pattern since there are too few companies. Although it is not statistically appropriate to make generalizations, one can observe that delivery services have much higher efficiencies compared to trucking services for the companies that we considered. The trucking subsector has no companies having a score of 1; all the companies in this subsector have medium ranks of efficiency. The second graphical analysis from the results of the DEA shows the relation between the number of workers and the efficiency scores (Figure 3). 4th International Logistics and Supply Chain Management Congress
  • 10. Figure 3. Efficiency related with the number of employees The first and obvious pattern in Figure 3 is the bimodal distribution of the railroad companies (indicated by the label “R”). There are two major groups: One with small number of employees and low efficiency scores, and other with large number of employees and high efficiency scores. These two groups are clearly separated. Although the companies in each group have no clear patterns, the existence of two disconnected sets can lead one to hypothesize that the railroad companies benefit from economies of scale. When the marine transportation and transportation companies are examined, no clear pattern can be detected. There companies all operate with less than 10,000 workers. It is also not possible to identify a definite pattern about the trucking subsectors by considering the two trucking companies that exist in NYSE. Companies from the delivery subsector were not included in Figure 3. The reason for this was the fact that all of the companies that belong to this industry have employee numbers between 40,000 and 407,000. Those numbers would stand as clear outliers in the graph, and would cause a cluttering of the other companies in the graph. If we sort the delivery companies amongst each other (Appendix – Section 7.2) it can be concluded that FedEx Corp. (FDX) and United Parcel Service Inc. (UPS), which were the largest two delivery companies, have perfect efficiency 4th International Logistics and Supply Chain Management Congress
  • 11. score of 1. Meanwhile, the considerably small TNT N.V. (TP) has significantly lower ranking in DEA results. However, despite all these differences, all delivery companies have efficiency scores greater than 0.75, which leads one to believe that this subsector of industrial transportation is more efficient than the other subsectors. 4.3 Marine Transportation From marine transportation subsector in NYSE, 18 companies were considered. This number is sufficient to carry out an independent analysis for this subsector. Thus we benchmarked these companies and found out a new ranking amongst them. This new analysis gave a better understanding of this subsector’s own boundaries for being efficient and made it possible to see the companies that should be taken as role models by the inefficient companies. The reference sets found by DEA enable us to identify such patterns. When the DEA is done for marine transportation subsector only, the most important change that can be observed is the increase in the number of companies with efficiency score of 1 (Table 1). 4th International Logistics and Supply Chain Management Congress
  • 12. Table 1. DEA results of the marine transportation subsector RANK SYMBOL DMU SCORE 1 ATB Arlington Tankers Ltd. 1 1 DSX Diana Shipping INC. 1 1 FRO Frontline Ltd. 1 1 GMR General Maritime Corp. 1 1 HRZ Horizon Lines Holding Corp. 1 1 OSG Overseas Shipholding Group INC. 1 1 SSW Seaspan Corp. 1 1 SFL Ship Finance International Ltd. 1 1 TK Teekay Shipping Corp. 1 10 USS U.S. Shipping Partners L.P. 0.99 11 DHT Double Hull Tankers Inc. 0.90 12 KSP Kirby Corp. 0.87 13 TUG Maritrans Inc. 0.84 14 NAT Nordic American Tanker Shipping Ltd. 0.70 15 EXM Excell Maritime Carriers Ltd. 0.68 16 OMM Omi Corp. 0.68 17 TNP Tsakos Energy Navigation Ltd. 0.64 18 ISH International Shipholding Corp. 0.55 The independent analysis of the marine transportation subsector enables two companies (HRZ and TK) which did not have perfect efficiencies to reach the ranking of 1. This result is meaningful because in the first analysis the more efficient companies from other subsectors took place in efficient frontier instead of them. One of these two companies, HRZ, became one of the most efficient companies; while in the analysis of whole data it was the worst among the marine transportation subsector. This may seem strange however, it is possible that the efficient frontier 4th International Logistics and Supply Chain Management Congress
  • 13. may differ dramatically for a subset of the DMUs compared to the complete set of DMUs. An example of such a situtation for “one input & two outputs case” is illustrated in the Appendix - Section 7.3. Table 2 involves the reference sets for the companies in the marine transportation subsector, which are not on the efficient frontier. In our DEA for all companies, we did not made a research on reference sets, since the suggested companies involved the companies from different subsectors, which would make the given set inadequate, due to the difficulty of taking the policies of an other business subsector. Consequently, the table above gives only references from the marine transportation sector, which would make the study more clear and meaningful. The weights given on the right side of the reference DMUs sum up to 1 and if the firm is on the efficient frontier its only reference is itself (with the weight of 1). Table 2. Reference sets for the marine transportation companies USS DSX 0.34 SFL 0.66 DHT ATB 0.20 DSX 0.77 SFL 0.03 KSP GMR 0.35 HRZ 0.46 SFL 0.17 TK 0.02 TUG DSX 0.40 SFL 0.60 NAT DSX 0.79 SSW 0.08 SFL 0.13 EXM DSX 0.93 GMR 0.04 SSW 0.03 OMM FRO 0.06 GMR 0.14 OSG 0.08 SFL 0.66 TK 0.06 TNP DSX 0.34 GMR 0.47 SFL 0.19 ISH DSX 0.08 SFL 0.92 4.4 Railroad Transportation In this section we repeat the results of an independent DEA for the railroad transportation subsector, because it is the remaining candidate in the industrial transportation sector which has sufficient data for the study. Again for this subsector, there is an increase in the number of companies which have efficiency scores of 1. BNI, CP, FLA and GWR BNI, CP, FLA and GWR which are found inefficient in Section 4.2, are now found to be efficient in their subsector. The reason for this increase in the number of efficient companies within this subsector is the same as the reason for the marine transportation sector. The reference sets for the railroad transportation are shown in Table 4. 4th International Logistics and Supply Chain Management Congress
  • 14. Table 3. DEA results of the railroad transportation subsector Rank SYMBOL DMU Score 1 BNI Burlington Northern Santa Fe Corp. 1 1 CNI Canadian National Railway Co. 1 1 CP Canadian Pacific Railway Ltd. 1 1 FLA Florida East Coast Industries Inc. 1 1 GWR Genese & Wyoming Inc. 1 1 UNP Union Pacific Corp. 1 7 RRA RailAmerica Inc. 0.94 8 NSC Norfolk Southern Corp. 0.92 9 CSX CSX Corp. 0.91 10 KSU Kansas City Southern 0.79 Table 4. Reference sets for the railroad transportation companies RRA BNI 0.00 CP 0.01 GWR 0.99 NSC BNI 0.20 CNI 0.73 CP 0.03 UNP 0.04 CSX BNI 0.36 CNI 0.30 CP 0.31 UNP 0.02 KSU BNI 0.05 CNI 0.02 CP 0.17 GWR 0.76 5. Conclusions and Future Research We have carried out a financial benchmarking of industrial transportation companies using DEA and visualized the results using Miner3D software. To the best of our knowledge, the colored scatter plots have not been used before to visualize the results of DEA, thus we have made a methodological contribution. Our analysis revealed the characteristics of companies within the subsectors of the industrial transportation sector, and compared the efficiencies of different subsectors with each other. 4th International Logistics and Supply Chain Management Congress
  • 15. There are two important future research areas that can be pursued as a continuation of our work. One is to carry out formal statistical tests to prove or disprove the hypothesis formed by observing the visualizations. The other area is the investigation of what other types of visualizations can be developed or adopted for analyzing the DEA results. 6. References Banker, R. D., Charnes, A., & Cooper, W. W. 1984. Some models for estimating technical and scale inefficiencies in data envelopment analysis. Management Science, vol. 30: 1078–1092. Boame, A. K. 2004. The technical efficiency of Canadian urban transit systems. Transportation Research Part E, vol. 40: 401–416. Chambers, J. M., Cleveland, W. S., Kleiner, B., & Tukey, P. A. 1983. Graphical methods for data analysis. Pacific Grove, CA: Wadsworth & Brooks/Cole Publishing Company. Charnes, A., Cooper, W. W., & Rhodes, E. 1978. Measuring the efficiency of decision making units. European Journal of Operational Research, vol. 2: 429–444. Chiou, Y., & Chen, Y. 2006. Route-based performance evaluation of Taiwanese domestic airlines using data envelopment analysis. Transportation Research Part E, vol. 42: 116–127 Cooper, W. W., Seiford, L. M., & Tone, K. 2006. Introduction to data envelopment analysis and its uses. New York, NY: Springer. Cullinane, K., Wang, T., Song, D., & Ji, P. 2006. The technical efficiency of container ports: Comparing data envelopment analysis and stochastic frontier analysis. Transportation Research Part A, vol. 40: 354–374. Ertek. http://people.sabanciuniv.edu/ertekg/papers/2006/ulus_et_al_ilc2006.xls 4th International Logistics and Supply Chain Management Congress
  • 16. Frazelle, E. H. 2002. World-class warehousing and material handling. McGraw-Hill. Galagedera, D. U. A & Silvapulle, P. 2002. Australian mutual fund performance appraisal using data envelopment analysis. Managerial Finance, 28(9): 60–73. Graham, D. J. 2006. Productivity and efficiency in urban railways: Parametric and non-parametric estimates. Transportation Research Part E. Hackman, S. T., Frazelle, E. H., Griffin, P. M., Griffin, S. O., & Vlasta, D. A. 2001. Benchmarking warehousing and distribution operations: an input-output approach. Journal of Productivity Analysis, vol. 16: 79–100. Hoffman, P. E. & Grinstein, G. G. 2002. A survey of visualizations for high-dimensional data mining. Chapter 2, Information visualization in data mining and knowledge discovery, Eds: Fayyad, U., Grinstein, G. G., & Wierse, A. 47–82 IV. http://iv.homeunix.org Keim, D. A. 2002. Information visualization and visual data mining. IEEE Transactions on Visualization and Computer Graphics, 8(1): 1–8 Min J. & Joo S. J. 2006. Benchmarking the operational efficiency of third party logistics providers using data envelopment analysis. Supply Chain Management: An International Journal, 11(3): 259–265. Miner3D. http://www.miner3d.com NYSE. http://www.nyse.com 4th International Logistics and Supply Chain Management Congress
  • 17. NYSE Industries. http://www.nyse.com/about/listed/industry.shtml?ListedComp=All Olive (On-line Library of Information Visualization Environments). http://otal.umd.edu/Olive/ Projects Monitor. http://www.projectsmonitor.com/detailnews.asp?newsid=6968 Soukup, T., & Davidson, I. 2002. Visual data mining. New York, NY: John Wiley & Sons. Spence, R. 2001. Information visualization. Essex, England: ACM Press. Stalk, G., Evans, P. & Shulman, L. E. 1992. Competing on capabilities: the new rules of corporate strategy. Harvard Business Review, 70(2) Turner, H., Windle R. & Dresner M. 2004. North American containerport productivity: 1984–1997. Transportation Research Part E, vol. 40: 339–356. Weber, M. M., & Weber, W. L. 2004. Productivity and efficiency in the trucking industry. International Journal of Physical Distribution & Logistics Management, 34 (1): 39-61 Weill, L. 2004. Measuring cost efficiency in European banking: a comparison of frontier techniques. Journal of Productivity Analysis, vol. 21: 133–152. 7. Appendix 7.1 Further Explanation for the Models in Section 2.1 4th International Logistics and Supply Chain Management Congress
  • 18. The objective of the CCR model is to maximize the efficiency  (virtual output / virtual input) for each DMU, in order to obtain the values for the input “weights” (vi) and the output “weights” (ur) as variables. Also, the ratio of virtual output to virtual input should not exceed 1 for any DMU. Thus, the fractional model can be written as: s u y i 1 i io ( FPo ) max   m v j 1 j x jo s u y i 1 i ik m  1 k  1,...,n v j 1 j x jk u, v  0 The fractional model can be transformed into the linear model shown below. s ( LPo ) max    u i yio i 1 m v x j 1 j jo 1 s m u y i 1 i ik   v j x jk k  1,...,n j 1 u, v  0 Finally, when the dual of the linear model is taken according to the variables shown in Table 6, the input oriented CCR Model (DLPI0) is obtained as written in Section 2.1. Table 6. The dual variables of CCR Model Multiplier form Envelopment form Envelopment form Multiplier form Constraint (LP0) Variable (DLP0) Constraint (LP0) Variable (DLP0) Vx0=1  x0-X ≥ 0 v≥0 -vX+uY ≤ 0 ≥0 Y ≥ y0 u≥0 4th International Logistics and Supply Chain Management Congress
  • 19. The output oriented CCR Model is obtained similarly. Instead of maximizing the efficiency, the objective of the fractional model minimizes the inverse of efficiency (1/ = virtual input / virtual output =). While taking the dual for the linear model which is obtained from the fractional one;  stands for the dual variable of the second constraint. By following these steps one can easily find the output oriented CCR Model given before. The BCC Model presented in the body text is obtained by a very similar way of obtaining the input oriented CCR Model. The only difference is the convexity constraint (e = 1) which allows the variable returns to scale. 4th International Logistics and Supply Chain Management Congress
  • 20. 7.2 Results of BCC input-oriented DEA for all industrial transportation companies in NYSE Table 5. Results of BCC input-oriented DEA Rank DMU Symbol Industry Efficiency 1 World Fuel Services Corp. INT Transportation 1.00 1 FedEx Corp. FDX Delivery 1.00 1 Union Pacific Corp. UNP Railroad 1.00 1 United Parcel Service Inc. UPS Delivery 1.00 1 Arlington Tankers Ltd. ATB Marine 1.00 1 Diana Shipping Inc. DSX Marine 1.00 1 Canadian National Railway Corp. CNI Railroad 1.00 1 Ship Finance International Ltd. SFL Marine 1.00 1 Frontline Ltd. FRO Marine 1.00 1 General Maritime Corp. GMR Marine 1.00 1 Seaspan Corp. SSW Marine 1.00 1 Overseas Shipholding Group Inc. OSG Marine 1.00 13 U.S. Shipping Partners L.P. USS Marine 0.99 14 Burlington Northern Santa Fe Corp. BNI Railroad 0.90 15 Double Hull Tankers Inc. DHT Marine 0.89 16 Teekay Shipping Corp. TK Marine 0.89 17 Canadian Pacific Railway Ltd. CP Railroad 0.87 18 Norfolk Southern Corp. NSC Railroad 0.86 4th International Logistics and Supply Chain Management Congress
  • 21. 19 Maritrans Inc. TUG Marine 0.84 20 TNT N.V. TP Delivery 0.77 21 CSX Corp. CSX Railroad 0.77 22 Knight Transportation Inc. KNX Trucking 0.70 23 Nordic American Tanker Shipping Ltd. NAT Marine 0.69 24 Excell Maritime Carriers Ltd. EXM Marine 0.65 25 Tsakos Energy Navigation Ltd. TNP Marine 0.64 26 Omi Corp. OMM Marine 0.60 27 Con-Way Inc. CNW Trucking 0.55 28 International Shipholding Corp. ISH Marine 0.55 29 Kansas City Southern KSU Railroad 0.50 30 Ryder System Inc. R Transportation 0.50 31 Grupo TMM SA TMM Transportation 0.48 32 Macquarie Infrastructure CO Trust MIC Transportation 0.45 33 Kirby Corp. KSP Marine 0.35 34 Florida East Coast Industries Inc. FLA Railroad 0.33 35 Horizon Lines Holding Corp. HRZ Marine 0.32 36 TAL International Group TAL Transportation 0.31 37 Genese & Wyoming Inc. GWR Railroad 0.28 38 RailAmerica Inc. RRA Railroad 0.24 39 Interpool Inc. IPX Transportation 0.17 4th International Logistics and Supply Chain Management Congress
  • 22. 7.3 Example for a dramatic change in efficient frontier The example of a dramatic change in efficient frontier can be shown on the graph of the “one input & two output case” example from section 2.1. If F and G are removed from the DEA analysis, the efficient frontier moves to its new position shown by the red line in Figure 4 and the efficiency of D (which used to be less than 1) now becomes 1. Figure 4. The change in efficient frontier when DMUs F and G are removed. 4th International Logistics and Supply Chain Management Congress