SlideShare uma empresa Scribd logo
1 de 12
Baixar para ler offline
SPE 124578

Estimation of Static Bottom Hole Pressure From Well-Head Shut-in Pressure
for a Supercritical Fluid in a Depleted HP/HT Reservoir
Peyman R. Nurafza,* SPE, and Jeremie Fernagu, SPE, Total E&P UK Ltd.


Copyright 2009, Society of Petroleum Engineers

This paper was prepared for presentation at the 2009 SPE Offshore Europe Oil & Gas Conference & Exhibition held in Aberdeen, UK, 8–11 September 2009.

This paper was selected for presentation by an SPE program committee following review of information contained in an abstract submitted by the author(s). Contents of the paper have not been
reviewed by the Society of Petroleum Engineers and are subject to correction by the author(s). The material does not necessarily reflect any position of the Society of Petroleum Engineers, its
officers, or members. Electronic reproduction, distribution, or storage of any part of this paper without the written consent of the Society of Petroleum Engineers is prohibited. Permission to
reproduce in print is restricted to an abstract of not more than 300 words; illustrations may not be copied. The abstract must contain conspicuous acknowledgment of SPE copyright.


Abstract
A periodic measurement of static bottom-hole pressure to monitor the reservoir depletion is an essential reservoir management
practice. In an HP/HT offshore environment, the unavailability of qualified permanent down-hole monitoring technologies and
the risks and costs of occasional operations make gradient surveys very difficult to acquire on a routine basis.

On Elgin-Franklin (HP/HT gas condensate fields, North Sea, UKCS), the typical approach is to use an average fluid density to
estimate the static bottom-hole pressure from the well-head shut-in pressure. This estimation is valid as long as there is only
one phase present inside the well-bore. As soon as the pressure drops below dew point in the tubing, the vertical phase
distribution changes and the bottom-hole pressure can not be accurately estimated using one single average density. Fluid
segregation mechanisms involve complex thermo-convective phenomenon, in association to gravity, which are strongly related
to the temperature gradient in the well bore.

Segregated phase distribution has been observed on some available static pressure gradient surveys, where three gradients
were identified. They correspond to three different phases, i.e. gas at the top, condensate in the middle and supercritical gas at
the bottom of the well. This phenomenon of having a low density fluid below a higher density fluid was referred to as
"gradient reversals" (Bender and Holden, 1984). At that time, it was assumed to be only due to the increasing temperature with
increasing depth, but not explicitly related to the thermo-dynamical behaviour of the critical fluid.

In this case, we show that the fluid densities numerically estimated from each phase composition, at the corresponding
pressure and temperature in the tubing, are comparable to the densities derived from the measured gradients. Based on this, a
robust correlation methodology has been developed to derive the static bottom-hole pressure from the well-head shut-in
pressure using thermodynamic modeling.

Introduction
Elgin and Franklin are deep HP/HT gas condensate fields situated in the Central Graben of the North Sea. Main reservoir is
Upper-Jurassic Fulmar sand buried at more than 5000 meters depth and containing a rich fluid in supercritical conditions
(1100 bars and 190 degC). The fields have been on-stream since 2001. After eight years of production, the reservoir pressure
has declined by approximately 700 bars.

HP/HT reservoirs have posed new challenges for field developments and new challenges appear as these fields mature. One of
these challenges is dropping below dew point which will impact well performance, field production, measurement limitations
and future developments.

In terms of well performance, the main related issues are condensate loading in the well and consequently cyclic degradation
of well performance, and condensate banking near the well-bore inside the reservoir causing production degradation,
compositional changes and GOR increase. The change of the fluid composition and the difficulty to sample regularly introduce
inaccuracies in surface measurements, well allocations, and eventually in proper evaluation of further development options.


*
    Currently with E.ON Ruhrgas UK North Sea Ltd.
2                                                                                                                                        SPE 124578


Periodic measurement of static bottom-hole pressure to monitor the reservoir depletion is an essential reservoir engineering
tool to understand, model and history match the reservoir behaviour, further predict future reservoir behaviour and tackle the
forthcoming challenges in well and reservoir performance. In HP/HT offshore wells not equipped with permanent down-hole
gauges, initially not qualified for HPHT conditions, and the limitations in undertaking down-hole surveys, another serious
concern is the true estimation of the static reservoir pressure.

A classic alternative approach consists of using an average fluid density to estimate the static bottom-hole pressure from the
well-head shut-in pressure (appendix A). This estimation is acceptable as long as there is only one phase present inside the
well-bore. As soon as the pressure drops below dew point in the tubing, the vertical phase distribution changes and the bottom-
hole pressure can not be accurately estimated using one single average density. Another methodology is therefore required to
estimate the pressure gradient in the well with respect to the fluids, and consequently calculate the static bottom-hole pressure
at well datum.

Recent static pressure gradient surveys in Elgin-Franklin wells have shown a segregated phase distribution, where three
gradients were identified. These gradients correspond to three different phases, i.e. gas on the top, condensate in the middle
and supercritical gas at the bottom of the well. In this case, we show that the fluid densities numerically estimated from each
phase composition, at the corresponding pressure and temperature in the tubing, are comparable to the densities derived from
the measured gradients. Based on this, a robust correlation methodology has been developed to derive the static bottom-hole
pressure from the well-head shut-in pressure using thermodynamic modeling.

In this paper, surveys carried out on the Elgin-Franklin wells, the interpretation of these data, and a methodology to calculate
the BHP from the WHP, will be presented and discussed.

Literature Review
Gradients of pressure in tubing and reservoir, and the methods used have been largely discussed in literature (such as Podio,
et.al, 1984; McCoy, et. al., 1997; Fair, et. al., 2002; Waldman, et. al., 2002). The earlier analyses (Rzasa and Katz, 1945) rely
on the use of either average value or trial and error solution for temperature and fluid properties in order to estimate the BHP
from the WHP. This can be done as long as conditions in the tubing are reasonable and the fluid remains monophasic.

                  400


                  350


                  300
                            0.0
                                  0.1 0.2
                  250                       0.3
                                                  0.4
       P (bars)


                                                        0.5
                  200
                                                                0.6


                  150                                                   0.7
                                                                                      0.8
                                                                                                        0.9                        1.0
                  100


                   50


                   0
                        0                     50                  100           150           200             250            300   350    400
                                                                                            T (degC)
                                                              Figure 1: A typical phase envelope for Elgin/Franklin fluids

With wells becoming deeper, it became obvious that temperature and properties of the fluid would have to be better described
to explain some phenomena, Reversal gradients, i.e. gradients of pressure that decrease with increasing depth, are frequently
observed in gas wells. As they imply a heavier fluid above a lighter one, it can appear non-physical and therefore cast doubt on
surveys that are already known to be prone to uncertainty due to the depth location, the accuracy and reliability of the gauges,
the time of stabilization, the effect of temperature, etc. Bender and Holden (1984) observed that reversal gradient can be
SPE 124578                                                                                                                    3


explained by the existence of a geothermal gradient. With the development of more complex fields and the progress made in
the analysis and the modeling of fluids, reversal gradients and others complex pressure gradients have been attributed to the
fluid itself.

Studies of the evolution of the fluid with depth are now common, but models and studies remain mainly focus on reservoir
condition, where property of compositional gradient associated to pressure gradient provide precious information about the
mechanisms occurring in the reservoir (Cañas, et. al. 2008). The conditions along the tubing stretch over a wider range than
what is usually seen in reservoirs. Reservoir modeling efforts help to understand the tubing phenomena when the well is shut-
in.

PVT Summary
Several reservoirs are exploited in the Elgin-Franklin area. Several fluid regions have been identified although the fluids
remain relatively similar. They can be defined as condensate gases with a total GLR ranging between 700-1800 m3/m3. At
initial reservoir conditions (of around 1100bar and 190degC) the fluids have densities from 430 to 530 kg/m3. With saturation
pressures from 240 to 380 bar, the fluids are supercritical at initial conditions. A phase envelope for one of the fluids is
presented in Figure 1.

The thermodynamic modeling used in this study was performed using an in-house numerical tool, based on the Peng-Robinson
equation of state. The fluids are described with a composition using 17 components. Three pseudo-components are used to
model the properties of the heavier components and adjusted in order to match the usual experimental data obtained on the
fluids. These properties are basically the molar mass, the critical pressure, the critical temperature, the acentric factor, the
interaction coefficients and the volume shift. When possible, the volume shift has been described as dependant of the
temperature for a better description of the fluid in the wide range of temperature reached in the tubing.

Field Observations
The number of down-hole surveys performed in the Elgin/Franklin is very limited. First of all, due to the high pressures and
temperatures, it has not been possible to install permanent down-hole gauges in the wells to monitor the bottom-hole pressure.
Furthermore, the huge depletion of around 700 bars applied to the reservoir has caused liner/casing deformation in most of the
wells. These deformations either restrict access to the bottom hole or increase the risk of leaving equipment down-hole, which
might impact well performance, or even cause shut-in of the well for the fishing operations. In addition operational and People
on Board limitations have made it difficult to justify and perform all the surveys recommended in the annual monitoring plan.
However, when the opportunity arises to carry out a well operation, at least a static gradient survey has been performed.


                                                                  Wellhead Shut-in Pressure
                                                                  Estimated Bottom-hole Shut-in Pressure
                                                                  Measured Bottom-hole Shut-in Pressure
       Pressure (Bara)


                                                                Date
      Figure 2: Estimated bottom-hole shut-in pressure from the wellhead using an average density versus measured pressure
4                                                                                                                                       SPE 124578


                     1000


                        0


                     -1000
    Depth (mTVDSS)


                     -2000
                                          Trend 1
                     -3000                Trend 2
                                          Trend 3
                                          Psat
                     -4000                Trend 1
                                          Trend 2
                     -5000                Trend 3
                                          Psat Trend

                     -6000
                             200    220          240         260             280        300        320      340        360        380        400
                                                                                   Pressure (Bars)
                                          Figure 3: Static and saturation pressure versus depth, with the three gradients


In the absence of a down-hole survey, a typical practice is to estimate the static reservoir pressure from the well-head shut-in
pressure with a single fluid density along the well (appendix A). The methodology and the results are normally adjusted and
updated whenever a static gradient survey is performed. However, the difference between the measured static pressure at the
bottom hole and the estimated pressure using this methodology has constantly increased over the past three years, to reach
40bars in most of the wells (Figure 2).

Review of recent static gradient surveys was performed to identify the reason behind the increasing error. It was found that the
later static pressure gradient surveys recorded in some of the wells showed a segregated phase distribution, with three
gradients identified, whereas the earlier surveys of the same well gave a single gradient.


                                                                                   Gradient   Density
                                                                   Trend                             3
                                                                                    m/bars    Kg/m
                                                                   Trend 1           -42       240
                                                                   Trend 2           -22       470
                                                                   Trend 3           -28       370
                                   Table 1: Estimated static pressure gradients and equivalent density for the well in Figure 3


The pressure recorded at different stations during the static gradient surveys is plotted against the gauge depth in mTVDSS. As
shown in Figure 3, the gradient survey exhibits three clear gradient trends, representing three different fluid regimes at
different density, a very light column on the top of the well (Trend 1), a heavy column in the middle (Trend 2) and a lighter
column at the bottom (Trend 3). The last trend is assumed to be constant down to datum depth.
SPE 124578                                                                                                                                       5


                       450

                                                                                                                         Trend 1
                       400
                                                                                                                         Trend 2
                                                                                 -5000mTVDSS
                                                                                                                         Trend 3
                       350                                                       -4000mTVDSS                             Phase Diagram
                                                                                                                         Critical Point
                       300        0.52                                           -3000mTVDSS
     Pressure (Bars)


                                                                                 -2000mTVDSS
                       250
                                                                                 -1000mTVDSS
                                         0.6

                       200                                                             0mTVDSS


                       150                     0.7

                                                              0.8
                       100
                                                                                       0.9
                                                                                                                                    1.0
                       50


                        0
                             50                      100            150          200               250             300               350   400
                                                                             Temprature (DegC)
                                     Figure 4: Dry fluid phase diagram and recorded pressure and temperature at different stations

The pressure gradient trends and their equivalent values in density terms are summarized in Table 1. As expected trend 1 (top
of the well) has a lower gradient and therefore lower density than trend 2 (middle of the well). In other words, a lighter fluid is
on top of a heavier fluid. However, the bottom trend (Trend 3) has a lower density than the middle trend (Trend 2), which
means that a lighter fluid is situated below a heavier fluid.

                                                           Depth           P            T        Vap. Rho   Liq. Rho
                                                           mTVDSS         bars     degC           kg/m3      kg/m3
                                                             31           210          10          313        611
                                                            -194          215          106         202        573
                                                            -444          221          124         203        562
                                                            -693          227          124         209        559
                                                            -940          232          124         215        555
                                                            -1183         238          126         221        551
                                                            -1420         243          130         226        545
                                                            -1653         249          136         231        538
                                                            -1884         255          141         237        531
                                                            -2121         261          146         244        524
                                                            -2362         273          150         258        513
                                                            -2608         285          153         273        502
                                                            -2857         297          158         289        489
                                                            -3107         308          161         307        477
                                                            -3357         319          164         325        464
                                                            -3607         329          166         346        449
                                                            -3857         338          169         361         -
                                                            -4107         347          172         362         -
                                                            -4357         356          175         363         -
                                                            -4607         365          178         365         -
                                                            -4857         373          181         366         -
                                                            -5107         382          183         367         -
                                                   -5307       391         186        368            -
                       Table 2: Gradient survey pressure and temperature and corresponding densities calculated using dry composition
6                                                                                                                       SPE 124578


To explain these gradients, the saturation pressure and the density of the fluid have been modeled using the reservoir fluid’s
dry composition, at each pressure and temperature recorded during the survey. The saturation pressures are shown in Figure 3.
Near -4000mTVDSS, the pressure drops below the dew point. This is very close to the point where the two different gradient
trends (trends 2 and 3) cross each other. This phase change is also shown in the phase diagram for the dry fluid composition in
Figure 4, where the measured pressure and temperatures from the static gradient survey are plotted on top of that, with given
depth ranges, and classified with their respective trends. Therefore the bottom trend belongs to the fluid at supercritical
condition, and near -4000mTVDSS, the pressure and temperature drop below the dew point, passing the 100% vapour phase
line in Figure 4 and entering the two-phase zone of the diagram. This is the point where the fluid in the well suddenly starts to
drop liquid. Furthermore to be able to explain the observed gradient change at the top of the well, the densities of both
available vapour and/or liquid phases are calculated and shown in the Table 2.

                           0


                        -1000


                        -2000
       Depth (mTVDSS)


                        -3000


                                    Trend 1
                        -4000       Trend 2
                                    Trend 3
                                    All
                        -5000       Trend 1 Gradient
                                    Trend 2 Gradient
                                    Trend 3 Gradient

                        -6000
                                0    100          200           300              400            500      600            700
                                                                 Density (Kg/m3)
    Figure 5: Calculated densities from using in-house PVT tool, with densities estimated from the pressure gradients vs. depth

The observed gradients in Table 1, are comparable to the calculated down-hole densities at the same depths, from the dry fluid
composition (Table 2) shown in the Figure 5. The calculated densities from the PVT package have been averaged on the three
ranges of depth, for each trend, as shown in the Table 3. The slight difference observed is due to the dry composition used for
the fluid, when the real fluid is wet and has a higher density (as seen in the measured gradients in Table 1).

                                                               Average Down-Hole Density
                                                       Trend
                                                                          kg/m3
                                                    Trend 1                230
                                                    Trend 2                488
                                                    Trend 3                 365
                                              Table 3: Average calculated down-hole densities

The 3rd trend, at the bottom of the well, clearly shows a supercritical gas, where the 2nd trend and 1st trend correspond
respectively to the liquid and the gas phases. This can be explained using the phase diagram shown in Figure 4. The pressure
and temperature increase with depth. It can be assumed that while rising to surface, at some point the fluid pressure drops
below the dew point and that the liquid drop-out will steadily increase. Thus the liquid will form a film around the tubing that
will start to flow downwards. This strips off the fluid at the top of its heavier components and leaves the lighter gas phase as
the main phase in the fluid column. It is likely that as the liquid film moves downward into higher pressure and temperature
domains it will vaporize again. This thermo-convective phenomenon continues further, until a preliminary equilibrium is
reached, where the liquid becomes the dominant phase in the middle part of the well. Deeper in the well, as saturation point is
reached, the liquid phase can fully vaporize into supercritical fluid, until the whole system reaches a preliminary equilibrium.
The well inclination also plays a role in this equilibration.
SPE 124578                                                                                                                                                                                                 7


                                700


                                600                                                                                                                            Phase Diagram

                                                           Liquid Phase                                               Supercritical Vapor                      Critical Point
                                500                                                                                                                            1st survey
                                                                                                                                                               2nd Survey After 4 Years
              Pressure (bars)


                                400


                                300
                                          0.0
                                                0.1 0.2
                                                          0.3
                                                                 0.4                                                                                                              Vapor Phase
                                                                       0.5
                                200
                                                                              0.6
                                                                                                0.7
                                                                                                                0.8                                                                    1.0
                                                                                                                                                 0.9
                                100                              Liquid & Vapor


                                  0
                                      0                     50                      100                150                     200                     250            300               350         400
                                                              Temperature (degC)
                                                           st                       nd
  Figure 6: Pressure and temperature recorded during the 1 gradient survey and the 2 survey 4 years later, with the corresponding
                                                       fluid’s phase diagram

This phenomenon has been recently observed in the Elgin-Franklin area. During past surveys, down-hole pressures were well
above the critical pressure. At this time, the wells mainly showed a constant pressure gradient with supercritical gas at the
bottom and the liquid at the top of the well. As these two fluids have similar densities, a nearly constant gradient was observed
across the well (Figure 6, 1st survey). In this earlier survey, both wellhead and bottom-hole pressures were higher than the fluid
saturation pressure. Therefore a single phase fluid was observed along the well, supercritical gas and then liquid where the
temperature drops below the critical point. This change is very gradual, and no major density and accordingly gradient change
can be noticed. At the time of a second survey, performed 4 years afterwards, the reservoir was depleted by 300 bars with a
fluid no longer monophasic along the whole tubing (Figure 6, 2nd survey).. This will lead to further fluid segregation, with
liquid and vapour on the top section of the well and supercritical gas in the bottom section of the well.

                    0                                                                                                                   0

                                          Gradient = 23 m/bar = 440Kg/m3                              Trend 1
            -1000                                                                                     Trend 2                        -1000
                                                                                                      Trend 2
                                                                                                      Trend 1
            -2000                                                                                                                    -2000
Depth (m)


                                                                                                                                                         Trend 1
                                                                                                                         Depth (m)


            -3000                                                                                                                                        Trend 2
                                                                                                                                     -3000
                                                                                                                                                         Trend 1 Gradient
                                                                                                                                                         Trend 2 Gradient
            -4000                                                                                                                    -4000

                                                 Gradient = 23 m/bar = 440Kg/m3

            -5000                                                                                                                    -5000


            -6000                                                                                                                    -6000
                            400           450             500           550               600         650         700                        0         100     200          300        400    500    600
                                                                 Pressure (Bars)                                                                                     Density (Kg/m3)
                                        (a)                                                               (b)
                                                                                                                                  st
             Figure 7: Pressure gradient (a) and calculated densities compared with the gradient equivalent densities (b) of the 1 survey
8                                                                                                                                                              SPE 124578


The pressure gradients of both surveys appear quite similar, as shown in Figure 7a and the same modeling procedure was
applied with the second survey data. The fluid density was calculated for the pressures and temperatures recorded at each
station, then compared to the density corresponding to the observed pressure gradient, as shown in Figure 7b. This shows that
there is no major gradient and density change when moving up from the supercritical gas at the bottom of the well to the liquid
on top of the well. This point is coherent with the thermodynamic theory of supercritical fluid (McCain 1990; Firoozabadi
1999), where far above the phase envelope, the limit between liquid and gas is very progressive with little changes in
properties.

                                          Pressure                                             Pressure                               Pressure

                                                                                     Gas
                                                                                   Gradient                                           Gas


                                                                                                                                                 Dew Point
                                                            Estimated Single                                                        Gradient
                                                            Density Gradient
                                        Dew Point


                                                                                      Condensate
                                                                                       Gradient


                                                                                                  Dew Point
    Well Depth


                                                     Actual Fluid                                                         Condensate
                                                      Gradient                                                             Gradient

                                                                                  Supercritical Fluid Gradient                  Supercritical Fluid
                    Well Datum                                                                                                      Gradient

                                                                     Estimation
                                                                       Error


                                                    (a)                                                       (b)                          (c)

      Figure 8: Comparison of the single average density approach for estimating bottom-hole shut-in pressure from wellhead, with the
               actual fluids in the well, (a) above the dew point (b) and (c) at two different times after drop below the dew point

Correlation Methodology
Based on the understanding gained from the field observations, it was attempted to develop a correlation methodology to
estimate bottom hole shut-in pressure from the recorded well head shut-in pressure, for all the wells at this important stage of
depletion. This methodology differs from previous single average density approaches (appendix A), by introducing the fluid
phase distribution along the well, with its corresponding density to estimate more accurately the bottom-hole pressure.

                                   0


                                -1000


                                -2000
                    Depth (m)


                                -3000


                                                                1st Survey
                                -4000
                                                                2nd Survey After 4 Years


                                -5000


                                -6000
                                        0                       50                  100                             150   200                                250
                                                                   Shut-in Temperature (DegC)
                 Figure 9: Well temperature profiles at shut-in condition for two surveys performed on the same well at 4 years time lapse
SPE 124578                                                                                                                            9


The use of a single density value to convert THP to BHP is reliable as long as the pressure along the well is above the
saturation pressure of the fluid, and therefore represents a single phase with a single average density. However, as soon as the
pressure drops below dew point, the error of using a single average density to estimate bottom hole pressure, increases (as
shown in Figure 8).

The proposed methodology relies on an iterative method to estimate the pressure at bottom-hole, based on the well fluid
model. In addition to the recorded well-head shut-in pressure, and the composition of the fluid (defined during PVT analysis),
the, temperature profile is required to calculate the densities along the well and consequently estimate the bottom hole
pressure. A review of a series of down-hole surveys in the Elgin/Franklin area showed that with time, the temperature profile
along a well at shut-in conditions remains almost constant assuming a similar shut-in period before performing the surveys.
Figure 9 shows two different surveys carried out on the same well with a 4 years time lapse, after a similar length of well shut-
in time. The temperature difference between the two surveys is negligible.


                         0


                      -1000


                      -2000
          Depth (m)


                      -3000


                                               Immediately After Shut-in
                      -4000
                                               6 hours After Shut-in


                      -5000


                      -6000
                              0      20        40        60        80        100       120       140        160       180       200
                                                                Shut-in Temperature (DegC)
                         Figure 10: Well temperature profile at shut-in condition for two successive surveys in one operation

However, the lapse of time between shut-in and the record temperature survey is a key parameter. Figure 10, shows two
surveys performed on the same well: just after shut-in and 6 hours later. More than 20degC difference can be observed,
especially at the top of the well, where the difference between the temperature of the flowing fluid and the environment around
the well is larger. As long as surveys are recorded well after the well was shut-in, it can be assumed that they will show a
similar temperature trend. This will be different for wells with different fluids, and depends on the stabilization time.

The proposed conversion methodology is based on the calculation of the fluid density of each phase after a simple flash, using
any PVT package. These densities are used to calculate the pressure at the next stage. New densities are then calculated using
this pressure and the temperature either measured or interpolated from the temperature profile. An iterative calculation is then
performed to determine contacts and correct the densities.

We assume in the methodology presented below that the fluid is below dew point in the tubing (therefore at least two phases
are present in the tubing with gas on the top, liquid deeper and potentially supercritical gas in front of perforation).

The first part of the methodology aims to determine the depth of the gas/liquid contact and the pressure at this point. Based on
observed results on the Elgin-Franklin fields, the contact can be found just above the depth where the calculated density for the
liquid phase drops below 515 kg/m3. It should be noted that this value is valid for the Elgin/Franklin fields, but will vary
depending on the type of fluid. During this first part of the methodology, for each stage, the pressure is calculated by iteration,
first using the density of the gas phase at the previous stage then using an average of the densities of the gas phase at the
previous and at the current stage. The density of the liquid is calculated to determine when the contact is reached. The
temperature profile from previous survey provides the temperature at each stage. The well head, where conditions are known,
10                                                                                                                       SPE 124578


is used as the initial stage. The operation is repeated until the contact is reached, and for this stage the iteration is done using,
first the density of the vapour phase at the previous stage, then using a density averaged between the vapour phase at the
previous stage and the liquid phase at the current stage.

The second part of the methodology considers the liquid part of the fluid column and aims to determine the dew point depth or
the pressure at reservoir depth if the depletion is such that no supercritical phase can be found in the well. The gas/liquid
contact, where conditions are known from the first part of the procedure, is used as initial stage for this second part. During a
first iteration the pressure at one stage is calculated using the density of the liquid phase at the previous stage. The temperature
is still interpolated from the temperature profile. The pressure is calculated down to the bottom of the liquid column, dew point
depth or reservoir depth. Once again field observations show that the fluid density just above the down limit of the liquid
region should be used to compute the whole liquid phase pressure profile (Figure 5). The process is repeated using the density
of liquid just above the bottom of the liquid column as an average density for the whole liquid column. A new depth for the
dew point, or a new reservoir pressure, is found and the whole loop is repeated until convergence is reached.

The third part of the methodology considers the supercritical part of the fluid column and aims to determine the pressure at
reservoir depth. It is assumed that a third trend corresponding to supercritical fluid is present in the well and therefore that the
reservoir depth has not been reached in the second part of the methodology. In this supercritical region there is no major
difference between the measured gradient and the estimated densities. Therefore the density is initiated using the average of
the density of fluid at the top of the supercritical region and the density of the vapour phase just above dew point depth, in
order to estimate the pressure evolution in the lowest part of the well.

If the dew point is reached in the tubing, and therefore if supercritical fluid is present in the tubing, the pressure at datum depth
is known at the end of the third part of the methodology. If the dew point is reached in the reservoir, and therefore if there is no
supercritical phase in the tubing, the third part of the methodology is not necessary. However, as liquid drops out in the
reservoir, the composition of the fluid in the tubing is no more the initial one. A new series of iteration is to be performed,
using new compositions which are calculated using PVT experiments, namely the Constant Volume Depletion experiment, and
the pressure calculated at the previous step.

Results and Discussions
Two sets of correlations are shown in Figure 11 for one of the wells in the Elgin/Franklin fields. One of them is based on few
steps when the second one uses more points. The results are compared with the actual measured data. As it can be seen, the
results are within an acceptable range of around +/- 5 bars (less than 2% error). The pressure estimated using a single density
approach is also shown and results in an error of more than 40 bars (i.e. more than 10% error).

                         0


                      -1000
     Depth (mTVDSS)


                      -2000


                      -3000

                                    Correlation (Less Points)
                      -4000         Correlation (More points)
                                    Measured
                      -5000         Single Density


                      -6000
                              100   150            200             250                   300                350               400
                                                              Pressure (Bars)
 Figure 11: Comparison of the proposed correlation methodology for a well with two sets of temperature depths (with less and more
                     data points) against the actual measured data and the result of single density approach
SPE 124578                                                                                                                           11


                                     600
                                                 Single Density
                                                 Less Points
                                     500
                         Estimated               More Points

                                     400


                                     300


                                     200
                                           200      300              400              500              600

                                                                Measured
   Figure 12: The estimated bottom-hole pressures (correlation with more/less points and single density) in bars at the well datum
                        against their corresponding measured data for down-hole surveys in different wells.

Figure 12 compares the results estimated using the correlation methodology and the single density for down-hole surveys in
several different wells. It shows that the error related to the single density approach is increasing with depletion, while the
proposed correlation in this paper gives a similar pressure estimate to the measured one. Besides it also shows that increasing
the number of steps in the calculation makes it more robust, resulting a better estimate.

Conclusion
A segregated phase distribution has been observed on some available static pressure gradient surveys, where three gradients
were identified. They correspond to three different phases, i.e. gas on the top, condensate in the middle and supercritical gas at
the bottom of the well. This phenomenon of having a low density fluid below a higher density fluid is related to the thermo-
dynamical behaviour of the supercritical fluid.

We show that the fluid densities can be numerically estimated from each phase composition, at the corresponding pressure and
temperature in the tubing, and the results are comparable to the densities derived from the measured gradients. Based on this, a
correlation methodology has been developed to derive the static bottom-hole pressure from the well-head shut-in pressure
using thermodynamic modeling.

The pressures estimated using the proposed methodology match reasonably (less than 2% difference) the bottom-hole shut-in
pressure observed during static surveys, whereas this error for a single density approach is very high (more than 10%) and
increases with depletion.

Nomenclature
BHP = Bottom-Hole Pressure                                             m     =    meters
BHSIP = Bottom-Hole Shut-In Pressure                                   P     =    Pressure
CVD = Constant Volume Depletion                                        PVT   =    Pressure, Volume and Temperature
DegC = Degrees Centigrade                                              ρ     =    Density
EoS   = Equation of State                                              Rho. =     Density
g     = Gravity (=9.8m/s2)                                             T     =    Temperature
GLR = Gas Liquid Ratio                                                 TVDSS =    True Vertical Depth Sub-Sea
GOR = Gas Oil Ratio                                                    UKCS =     United Kingdom Continental Shelf
h     = Datum vertical depth from well head gauge                      Vap. =     Vapour (phase)
HP    = High Pressure                                                  WHP =      Well Head Pressure
HT    = High Temperature                                               WHSIP =    Well Head Shut-In Pressure
i     = Initial (Condition in the reservoir)                           Z’    =    Compressibility Factor
Liq.  = Liquid
12                                                                                                                        SPE 124578


Acknowledgements
The authors would like to thank Francois-Jean Millancourt, Ole-Petter Hansen, Francois Montel, Gregory Joffroy and Glyn
Waterhouse for their support, contributions and useful discussions, as well as the Elgin Franklin co-ventures (Total E&P UK,
ENI UK Limited, BG Group, GDF SUEZ, EON Ruhrgas UK North Sea Limited, ExxonMobil, Chevron, Dyas, Oranje-
Nassau) for their permission to present and publish this material.

References
Bender, C. V. and Holden, W. R.: “Static Pressure Gradient Reversals in Gas Wells”, SPE 13092 (1984).

Cañas, J., Pop, J., Dubost, F. and Elshahawi, H.: “Advanced Compositional Gradient Analysis”, SPE 115429 (2008).

Fair, C., Cook, B., Brighton, T., Redman, M. and Newman, S.: “Gas/Condensate and Oil Well Testing - From the Surface”, SPE 77701
      (2002).

Firoozabadi, A.: “Thermodynamics of Hydrocarbon Reservoirs”, Mc Graw Hill, 1999.

McCain, W. D. Jr.: “The Properties of Petroleum Fluids”, PennWell, Second Edition, 1990.

McCoy J. N., Podio, A. L., Rowlan, L. and Garrett M.: “Use of Acoustic Surveys for Field Calibration of Surface Readout BHP gages in
   ESP Installations”, SPE 37452 (1997).

Podio, A. L., Weeks, S. G. and McCoy J. N.: “Low Cost Wellsite Determination of Bottom-hole Pressure from Acoustic Surveys in High
    Pressure Wells”, SPE 13254 (1984).

Rzasa, M. J. and Katz, D. L.: “Calculation of Static Pressure Gradient in Gas Wells”, Trans., AIME, 160 (1945) 100-106.

Waldman, N., Fair, C., Tyrrell, C. and Kumar, R.: “Subsea Well Testing at the Subsea Tree”, SPE 77626 (2002).

Appendix A
Single Average Density Approach:
    The single average density approach was used so far for the wells in the Elgin Franklin area. The approach assumes that a
single density can represent the pressure gradient observed in the well. It uses one single density and the well datum depth (h,
relevant to the well head gauge depth) to convert well head shut-in pressure (WHSIP) to bottom-hole. This assumption is true
as long as the fluid pressure along the well is above the dew point and therefore represents a single phase with a single average
density.

     It should be reminded that the normal practice in the field is that the well head shut-in pressure is normally recorded at the
end of each well shut-in. The pressure is recorded with a gauge located just before the production wing valve on the wellhead,
while this valve is closed and the down-hole safety valve (a few hundred meters below) is open. Then a first guess of the well
fluid density is made based on a previous bottom-hole shut-in pressure or an estimate (P) and its corresponding compressibility
factor (Z’), using the initial reservoir fluid data, i.e. its initial compressibility factor (Z’i) and density (ρi), as shown in
Equation 1:


                          Z i' P
     Equation 1:    ρ = ρi '
                          Z Pi

    The first guess for density from the Equation 1, is then used along with the recorded well head shut-in pressure to estimate
a first guess of the bottom-hole shut-in pressure (BHSIP), using the simple Equation 2:

     Equation 2:    BHSIP = ρgh + WHSIP

    This pressure is then used to calculate its corresponding compressibility factor using simple interpolation within a table of
the well fluid’s compressibility factors vs. pressure (derived from the field’s PVT model). This first guess bottom-hole shut-in
pressure and its Z’ value is again used in the Equation 1 to recalculate a final guess for the density. This final density is then
used to calculate the final bottom-hole shut-in pressure using the Equation 2.

Mais conteúdo relacionado

Mais procurados

Q921 rfp lec3
Q921 rfp lec3Q921 rfp lec3
Q921 rfp lec3AFATous
 
Q913 rfp w3 lec 12, Separators and Phase envelope calculations
Q913 rfp w3 lec 12, Separators and Phase envelope calculationsQ913 rfp w3 lec 12, Separators and Phase envelope calculations
Q913 rfp w3 lec 12, Separators and Phase envelope calculationsAFATous
 
phase-behavior
phase-behaviorphase-behavior
phase-behaviorconterfoil
 
Q922+rfp+l05 v1
Q922+rfp+l05 v1Q922+rfp+l05 v1
Q922+rfp+l05 v1AFATous
 
Classification of reservoirs
Classification of reservoirsClassification of reservoirs
Classification of reservoirsFertiglobe
 
Design of packed columns
Design of packed columnsDesign of packed columns
Design of packed columnsalsyourih
 
Tubing Performance Relation (TPR)
Tubing Performance Relation (TPR)Tubing Performance Relation (TPR)
Tubing Performance Relation (TPR)James Craig
 
Q921 rfp lec9 v1
Q921 rfp lec9 v1Q921 rfp lec9 v1
Q921 rfp lec9 v1AFATous
 
Q922+rfp+l02 v1
Q922+rfp+l02 v1Q922+rfp+l02 v1
Q922+rfp+l02 v1AFATous
 
Q921 rfp lec7 v1
Q921 rfp lec7 v1Q921 rfp lec7 v1
Q921 rfp lec7 v1AFATous
 
A Study Of Production Optimization Of An Oil Copy
A Study Of Production Optimization Of An Oil   CopyA Study Of Production Optimization Of An Oil   Copy
A Study Of Production Optimization Of An Oil Copyaadrish
 
Well Test Analysis in Horizontal Wells
Well Test Analysis in Horizontal WellsWell Test Analysis in Horizontal Wells
Well Test Analysis in Horizontal WellsSohil Shah
 
Factors effecting vertical lift performance
Factors effecting vertical lift performanceFactors effecting vertical lift performance
Factors effecting vertical lift performanceJALEEL AHMED
 
Two Phase Flow Measurements under Static and Dynamic Conditions for Predictin...
Two Phase Flow Measurements under Static and Dynamic Conditions for Predictin...Two Phase Flow Measurements under Static and Dynamic Conditions for Predictin...
Two Phase Flow Measurements under Static and Dynamic Conditions for Predictin...Mehdi Ghobadi , PhD., MBA
 
Episode 38 : Bin and Hopper Design
Episode 38 :  Bin and Hopper DesignEpisode 38 :  Bin and Hopper Design
Episode 38 : Bin and Hopper DesignSAJJAD KHUDHUR ABBAS
 
Horizontal Well Performance Optimization Analysis
Horizontal Well Performance Optimization AnalysisHorizontal Well Performance Optimization Analysis
Horizontal Well Performance Optimization AnalysisMahmood Ghazi
 
Q913 rfp w2 lec 5
Q913 rfp w2 lec 5Q913 rfp w2 lec 5
Q913 rfp w2 lec 5AFATous
 
Q913 rfp w1 lec 2
Q913 rfp w1 lec 2Q913 rfp w1 lec 2
Q913 rfp w1 lec 2AFATous
 

Mais procurados (20)

Q921 rfp lec3
Q921 rfp lec3Q921 rfp lec3
Q921 rfp lec3
 
DOT 2002 Functional Approach to Flow Assurance
DOT 2002 Functional Approach to Flow AssuranceDOT 2002 Functional Approach to Flow Assurance
DOT 2002 Functional Approach to Flow Assurance
 
Q913 rfp w3 lec 12, Separators and Phase envelope calculations
Q913 rfp w3 lec 12, Separators and Phase envelope calculationsQ913 rfp w3 lec 12, Separators and Phase envelope calculations
Q913 rfp w3 lec 12, Separators and Phase envelope calculations
 
phase-behavior
phase-behaviorphase-behavior
phase-behavior
 
Q922+rfp+l05 v1
Q922+rfp+l05 v1Q922+rfp+l05 v1
Q922+rfp+l05 v1
 
Classification of reservoirs
Classification of reservoirsClassification of reservoirs
Classification of reservoirs
 
Design of packed columns
Design of packed columnsDesign of packed columns
Design of packed columns
 
Tubing Performance Relation (TPR)
Tubing Performance Relation (TPR)Tubing Performance Relation (TPR)
Tubing Performance Relation (TPR)
 
Q921 rfp lec9 v1
Q921 rfp lec9 v1Q921 rfp lec9 v1
Q921 rfp lec9 v1
 
Q922+rfp+l02 v1
Q922+rfp+l02 v1Q922+rfp+l02 v1
Q922+rfp+l02 v1
 
Q921 rfp lec7 v1
Q921 rfp lec7 v1Q921 rfp lec7 v1
Q921 rfp lec7 v1
 
A Study Of Production Optimization Of An Oil Copy
A Study Of Production Optimization Of An Oil   CopyA Study Of Production Optimization Of An Oil   Copy
A Study Of Production Optimization Of An Oil Copy
 
Well Test Analysis in Horizontal Wells
Well Test Analysis in Horizontal WellsWell Test Analysis in Horizontal Wells
Well Test Analysis in Horizontal Wells
 
Factors effecting vertical lift performance
Factors effecting vertical lift performanceFactors effecting vertical lift performance
Factors effecting vertical lift performance
 
Two Phase Flow Measurements under Static and Dynamic Conditions for Predictin...
Two Phase Flow Measurements under Static and Dynamic Conditions for Predictin...Two Phase Flow Measurements under Static and Dynamic Conditions for Predictin...
Two Phase Flow Measurements under Static and Dynamic Conditions for Predictin...
 
Episode 38 : Bin and Hopper Design
Episode 38 :  Bin and Hopper DesignEpisode 38 :  Bin and Hopper Design
Episode 38 : Bin and Hopper Design
 
Horizontal Well Performance Optimization Analysis
Horizontal Well Performance Optimization AnalysisHorizontal Well Performance Optimization Analysis
Horizontal Well Performance Optimization Analysis
 
Q913 rfp w2 lec 5
Q913 rfp w2 lec 5Q913 rfp w2 lec 5
Q913 rfp w2 lec 5
 
Q913 rfp w1 lec 2
Q913 rfp w1 lec 2Q913 rfp w1 lec 2
Q913 rfp w1 lec 2
 
US6287084
US6287084US6287084
US6287084
 

Semelhante a Spe 124578-ms-p[1]

Artificial Lift Whitepaper: Making Your ESP Talk To You
Artificial Lift Whitepaper: Making Your ESP Talk To YouArtificial Lift Whitepaper: Making Your ESP Talk To You
Artificial Lift Whitepaper: Making Your ESP Talk To YouDean Murphy
 
Summer Internship Report At Ril
Summer Internship Report At RilSummer Internship Report At Ril
Summer Internship Report At Rilaamanarora
 
YEP Paper Contest_Alan Duong
YEP Paper Contest_Alan DuongYEP Paper Contest_Alan Duong
YEP Paper Contest_Alan DuongAlan H. Duong
 
predecting the problem of liquid oading in gas wellsl .pptx
predecting the problem of liquid oading in gas wellsl .pptxpredecting the problem of liquid oading in gas wellsl .pptx
predecting the problem of liquid oading in gas wellsl .pptxKadhimAdnan1
 
Rev. August 2014 ME495 - Pipe Flow Characteristics… Page .docx
   Rev. August 2014 ME495 - Pipe Flow Characteristics… Page .docx   Rev. August 2014 ME495 - Pipe Flow Characteristics… Page .docx
Rev. August 2014 ME495 - Pipe Flow Characteristics… Page .docxjoyjonna282
 
Seepage through an earth dam
Seepage through an earth damSeepage through an earth dam
Seepage through an earth damMan Xp
 
Reservoir chachteristic.pptx document file
Reservoir chachteristic.pptx document fileReservoir chachteristic.pptx document file
Reservoir chachteristic.pptx document fileTarekGanat1
 
Application-Of-Laplace-Transform-To-Pressure-Transient-Analysis-In-A-Reservoi...
Application-Of-Laplace-Transform-To-Pressure-Transient-Analysis-In-A-Reservoi...Application-Of-Laplace-Transform-To-Pressure-Transient-Analysis-In-A-Reservoi...
Application-Of-Laplace-Transform-To-Pressure-Transient-Analysis-In-A-Reservoi...Oluwaseun Olaleye
 
Slug Test Procedures
Slug Test ProceduresSlug Test Procedures
Slug Test Procedurestpttk
 
FYP Presentation v2.0
FYP Presentation v2.0FYP Presentation v2.0
FYP Presentation v2.0Bianchi Dy
 
Evaluating sieve tray flooding in a distillation
Evaluating sieve tray flooding in a distillationEvaluating sieve tray flooding in a distillation
Evaluating sieve tray flooding in a distillationAlexander Decker
 
Water hammer in pumped sewer mains
Water hammer in pumped sewer mainsWater hammer in pumped sewer mains
Water hammer in pumped sewer mainsEVAnetDenmark
 
Well control
Well controlWell control
Well controlSaba Saif
 

Semelhante a Spe 124578-ms-p[1] (20)

Artificial Lift Whitepaper: Making Your ESP Talk To You
Artificial Lift Whitepaper: Making Your ESP Talk To YouArtificial Lift Whitepaper: Making Your ESP Talk To You
Artificial Lift Whitepaper: Making Your ESP Talk To You
 
Summer Internship Report At Ril
Summer Internship Report At RilSummer Internship Report At Ril
Summer Internship Report At Ril
 
Electrical submersible pump
Electrical submersible pumpElectrical submersible pump
Electrical submersible pump
 
IPTC-18546-MS_Okereke NU
IPTC-18546-MS_Okereke NUIPTC-18546-MS_Okereke NU
IPTC-18546-MS_Okereke NU
 
YEP Paper Contest_Alan Duong
YEP Paper Contest_Alan DuongYEP Paper Contest_Alan Duong
YEP Paper Contest_Alan Duong
 
predecting the problem of liquid oading in gas wellsl .pptx
predecting the problem of liquid oading in gas wellsl .pptxpredecting the problem of liquid oading in gas wellsl .pptx
predecting the problem of liquid oading in gas wellsl .pptx
 
Texto ipr
Texto   iprTexto   ipr
Texto ipr
 
Rev. August 2014 ME495 - Pipe Flow Characteristics… Page .docx
   Rev. August 2014 ME495 - Pipe Flow Characteristics… Page .docx   Rev. August 2014 ME495 - Pipe Flow Characteristics… Page .docx
Rev. August 2014 ME495 - Pipe Flow Characteristics… Page .docx
 
Capillary Rise
Capillary RiseCapillary Rise
Capillary Rise
 
I1065361
I1065361I1065361
I1065361
 
Seepage through an earth dam
Seepage through an earth damSeepage through an earth dam
Seepage through an earth dam
 
Reservoir chachteristic.pptx document file
Reservoir chachteristic.pptx document fileReservoir chachteristic.pptx document file
Reservoir chachteristic.pptx document file
 
Flumping
FlumpingFlumping
Flumping
 
Application-Of-Laplace-Transform-To-Pressure-Transient-Analysis-In-A-Reservoi...
Application-Of-Laplace-Transform-To-Pressure-Transient-Analysis-In-A-Reservoi...Application-Of-Laplace-Transform-To-Pressure-Transient-Analysis-In-A-Reservoi...
Application-Of-Laplace-Transform-To-Pressure-Transient-Analysis-In-A-Reservoi...
 
Slug Test Procedures
Slug Test ProceduresSlug Test Procedures
Slug Test Procedures
 
FYP Presentation v2.0
FYP Presentation v2.0FYP Presentation v2.0
FYP Presentation v2.0
 
Evaluating sieve tray flooding in a distillation
Evaluating sieve tray flooding in a distillationEvaluating sieve tray flooding in a distillation
Evaluating sieve tray flooding in a distillation
 
Water hammer in pumped sewer mains
Water hammer in pumped sewer mainsWater hammer in pumped sewer mains
Water hammer in pumped sewer mains
 
Well control
Well controlWell control
Well control
 
FlowTypesRE.pdf
FlowTypesRE.pdfFlowTypesRE.pdf
FlowTypesRE.pdf
 

Último

Hyperautomation and AI/ML: A Strategy for Digital Transformation Success.pdf
Hyperautomation and AI/ML: A Strategy for Digital Transformation Success.pdfHyperautomation and AI/ML: A Strategy for Digital Transformation Success.pdf
Hyperautomation and AI/ML: A Strategy for Digital Transformation Success.pdfPrecisely
 
How to write a Business Continuity Plan
How to write a Business Continuity PlanHow to write a Business Continuity Plan
How to write a Business Continuity PlanDatabarracks
 
DevEX - reference for building teams, processes, and platforms
DevEX - reference for building teams, processes, and platformsDevEX - reference for building teams, processes, and platforms
DevEX - reference for building teams, processes, and platformsSergiu Bodiu
 
SALESFORCE EDUCATION CLOUD | FEXLE SERVICES
SALESFORCE EDUCATION CLOUD | FEXLE SERVICESSALESFORCE EDUCATION CLOUD | FEXLE SERVICES
SALESFORCE EDUCATION CLOUD | FEXLE SERVICESmohitsingh558521
 
DSPy a system for AI to Write Prompts and Do Fine Tuning
DSPy a system for AI to Write Prompts and Do Fine TuningDSPy a system for AI to Write Prompts and Do Fine Tuning
DSPy a system for AI to Write Prompts and Do Fine TuningLars Bell
 
SAP Build Work Zone - Overview L2-L3.pptx
SAP Build Work Zone - Overview L2-L3.pptxSAP Build Work Zone - Overview L2-L3.pptx
SAP Build Work Zone - Overview L2-L3.pptxNavinnSomaal
 
Ensuring Technical Readiness For Copilot in Microsoft 365
Ensuring Technical Readiness For Copilot in Microsoft 365Ensuring Technical Readiness For Copilot in Microsoft 365
Ensuring Technical Readiness For Copilot in Microsoft 3652toLead Limited
 
Moving Beyond Passwords: FIDO Paris Seminar.pdf
Moving Beyond Passwords: FIDO Paris Seminar.pdfMoving Beyond Passwords: FIDO Paris Seminar.pdf
Moving Beyond Passwords: FIDO Paris Seminar.pdfLoriGlavin3
 
Connect Wave/ connectwave Pitch Deck Presentation
Connect Wave/ connectwave Pitch Deck PresentationConnect Wave/ connectwave Pitch Deck Presentation
Connect Wave/ connectwave Pitch Deck PresentationSlibray Presentation
 
The Fit for Passkeys for Employee and Consumer Sign-ins: FIDO Paris Seminar.pptx
The Fit for Passkeys for Employee and Consumer Sign-ins: FIDO Paris Seminar.pptxThe Fit for Passkeys for Employee and Consumer Sign-ins: FIDO Paris Seminar.pptx
The Fit for Passkeys for Employee and Consumer Sign-ins: FIDO Paris Seminar.pptxLoriGlavin3
 
Advanced Computer Architecture – An Introduction
Advanced Computer Architecture – An IntroductionAdvanced Computer Architecture – An Introduction
Advanced Computer Architecture – An IntroductionDilum Bandara
 
WordPress Websites for Engineers: Elevate Your Brand
WordPress Websites for Engineers: Elevate Your BrandWordPress Websites for Engineers: Elevate Your Brand
WordPress Websites for Engineers: Elevate Your Brandgvaughan
 
The Ultimate Guide to Choosing WordPress Pros and Cons
The Ultimate Guide to Choosing WordPress Pros and ConsThe Ultimate Guide to Choosing WordPress Pros and Cons
The Ultimate Guide to Choosing WordPress Pros and ConsPixlogix Infotech
 
New from BookNet Canada for 2024: BNC CataList - Tech Forum 2024
New from BookNet Canada for 2024: BNC CataList - Tech Forum 2024New from BookNet Canada for 2024: BNC CataList - Tech Forum 2024
New from BookNet Canada for 2024: BNC CataList - Tech Forum 2024BookNet Canada
 
How AI, OpenAI, and ChatGPT impact business and software.
How AI, OpenAI, and ChatGPT impact business and software.How AI, OpenAI, and ChatGPT impact business and software.
How AI, OpenAI, and ChatGPT impact business and software.Curtis Poe
 
Are Multi-Cloud and Serverless Good or Bad?
Are Multi-Cloud and Serverless Good or Bad?Are Multi-Cloud and Serverless Good or Bad?
Are Multi-Cloud and Serverless Good or Bad?Mattias Andersson
 
unit 4 immunoblotting technique complete.pptx
unit 4 immunoblotting technique complete.pptxunit 4 immunoblotting technique complete.pptx
unit 4 immunoblotting technique complete.pptxBkGupta21
 
The State of Passkeys with FIDO Alliance.pptx
The State of Passkeys with FIDO Alliance.pptxThe State of Passkeys with FIDO Alliance.pptx
The State of Passkeys with FIDO Alliance.pptxLoriGlavin3
 
Merck Moving Beyond Passwords: FIDO Paris Seminar.pptx
Merck Moving Beyond Passwords: FIDO Paris Seminar.pptxMerck Moving Beyond Passwords: FIDO Paris Seminar.pptx
Merck Moving Beyond Passwords: FIDO Paris Seminar.pptxLoriGlavin3
 
Take control of your SAP testing with UiPath Test Suite
Take control of your SAP testing with UiPath Test SuiteTake control of your SAP testing with UiPath Test Suite
Take control of your SAP testing with UiPath Test SuiteDianaGray10
 

Último (20)

Hyperautomation and AI/ML: A Strategy for Digital Transformation Success.pdf
Hyperautomation and AI/ML: A Strategy for Digital Transformation Success.pdfHyperautomation and AI/ML: A Strategy for Digital Transformation Success.pdf
Hyperautomation and AI/ML: A Strategy for Digital Transformation Success.pdf
 
How to write a Business Continuity Plan
How to write a Business Continuity PlanHow to write a Business Continuity Plan
How to write a Business Continuity Plan
 
DevEX - reference for building teams, processes, and platforms
DevEX - reference for building teams, processes, and platformsDevEX - reference for building teams, processes, and platforms
DevEX - reference for building teams, processes, and platforms
 
SALESFORCE EDUCATION CLOUD | FEXLE SERVICES
SALESFORCE EDUCATION CLOUD | FEXLE SERVICESSALESFORCE EDUCATION CLOUD | FEXLE SERVICES
SALESFORCE EDUCATION CLOUD | FEXLE SERVICES
 
DSPy a system for AI to Write Prompts and Do Fine Tuning
DSPy a system for AI to Write Prompts and Do Fine TuningDSPy a system for AI to Write Prompts and Do Fine Tuning
DSPy a system for AI to Write Prompts and Do Fine Tuning
 
SAP Build Work Zone - Overview L2-L3.pptx
SAP Build Work Zone - Overview L2-L3.pptxSAP Build Work Zone - Overview L2-L3.pptx
SAP Build Work Zone - Overview L2-L3.pptx
 
Ensuring Technical Readiness For Copilot in Microsoft 365
Ensuring Technical Readiness For Copilot in Microsoft 365Ensuring Technical Readiness For Copilot in Microsoft 365
Ensuring Technical Readiness For Copilot in Microsoft 365
 
Moving Beyond Passwords: FIDO Paris Seminar.pdf
Moving Beyond Passwords: FIDO Paris Seminar.pdfMoving Beyond Passwords: FIDO Paris Seminar.pdf
Moving Beyond Passwords: FIDO Paris Seminar.pdf
 
Connect Wave/ connectwave Pitch Deck Presentation
Connect Wave/ connectwave Pitch Deck PresentationConnect Wave/ connectwave Pitch Deck Presentation
Connect Wave/ connectwave Pitch Deck Presentation
 
The Fit for Passkeys for Employee and Consumer Sign-ins: FIDO Paris Seminar.pptx
The Fit for Passkeys for Employee and Consumer Sign-ins: FIDO Paris Seminar.pptxThe Fit for Passkeys for Employee and Consumer Sign-ins: FIDO Paris Seminar.pptx
The Fit for Passkeys for Employee and Consumer Sign-ins: FIDO Paris Seminar.pptx
 
Advanced Computer Architecture – An Introduction
Advanced Computer Architecture – An IntroductionAdvanced Computer Architecture – An Introduction
Advanced Computer Architecture – An Introduction
 
WordPress Websites for Engineers: Elevate Your Brand
WordPress Websites for Engineers: Elevate Your BrandWordPress Websites for Engineers: Elevate Your Brand
WordPress Websites for Engineers: Elevate Your Brand
 
The Ultimate Guide to Choosing WordPress Pros and Cons
The Ultimate Guide to Choosing WordPress Pros and ConsThe Ultimate Guide to Choosing WordPress Pros and Cons
The Ultimate Guide to Choosing WordPress Pros and Cons
 
New from BookNet Canada for 2024: BNC CataList - Tech Forum 2024
New from BookNet Canada for 2024: BNC CataList - Tech Forum 2024New from BookNet Canada for 2024: BNC CataList - Tech Forum 2024
New from BookNet Canada for 2024: BNC CataList - Tech Forum 2024
 
How AI, OpenAI, and ChatGPT impact business and software.
How AI, OpenAI, and ChatGPT impact business and software.How AI, OpenAI, and ChatGPT impact business and software.
How AI, OpenAI, and ChatGPT impact business and software.
 
Are Multi-Cloud and Serverless Good or Bad?
Are Multi-Cloud and Serverless Good or Bad?Are Multi-Cloud and Serverless Good or Bad?
Are Multi-Cloud and Serverless Good or Bad?
 
unit 4 immunoblotting technique complete.pptx
unit 4 immunoblotting technique complete.pptxunit 4 immunoblotting technique complete.pptx
unit 4 immunoblotting technique complete.pptx
 
The State of Passkeys with FIDO Alliance.pptx
The State of Passkeys with FIDO Alliance.pptxThe State of Passkeys with FIDO Alliance.pptx
The State of Passkeys with FIDO Alliance.pptx
 
Merck Moving Beyond Passwords: FIDO Paris Seminar.pptx
Merck Moving Beyond Passwords: FIDO Paris Seminar.pptxMerck Moving Beyond Passwords: FIDO Paris Seminar.pptx
Merck Moving Beyond Passwords: FIDO Paris Seminar.pptx
 
Take control of your SAP testing with UiPath Test Suite
Take control of your SAP testing with UiPath Test SuiteTake control of your SAP testing with UiPath Test Suite
Take control of your SAP testing with UiPath Test Suite
 

Spe 124578-ms-p[1]

  • 1. SPE 124578 Estimation of Static Bottom Hole Pressure From Well-Head Shut-in Pressure for a Supercritical Fluid in a Depleted HP/HT Reservoir Peyman R. Nurafza,* SPE, and Jeremie Fernagu, SPE, Total E&P UK Ltd. Copyright 2009, Society of Petroleum Engineers This paper was prepared for presentation at the 2009 SPE Offshore Europe Oil & Gas Conference & Exhibition held in Aberdeen, UK, 8–11 September 2009. This paper was selected for presentation by an SPE program committee following review of information contained in an abstract submitted by the author(s). Contents of the paper have not been reviewed by the Society of Petroleum Engineers and are subject to correction by the author(s). The material does not necessarily reflect any position of the Society of Petroleum Engineers, its officers, or members. Electronic reproduction, distribution, or storage of any part of this paper without the written consent of the Society of Petroleum Engineers is prohibited. Permission to reproduce in print is restricted to an abstract of not more than 300 words; illustrations may not be copied. The abstract must contain conspicuous acknowledgment of SPE copyright. Abstract A periodic measurement of static bottom-hole pressure to monitor the reservoir depletion is an essential reservoir management practice. In an HP/HT offshore environment, the unavailability of qualified permanent down-hole monitoring technologies and the risks and costs of occasional operations make gradient surveys very difficult to acquire on a routine basis. On Elgin-Franklin (HP/HT gas condensate fields, North Sea, UKCS), the typical approach is to use an average fluid density to estimate the static bottom-hole pressure from the well-head shut-in pressure. This estimation is valid as long as there is only one phase present inside the well-bore. As soon as the pressure drops below dew point in the tubing, the vertical phase distribution changes and the bottom-hole pressure can not be accurately estimated using one single average density. Fluid segregation mechanisms involve complex thermo-convective phenomenon, in association to gravity, which are strongly related to the temperature gradient in the well bore. Segregated phase distribution has been observed on some available static pressure gradient surveys, where three gradients were identified. They correspond to three different phases, i.e. gas at the top, condensate in the middle and supercritical gas at the bottom of the well. This phenomenon of having a low density fluid below a higher density fluid was referred to as "gradient reversals" (Bender and Holden, 1984). At that time, it was assumed to be only due to the increasing temperature with increasing depth, but not explicitly related to the thermo-dynamical behaviour of the critical fluid. In this case, we show that the fluid densities numerically estimated from each phase composition, at the corresponding pressure and temperature in the tubing, are comparable to the densities derived from the measured gradients. Based on this, a robust correlation methodology has been developed to derive the static bottom-hole pressure from the well-head shut-in pressure using thermodynamic modeling. Introduction Elgin and Franklin are deep HP/HT gas condensate fields situated in the Central Graben of the North Sea. Main reservoir is Upper-Jurassic Fulmar sand buried at more than 5000 meters depth and containing a rich fluid in supercritical conditions (1100 bars and 190 degC). The fields have been on-stream since 2001. After eight years of production, the reservoir pressure has declined by approximately 700 bars. HP/HT reservoirs have posed new challenges for field developments and new challenges appear as these fields mature. One of these challenges is dropping below dew point which will impact well performance, field production, measurement limitations and future developments. In terms of well performance, the main related issues are condensate loading in the well and consequently cyclic degradation of well performance, and condensate banking near the well-bore inside the reservoir causing production degradation, compositional changes and GOR increase. The change of the fluid composition and the difficulty to sample regularly introduce inaccuracies in surface measurements, well allocations, and eventually in proper evaluation of further development options. * Currently with E.ON Ruhrgas UK North Sea Ltd.
  • 2. 2 SPE 124578 Periodic measurement of static bottom-hole pressure to monitor the reservoir depletion is an essential reservoir engineering tool to understand, model and history match the reservoir behaviour, further predict future reservoir behaviour and tackle the forthcoming challenges in well and reservoir performance. In HP/HT offshore wells not equipped with permanent down-hole gauges, initially not qualified for HPHT conditions, and the limitations in undertaking down-hole surveys, another serious concern is the true estimation of the static reservoir pressure. A classic alternative approach consists of using an average fluid density to estimate the static bottom-hole pressure from the well-head shut-in pressure (appendix A). This estimation is acceptable as long as there is only one phase present inside the well-bore. As soon as the pressure drops below dew point in the tubing, the vertical phase distribution changes and the bottom- hole pressure can not be accurately estimated using one single average density. Another methodology is therefore required to estimate the pressure gradient in the well with respect to the fluids, and consequently calculate the static bottom-hole pressure at well datum. Recent static pressure gradient surveys in Elgin-Franklin wells have shown a segregated phase distribution, where three gradients were identified. These gradients correspond to three different phases, i.e. gas on the top, condensate in the middle and supercritical gas at the bottom of the well. In this case, we show that the fluid densities numerically estimated from each phase composition, at the corresponding pressure and temperature in the tubing, are comparable to the densities derived from the measured gradients. Based on this, a robust correlation methodology has been developed to derive the static bottom-hole pressure from the well-head shut-in pressure using thermodynamic modeling. In this paper, surveys carried out on the Elgin-Franklin wells, the interpretation of these data, and a methodology to calculate the BHP from the WHP, will be presented and discussed. Literature Review Gradients of pressure in tubing and reservoir, and the methods used have been largely discussed in literature (such as Podio, et.al, 1984; McCoy, et. al., 1997; Fair, et. al., 2002; Waldman, et. al., 2002). The earlier analyses (Rzasa and Katz, 1945) rely on the use of either average value or trial and error solution for temperature and fluid properties in order to estimate the BHP from the WHP. This can be done as long as conditions in the tubing are reasonable and the fluid remains monophasic. 400 350 300 0.0 0.1 0.2 250 0.3 0.4 P (bars) 0.5 200 0.6 150 0.7 0.8 0.9 1.0 100 50 0 0 50 100 150 200 250 300 350 400 T (degC) Figure 1: A typical phase envelope for Elgin/Franklin fluids With wells becoming deeper, it became obvious that temperature and properties of the fluid would have to be better described to explain some phenomena, Reversal gradients, i.e. gradients of pressure that decrease with increasing depth, are frequently observed in gas wells. As they imply a heavier fluid above a lighter one, it can appear non-physical and therefore cast doubt on surveys that are already known to be prone to uncertainty due to the depth location, the accuracy and reliability of the gauges, the time of stabilization, the effect of temperature, etc. Bender and Holden (1984) observed that reversal gradient can be
  • 3. SPE 124578 3 explained by the existence of a geothermal gradient. With the development of more complex fields and the progress made in the analysis and the modeling of fluids, reversal gradients and others complex pressure gradients have been attributed to the fluid itself. Studies of the evolution of the fluid with depth are now common, but models and studies remain mainly focus on reservoir condition, where property of compositional gradient associated to pressure gradient provide precious information about the mechanisms occurring in the reservoir (Cañas, et. al. 2008). The conditions along the tubing stretch over a wider range than what is usually seen in reservoirs. Reservoir modeling efforts help to understand the tubing phenomena when the well is shut- in. PVT Summary Several reservoirs are exploited in the Elgin-Franklin area. Several fluid regions have been identified although the fluids remain relatively similar. They can be defined as condensate gases with a total GLR ranging between 700-1800 m3/m3. At initial reservoir conditions (of around 1100bar and 190degC) the fluids have densities from 430 to 530 kg/m3. With saturation pressures from 240 to 380 bar, the fluids are supercritical at initial conditions. A phase envelope for one of the fluids is presented in Figure 1. The thermodynamic modeling used in this study was performed using an in-house numerical tool, based on the Peng-Robinson equation of state. The fluids are described with a composition using 17 components. Three pseudo-components are used to model the properties of the heavier components and adjusted in order to match the usual experimental data obtained on the fluids. These properties are basically the molar mass, the critical pressure, the critical temperature, the acentric factor, the interaction coefficients and the volume shift. When possible, the volume shift has been described as dependant of the temperature for a better description of the fluid in the wide range of temperature reached in the tubing. Field Observations The number of down-hole surveys performed in the Elgin/Franklin is very limited. First of all, due to the high pressures and temperatures, it has not been possible to install permanent down-hole gauges in the wells to monitor the bottom-hole pressure. Furthermore, the huge depletion of around 700 bars applied to the reservoir has caused liner/casing deformation in most of the wells. These deformations either restrict access to the bottom hole or increase the risk of leaving equipment down-hole, which might impact well performance, or even cause shut-in of the well for the fishing operations. In addition operational and People on Board limitations have made it difficult to justify and perform all the surveys recommended in the annual monitoring plan. However, when the opportunity arises to carry out a well operation, at least a static gradient survey has been performed. Wellhead Shut-in Pressure Estimated Bottom-hole Shut-in Pressure Measured Bottom-hole Shut-in Pressure Pressure (Bara) Date Figure 2: Estimated bottom-hole shut-in pressure from the wellhead using an average density versus measured pressure
  • 4. 4 SPE 124578 1000 0 -1000 Depth (mTVDSS) -2000 Trend 1 -3000 Trend 2 Trend 3 Psat -4000 Trend 1 Trend 2 -5000 Trend 3 Psat Trend -6000 200 220 240 260 280 300 320 340 360 380 400 Pressure (Bars) Figure 3: Static and saturation pressure versus depth, with the three gradients In the absence of a down-hole survey, a typical practice is to estimate the static reservoir pressure from the well-head shut-in pressure with a single fluid density along the well (appendix A). The methodology and the results are normally adjusted and updated whenever a static gradient survey is performed. However, the difference between the measured static pressure at the bottom hole and the estimated pressure using this methodology has constantly increased over the past three years, to reach 40bars in most of the wells (Figure 2). Review of recent static gradient surveys was performed to identify the reason behind the increasing error. It was found that the later static pressure gradient surveys recorded in some of the wells showed a segregated phase distribution, with three gradients identified, whereas the earlier surveys of the same well gave a single gradient. Gradient Density Trend 3 m/bars Kg/m Trend 1 -42 240 Trend 2 -22 470 Trend 3 -28 370 Table 1: Estimated static pressure gradients and equivalent density for the well in Figure 3 The pressure recorded at different stations during the static gradient surveys is plotted against the gauge depth in mTVDSS. As shown in Figure 3, the gradient survey exhibits three clear gradient trends, representing three different fluid regimes at different density, a very light column on the top of the well (Trend 1), a heavy column in the middle (Trend 2) and a lighter column at the bottom (Trend 3). The last trend is assumed to be constant down to datum depth.
  • 5. SPE 124578 5 450 Trend 1 400 Trend 2 -5000mTVDSS Trend 3 350 -4000mTVDSS Phase Diagram Critical Point 300 0.52 -3000mTVDSS Pressure (Bars) -2000mTVDSS 250 -1000mTVDSS 0.6 200 0mTVDSS 150 0.7 0.8 100 0.9 1.0 50 0 50 100 150 200 250 300 350 400 Temprature (DegC) Figure 4: Dry fluid phase diagram and recorded pressure and temperature at different stations The pressure gradient trends and their equivalent values in density terms are summarized in Table 1. As expected trend 1 (top of the well) has a lower gradient and therefore lower density than trend 2 (middle of the well). In other words, a lighter fluid is on top of a heavier fluid. However, the bottom trend (Trend 3) has a lower density than the middle trend (Trend 2), which means that a lighter fluid is situated below a heavier fluid. Depth P T Vap. Rho Liq. Rho mTVDSS bars degC kg/m3 kg/m3 31 210 10 313 611 -194 215 106 202 573 -444 221 124 203 562 -693 227 124 209 559 -940 232 124 215 555 -1183 238 126 221 551 -1420 243 130 226 545 -1653 249 136 231 538 -1884 255 141 237 531 -2121 261 146 244 524 -2362 273 150 258 513 -2608 285 153 273 502 -2857 297 158 289 489 -3107 308 161 307 477 -3357 319 164 325 464 -3607 329 166 346 449 -3857 338 169 361 - -4107 347 172 362 - -4357 356 175 363 - -4607 365 178 365 - -4857 373 181 366 - -5107 382 183 367 - -5307 391 186 368 - Table 2: Gradient survey pressure and temperature and corresponding densities calculated using dry composition
  • 6. 6 SPE 124578 To explain these gradients, the saturation pressure and the density of the fluid have been modeled using the reservoir fluid’s dry composition, at each pressure and temperature recorded during the survey. The saturation pressures are shown in Figure 3. Near -4000mTVDSS, the pressure drops below the dew point. This is very close to the point where the two different gradient trends (trends 2 and 3) cross each other. This phase change is also shown in the phase diagram for the dry fluid composition in Figure 4, where the measured pressure and temperatures from the static gradient survey are plotted on top of that, with given depth ranges, and classified with their respective trends. Therefore the bottom trend belongs to the fluid at supercritical condition, and near -4000mTVDSS, the pressure and temperature drop below the dew point, passing the 100% vapour phase line in Figure 4 and entering the two-phase zone of the diagram. This is the point where the fluid in the well suddenly starts to drop liquid. Furthermore to be able to explain the observed gradient change at the top of the well, the densities of both available vapour and/or liquid phases are calculated and shown in the Table 2. 0 -1000 -2000 Depth (mTVDSS) -3000 Trend 1 -4000 Trend 2 Trend 3 All -5000 Trend 1 Gradient Trend 2 Gradient Trend 3 Gradient -6000 0 100 200 300 400 500 600 700 Density (Kg/m3) Figure 5: Calculated densities from using in-house PVT tool, with densities estimated from the pressure gradients vs. depth The observed gradients in Table 1, are comparable to the calculated down-hole densities at the same depths, from the dry fluid composition (Table 2) shown in the Figure 5. The calculated densities from the PVT package have been averaged on the three ranges of depth, for each trend, as shown in the Table 3. The slight difference observed is due to the dry composition used for the fluid, when the real fluid is wet and has a higher density (as seen in the measured gradients in Table 1). Average Down-Hole Density Trend kg/m3 Trend 1 230 Trend 2 488 Trend 3 365 Table 3: Average calculated down-hole densities The 3rd trend, at the bottom of the well, clearly shows a supercritical gas, where the 2nd trend and 1st trend correspond respectively to the liquid and the gas phases. This can be explained using the phase diagram shown in Figure 4. The pressure and temperature increase with depth. It can be assumed that while rising to surface, at some point the fluid pressure drops below the dew point and that the liquid drop-out will steadily increase. Thus the liquid will form a film around the tubing that will start to flow downwards. This strips off the fluid at the top of its heavier components and leaves the lighter gas phase as the main phase in the fluid column. It is likely that as the liquid film moves downward into higher pressure and temperature domains it will vaporize again. This thermo-convective phenomenon continues further, until a preliminary equilibrium is reached, where the liquid becomes the dominant phase in the middle part of the well. Deeper in the well, as saturation point is reached, the liquid phase can fully vaporize into supercritical fluid, until the whole system reaches a preliminary equilibrium. The well inclination also plays a role in this equilibration.
  • 7. SPE 124578 7 700 600 Phase Diagram Liquid Phase Supercritical Vapor Critical Point 500 1st survey 2nd Survey After 4 Years Pressure (bars) 400 300 0.0 0.1 0.2 0.3 0.4 Vapor Phase 0.5 200 0.6 0.7 0.8 1.0 0.9 100 Liquid & Vapor 0 0 50 100 150 200 250 300 350 400 Temperature (degC) st nd Figure 6: Pressure and temperature recorded during the 1 gradient survey and the 2 survey 4 years later, with the corresponding fluid’s phase diagram This phenomenon has been recently observed in the Elgin-Franklin area. During past surveys, down-hole pressures were well above the critical pressure. At this time, the wells mainly showed a constant pressure gradient with supercritical gas at the bottom and the liquid at the top of the well. As these two fluids have similar densities, a nearly constant gradient was observed across the well (Figure 6, 1st survey). In this earlier survey, both wellhead and bottom-hole pressures were higher than the fluid saturation pressure. Therefore a single phase fluid was observed along the well, supercritical gas and then liquid where the temperature drops below the critical point. This change is very gradual, and no major density and accordingly gradient change can be noticed. At the time of a second survey, performed 4 years afterwards, the reservoir was depleted by 300 bars with a fluid no longer monophasic along the whole tubing (Figure 6, 2nd survey).. This will lead to further fluid segregation, with liquid and vapour on the top section of the well and supercritical gas in the bottom section of the well. 0 0 Gradient = 23 m/bar = 440Kg/m3 Trend 1 -1000 Trend 2 -1000 Trend 2 Trend 1 -2000 -2000 Depth (m) Trend 1 Depth (m) -3000 Trend 2 -3000 Trend 1 Gradient Trend 2 Gradient -4000 -4000 Gradient = 23 m/bar = 440Kg/m3 -5000 -5000 -6000 -6000 400 450 500 550 600 650 700 0 100 200 300 400 500 600 Pressure (Bars) Density (Kg/m3) (a) (b) st Figure 7: Pressure gradient (a) and calculated densities compared with the gradient equivalent densities (b) of the 1 survey
  • 8. 8 SPE 124578 The pressure gradients of both surveys appear quite similar, as shown in Figure 7a and the same modeling procedure was applied with the second survey data. The fluid density was calculated for the pressures and temperatures recorded at each station, then compared to the density corresponding to the observed pressure gradient, as shown in Figure 7b. This shows that there is no major gradient and density change when moving up from the supercritical gas at the bottom of the well to the liquid on top of the well. This point is coherent with the thermodynamic theory of supercritical fluid (McCain 1990; Firoozabadi 1999), where far above the phase envelope, the limit between liquid and gas is very progressive with little changes in properties. Pressure Pressure Pressure Gas Gradient Gas Dew Point Estimated Single Gradient Density Gradient Dew Point Condensate Gradient Dew Point Well Depth Actual Fluid Condensate Gradient Gradient Supercritical Fluid Gradient Supercritical Fluid Well Datum Gradient Estimation Error (a) (b) (c) Figure 8: Comparison of the single average density approach for estimating bottom-hole shut-in pressure from wellhead, with the actual fluids in the well, (a) above the dew point (b) and (c) at two different times after drop below the dew point Correlation Methodology Based on the understanding gained from the field observations, it was attempted to develop a correlation methodology to estimate bottom hole shut-in pressure from the recorded well head shut-in pressure, for all the wells at this important stage of depletion. This methodology differs from previous single average density approaches (appendix A), by introducing the fluid phase distribution along the well, with its corresponding density to estimate more accurately the bottom-hole pressure. 0 -1000 -2000 Depth (m) -3000 1st Survey -4000 2nd Survey After 4 Years -5000 -6000 0 50 100 150 200 250 Shut-in Temperature (DegC) Figure 9: Well temperature profiles at shut-in condition for two surveys performed on the same well at 4 years time lapse
  • 9. SPE 124578 9 The use of a single density value to convert THP to BHP is reliable as long as the pressure along the well is above the saturation pressure of the fluid, and therefore represents a single phase with a single average density. However, as soon as the pressure drops below dew point, the error of using a single average density to estimate bottom hole pressure, increases (as shown in Figure 8). The proposed methodology relies on an iterative method to estimate the pressure at bottom-hole, based on the well fluid model. In addition to the recorded well-head shut-in pressure, and the composition of the fluid (defined during PVT analysis), the, temperature profile is required to calculate the densities along the well and consequently estimate the bottom hole pressure. A review of a series of down-hole surveys in the Elgin/Franklin area showed that with time, the temperature profile along a well at shut-in conditions remains almost constant assuming a similar shut-in period before performing the surveys. Figure 9 shows two different surveys carried out on the same well with a 4 years time lapse, after a similar length of well shut- in time. The temperature difference between the two surveys is negligible. 0 -1000 -2000 Depth (m) -3000 Immediately After Shut-in -4000 6 hours After Shut-in -5000 -6000 0 20 40 60 80 100 120 140 160 180 200 Shut-in Temperature (DegC) Figure 10: Well temperature profile at shut-in condition for two successive surveys in one operation However, the lapse of time between shut-in and the record temperature survey is a key parameter. Figure 10, shows two surveys performed on the same well: just after shut-in and 6 hours later. More than 20degC difference can be observed, especially at the top of the well, where the difference between the temperature of the flowing fluid and the environment around the well is larger. As long as surveys are recorded well after the well was shut-in, it can be assumed that they will show a similar temperature trend. This will be different for wells with different fluids, and depends on the stabilization time. The proposed conversion methodology is based on the calculation of the fluid density of each phase after a simple flash, using any PVT package. These densities are used to calculate the pressure at the next stage. New densities are then calculated using this pressure and the temperature either measured or interpolated from the temperature profile. An iterative calculation is then performed to determine contacts and correct the densities. We assume in the methodology presented below that the fluid is below dew point in the tubing (therefore at least two phases are present in the tubing with gas on the top, liquid deeper and potentially supercritical gas in front of perforation). The first part of the methodology aims to determine the depth of the gas/liquid contact and the pressure at this point. Based on observed results on the Elgin-Franklin fields, the contact can be found just above the depth where the calculated density for the liquid phase drops below 515 kg/m3. It should be noted that this value is valid for the Elgin/Franklin fields, but will vary depending on the type of fluid. During this first part of the methodology, for each stage, the pressure is calculated by iteration, first using the density of the gas phase at the previous stage then using an average of the densities of the gas phase at the previous and at the current stage. The density of the liquid is calculated to determine when the contact is reached. The temperature profile from previous survey provides the temperature at each stage. The well head, where conditions are known,
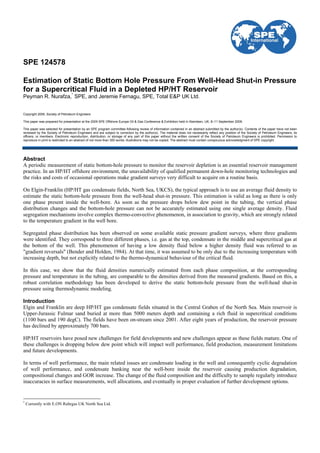
  • 10. 10 SPE 124578 is used as the initial stage. The operation is repeated until the contact is reached, and for this stage the iteration is done using, first the density of the vapour phase at the previous stage, then using a density averaged between the vapour phase at the previous stage and the liquid phase at the current stage. The second part of the methodology considers the liquid part of the fluid column and aims to determine the dew point depth or the pressure at reservoir depth if the depletion is such that no supercritical phase can be found in the well. The gas/liquid contact, where conditions are known from the first part of the procedure, is used as initial stage for this second part. During a first iteration the pressure at one stage is calculated using the density of the liquid phase at the previous stage. The temperature is still interpolated from the temperature profile. The pressure is calculated down to the bottom of the liquid column, dew point depth or reservoir depth. Once again field observations show that the fluid density just above the down limit of the liquid region should be used to compute the whole liquid phase pressure profile (Figure 5). The process is repeated using the density of liquid just above the bottom of the liquid column as an average density for the whole liquid column. A new depth for the dew point, or a new reservoir pressure, is found and the whole loop is repeated until convergence is reached. The third part of the methodology considers the supercritical part of the fluid column and aims to determine the pressure at reservoir depth. It is assumed that a third trend corresponding to supercritical fluid is present in the well and therefore that the reservoir depth has not been reached in the second part of the methodology. In this supercritical region there is no major difference between the measured gradient and the estimated densities. Therefore the density is initiated using the average of the density of fluid at the top of the supercritical region and the density of the vapour phase just above dew point depth, in order to estimate the pressure evolution in the lowest part of the well. If the dew point is reached in the tubing, and therefore if supercritical fluid is present in the tubing, the pressure at datum depth is known at the end of the third part of the methodology. If the dew point is reached in the reservoir, and therefore if there is no supercritical phase in the tubing, the third part of the methodology is not necessary. However, as liquid drops out in the reservoir, the composition of the fluid in the tubing is no more the initial one. A new series of iteration is to be performed, using new compositions which are calculated using PVT experiments, namely the Constant Volume Depletion experiment, and the pressure calculated at the previous step. Results and Discussions Two sets of correlations are shown in Figure 11 for one of the wells in the Elgin/Franklin fields. One of them is based on few steps when the second one uses more points. The results are compared with the actual measured data. As it can be seen, the results are within an acceptable range of around +/- 5 bars (less than 2% error). The pressure estimated using a single density approach is also shown and results in an error of more than 40 bars (i.e. more than 10% error). 0 -1000 Depth (mTVDSS) -2000 -3000 Correlation (Less Points) -4000 Correlation (More points) Measured -5000 Single Density -6000 100 150 200 250 300 350 400 Pressure (Bars) Figure 11: Comparison of the proposed correlation methodology for a well with two sets of temperature depths (with less and more data points) against the actual measured data and the result of single density approach
  • 11. SPE 124578 11 600 Single Density Less Points 500 Estimated More Points 400 300 200 200 300 400 500 600 Measured Figure 12: The estimated bottom-hole pressures (correlation with more/less points and single density) in bars at the well datum against their corresponding measured data for down-hole surveys in different wells. Figure 12 compares the results estimated using the correlation methodology and the single density for down-hole surveys in several different wells. It shows that the error related to the single density approach is increasing with depletion, while the proposed correlation in this paper gives a similar pressure estimate to the measured one. Besides it also shows that increasing the number of steps in the calculation makes it more robust, resulting a better estimate. Conclusion A segregated phase distribution has been observed on some available static pressure gradient surveys, where three gradients were identified. They correspond to three different phases, i.e. gas on the top, condensate in the middle and supercritical gas at the bottom of the well. This phenomenon of having a low density fluid below a higher density fluid is related to the thermo- dynamical behaviour of the supercritical fluid. We show that the fluid densities can be numerically estimated from each phase composition, at the corresponding pressure and temperature in the tubing, and the results are comparable to the densities derived from the measured gradients. Based on this, a correlation methodology has been developed to derive the static bottom-hole pressure from the well-head shut-in pressure using thermodynamic modeling. The pressures estimated using the proposed methodology match reasonably (less than 2% difference) the bottom-hole shut-in pressure observed during static surveys, whereas this error for a single density approach is very high (more than 10%) and increases with depletion. Nomenclature BHP = Bottom-Hole Pressure m = meters BHSIP = Bottom-Hole Shut-In Pressure P = Pressure CVD = Constant Volume Depletion PVT = Pressure, Volume and Temperature DegC = Degrees Centigrade ρ = Density EoS = Equation of State Rho. = Density g = Gravity (=9.8m/s2) T = Temperature GLR = Gas Liquid Ratio TVDSS = True Vertical Depth Sub-Sea GOR = Gas Oil Ratio UKCS = United Kingdom Continental Shelf h = Datum vertical depth from well head gauge Vap. = Vapour (phase) HP = High Pressure WHP = Well Head Pressure HT = High Temperature WHSIP = Well Head Shut-In Pressure i = Initial (Condition in the reservoir) Z’ = Compressibility Factor Liq. = Liquid
  • 12. 12 SPE 124578 Acknowledgements The authors would like to thank Francois-Jean Millancourt, Ole-Petter Hansen, Francois Montel, Gregory Joffroy and Glyn Waterhouse for their support, contributions and useful discussions, as well as the Elgin Franklin co-ventures (Total E&P UK, ENI UK Limited, BG Group, GDF SUEZ, EON Ruhrgas UK North Sea Limited, ExxonMobil, Chevron, Dyas, Oranje- Nassau) for their permission to present and publish this material. References Bender, C. V. and Holden, W. R.: “Static Pressure Gradient Reversals in Gas Wells”, SPE 13092 (1984). Cañas, J., Pop, J., Dubost, F. and Elshahawi, H.: “Advanced Compositional Gradient Analysis”, SPE 115429 (2008). Fair, C., Cook, B., Brighton, T., Redman, M. and Newman, S.: “Gas/Condensate and Oil Well Testing - From the Surface”, SPE 77701 (2002). Firoozabadi, A.: “Thermodynamics of Hydrocarbon Reservoirs”, Mc Graw Hill, 1999. McCain, W. D. Jr.: “The Properties of Petroleum Fluids”, PennWell, Second Edition, 1990. McCoy J. N., Podio, A. L., Rowlan, L. and Garrett M.: “Use of Acoustic Surveys for Field Calibration of Surface Readout BHP gages in ESP Installations”, SPE 37452 (1997). Podio, A. L., Weeks, S. G. and McCoy J. N.: “Low Cost Wellsite Determination of Bottom-hole Pressure from Acoustic Surveys in High Pressure Wells”, SPE 13254 (1984). Rzasa, M. J. and Katz, D. L.: “Calculation of Static Pressure Gradient in Gas Wells”, Trans., AIME, 160 (1945) 100-106. Waldman, N., Fair, C., Tyrrell, C. and Kumar, R.: “Subsea Well Testing at the Subsea Tree”, SPE 77626 (2002). Appendix A Single Average Density Approach: The single average density approach was used so far for the wells in the Elgin Franklin area. The approach assumes that a single density can represent the pressure gradient observed in the well. It uses one single density and the well datum depth (h, relevant to the well head gauge depth) to convert well head shut-in pressure (WHSIP) to bottom-hole. This assumption is true as long as the fluid pressure along the well is above the dew point and therefore represents a single phase with a single average density. It should be reminded that the normal practice in the field is that the well head shut-in pressure is normally recorded at the end of each well shut-in. The pressure is recorded with a gauge located just before the production wing valve on the wellhead, while this valve is closed and the down-hole safety valve (a few hundred meters below) is open. Then a first guess of the well fluid density is made based on a previous bottom-hole shut-in pressure or an estimate (P) and its corresponding compressibility factor (Z’), using the initial reservoir fluid data, i.e. its initial compressibility factor (Z’i) and density (ρi), as shown in Equation 1: Z i' P Equation 1: ρ = ρi ' Z Pi The first guess for density from the Equation 1, is then used along with the recorded well head shut-in pressure to estimate a first guess of the bottom-hole shut-in pressure (BHSIP), using the simple Equation 2: Equation 2: BHSIP = ρgh + WHSIP This pressure is then used to calculate its corresponding compressibility factor using simple interpolation within a table of the well fluid’s compressibility factors vs. pressure (derived from the field’s PVT model). This first guess bottom-hole shut-in pressure and its Z’ value is again used in the Equation 1 to recalculate a final guess for the density. This final density is then used to calculate the final bottom-hole shut-in pressure using the Equation 2.