SlideShare uma empresa Scribd logo
1 de 14
Baixar para ler offline
Acergy S.A. Announces First Quarter Results
London, England – April 15, 2009 – Acergy S.A. (NASDAQ-GS: ACGY; Oslo Stock Exchange: ACY),
announced today results for the first quarter which ended on February 28, 2009.

Highlights
   Revenue from continuing operations was $503 million (Q1 2008: $610 million) due to anticipated
-
   lower comparative activity levels in Acergy Africa & Mediterranean.
    Strong operating performance delivered an Adjusted EBITDA(a) margin from continuing operations of
-
    20.2% (Q1 2008: 18.4%).
    Strong balance sheet and cash position; $73 million net proceeds received following the completion of
-
    the sale of Acergy Piper.
    Progress on new major contracts:
-
        $250 million Angola LNG contract
    -
        SapuraAcergy joint venture awarded $825 million Gumusut-Kakap contract in Malaysia, post
    -
        quarter-end.


Jean Cahuzac, Chief Executive Officer, said:
“In the first quarter, we have delivered another solid performance in challenging conditions, translating
operational execution into sound margins and profits.

Despite caution about the short-term oil price, International and National Oil Companies have sought to
maintain activity levels across major developments and to postpone, rather than cancel, less strategic
and more marginal activities. With the industry aggressively focused on cost, we are working with clients
to conserve their cash wherever key variables, such as project scope, risk profile and procurement levels,
can be revised. Encouragingly, suppliers have started to grasp this imperative and are reducing prices of
plant, equipment and sub-contractor services.

Market visibility in 2009 will be poor and we are managing our internal costs appropriately. At this point
in the industry cycle we remain focused on delivering outstanding execution for clients, while also being
ready to strengthen and geographically re-orient our business for the upturn in the market when the
global economy emerges from recession.quot;

Financial Summary

                                                                   Three Months Ended
                                                                 Feb.28.09      Feb.29.08
    In $ millions, except share and per share data
                                                                 Unaudited      Unaudited

    Revenue from continuing operations                             503.1           609.7

    Gross profit                                                   114.8           136.2

    Net operating income from continuing operations                  71.3            86.4

                                                                     61.5            81.8
    Income before taxes from continuing operations

                                                                    (22.4)          (33.4)
    Taxation

    Income from continuing operations                                39.1            48.4

    Net income / (loss) from discontinued operations                  1.9            (7.3)

    Net income – total operations                                    41.0            41.1

    Per share data (Diluted)

    Earnings per share - continuing operations                      $0.19           $0.24
    Earnings / (loss) per share - discontinued operations           $0.01          ($0.04)
    Net earnings per share – total operations                       $0.20           $0.20
    Weighted-average no. of shares outstanding (in millions)       183.4           191.0


                                                 Page 1 of 14
Operating Review

Acergy Africa and Mediterranean – Revenue from continuing operations for the first quarter fell to
$228.0 million (Q1 2008: $359.5 million) due to lower activity levels and the planned dry-dock of the
Acergy Polaris. Good progress was made on Block 15, Tombua Landana and EPC2B, which completed
during the quarter, and PazFlor, which passed the 5% profit recognition threshold during the quarter.
Net operating income from continuing operations for the quarter was $37.0 million (Q1 2008: $57.5
million) due to lower activity levels and utilisation of assets.

Acergy Northern Europe and Canada – Revenue from continuing operations for the first quarter was
$138.1 million (Q1 2008: $128.0 million) reflecting good levels of SURF, IMR and survey activity. Good
operational progress was made on StatoilHydro Alve, Dong Nini, Deep Panuke and Tyrihans Subsea
Installation. Net operating income from continuing operations for the quarter was $1.5 million (Q1 2008:
$5.9 million), reflecting the $6.5 million charge for the cancellation of the Merlin charter and lower asset
utilisation during the quarter, offset by good project performance in a seasonally low period.

Acergy North America and Mexico – Revenue from continuing operations for the first quarter was
$4.3 million (Q1 2008: $0.6 million) with net operating income from continuing operations for the quarter
of $4.6 million (Q1 2008: $0.7 million) an improvement due to the contribution from the cross-regional
Frade Project which progressed well and good progress on the engineering phase of the Perdido Project.

Acergy South America – Revenue from continuing operations for the first quarter was $85.3 million (Q1
2008: $76.6 million) driven by strong revenue contribution from the Frade Project. The three ships on
long-term service agreements to Petrobras achieved high utilisation. Net operating income from
continuing operations for the quarter was $7.5 million (Q1 2008: $7.5 million) following good
performance on all activities.

Acergy Asia and Middle East – Revenue from continuing operations for the first quarter was $47.1
million (Q1 2008: $44.1 million) reflecting good progress on projects, including Van Gogh and Pluto,
which passed the 5% profit recognition threshold. Net operating income from continuing operations of
$12.6 million (Q1 2008: net operating loss of $2.7 million) reflected good project performance, including
project close-out on Dai Hung.

Discontinued operations
Net income from discontinued operations for the first quarter was $1.9 million (Q1 2008: net loss of $7.3
million) due to the positive contribution from the Mexilhao Trunkline Project.

Asset Development
In January 2009, the Acergy Piper was sold for net proceeds of $73 million. The Acergy Polaris
completed her planned dry-dock programme and recommenced work in West Africa in the second half of
the quarter.

The charter arrangement for the Merlin was cancelled in February. All charges, including a $6.5 million
settlement relating to the cancellation of the charter, have been recognised in Acergy Northern Europe
and Canada during the first quarter.

Financial Review

Revenue from continuing operations for the first quarter of 2009 was $503 million (Q1 2008: $610
million) reflecting lower activity levels in West Africa and the planned dry-dock of the Acergy Polaris
which were partially offset by good SURF and IMR activity levels in the North Sea and good SURF activity
levels in Brazil and Asia Pacific.

Gross profit was $115 million (Q1 2008: $136 million) reflecting the lower activity levels and fewer
projects in installation phase in AFMED, which were partially offset by good project execution and some
foreign exchange gains on trade balances during the quarter.

Administrative expenses were $53 million (Q1 2008: $60 million) reflecting a strengthened US dollar,
partially offset by higher tendering costs.

Acergy’s share of results from associates and joint ventures was broadly flat at $10 million (Q1 2008:
$11 million) reflecting a lower contribution from NKT Flexibles, partially offset by a good contribution
from Seaway Heavy Lifting and an improvement from the SapuraAcergy joint venture, which delivered a
small positive contribution in the quarter.


                                                 Page 2 of 14
The Adjusted EBITDA margin from continuing operations for the three months was 20.2% (Q1 2008:
18.4%). The Adjusted EBITDA margin from total operations for the three months was 20.0% (Q1 2008:
16.0%).

Income before taxes from continuing operations for the first quarter was $62 million (Q1 2008: $82
million) reflecting the lower activity levels in AFMED, which were partially offset by good project
execution and a good contribution from associates and joint ventures.

Taxation for the quarter was $22 million (Q1 2008: $33 million), reflecting an effective rate of 36% (Q1
2008: 41%).

Net income from continuing operations for the first quarter was $39 million (Q1 2008: $48 million). Net
income from total operations for the first quarter was $41 million (Q1 2008: $41 million).

The cash and cash equivalents position at the quarter end was $678 million (Q4 2008: $573 million).
Deferred revenue, at the quarter end stood at $272 million (Q4 2008: $306 million).

At quarter end, Acergy S.A. held directly 11,224,508 treasury shares representing 5.76% of the total
number of issued shares, as well as indirectly holding 879,121 treasury shares, representing 0.45% of
the total number of issued shares. Total shares in issue were 194,953,972, including these treasury
shares.

Backlog

Backlog for continuing operations as at February 28, 2009 was approximately $2.4 billion, of which $1.2
billion is expected to be executed in the remainder of fiscal year 2009. This backlog figure does not
include the backlog relating to associates and joint ventures.


                   In $ millions as at:                             Feb.28.09             Nov.30.08              Feb.29.08
                                                                      2,432                  2,511                  3,647
                               (1)
                   Backlog

                                                                         75                     149                    368
                                     (2)
                   Pre-Backlog
     (1) Backlog excludes amounts related to discontinued operations of Feb.28.09: $86 million, Nov.30.08: $114 million, Feb.29.08: $325 million
     (2) Pre-backlog reflects the stated value of letters of intent and the expected value of escalations on frame agreements


Current Trading and Outlook

Since the beginning of 2009, market conditions have become more challenging, characterised by sporadic
order flow and pricing pressure on new contracts. Reduced market visibility and the late award of
contracts make us more cautious in respect of our expectations.

For fiscal year 2009, we expect revenue to decrease to levels marginally lower than current consensus.
However, our Adjusted EBITDA margin will show some resilience as we deliver on the current order book.
Activity patterns in several regions will disrupt the typical annual profile of quarterly revenues and profits
and the third quarter may be weaker in comparison to the corresponding period in 2008.

Looking ahead, we are confident that our skills and strengths meet our clients' strategic needs,
particularly in the development of hydrocarbon discoveries secured in frontier acreage. As demand
improves, and with field depletion increasing, the need to access new reserves and replenish production
will return our markets to growth. We are well-placed, both financially and operationally, to exploit new
growth areas, such as Brazil, while recognising that other regions have an evolving significance for the
Group.


************************************************************************************
Acergy S.A. is a seabed-to-surface engineering and construction contractor to the offshore oil and gas industry
worldwide. We provide integrated services, and we plan, design and deliver complex projects in harsh and challenging
environments.

************************************************************************************


                                                                    Page 3 of 14
(a)
    Adjusted EBITDA: The Group calculates Adjusted EBITDA from continuing operations (adjusted earnings before interest,
income taxation, depreciation and amortisation) as net income from continuing operations plus finance costs, other gains and
losses, taxation, depreciation and amortisation and adjusted to exclude investment income and impairment of property, plant
and equipment. Adjusted EBITDA margin from continuing operations is defined as Adjusted EBITDA divided by revenue from
continuing operations. Management believes that Adjusted EBITDA and Adjusted EBITDA margin from continuing operations
are important indicators of our operational strength and the performance of our business. Adjusted EBITDA and Adjusted
EBITDA margin from continuing operations have not been prepared in accordance with International Financial Reporting
Standards (“IFRS”) as issued by the IASB nor as endorsed for use in the European Union. These non-IFRS measures provide
management with a meaningful comparison amongst our various regions, as they eliminate the effects of financing and
depreciation. Adjusted EBITDA margin from continuing operations may also be a useful ratio to compare our performance to
our competitors and is widely used by shareholders and analysts following the Group’s performance. However, Adjusted
EBITDA and Adjusted EBITDA margin from continuing operations as presented by the Group may not be comparable to
similarly titled measures reported by other companies. Such supplementary adjustments to EBITDA may not be in accordance
with current practices or the rules and regulations adopted by the US Securities and Exchange Commission (the “SEC”) that
apply to reports filed under the Securities Exchange Act of 1934. Accordingly, the SEC may require that Adjusted EBITDA and
Adjusted EBITDA margin from continuing operations be presented differently in filings made with the SEC than as presented in
this release, or not be presented at all. Adjusted EBITDA and Adjusted EBITDA margin from continuing operations are not
measures determined in accordance with IFRS and should not be considered as an alternative to, or more meaningful than,
net income (as determined in accordance with IFRS), as a measure of the Group’s operating results or cash flows from
operations (as determined in accordance with IFRS) or as a measure of the Group’s liquidity. The reconciliation of the Group’s
net income from continuing operations to Adjusted EBITDA from continuing operations is included in this release. This release
also includes a supplemental calculation of Adjusted EBITDA from continuing operations calculated as net operating income
from continuing operations, plus depreciation and amortisation and impairment charges on property, plant and equipment.
Management believes that this supplemental presentation of Adjusted EBITDA from continuing operations is also useful as it is
more in line with the presentation of similarly titled measures by companies within Acergy’s peer group and therefore believes
it to be a helpful calculation for those evaluating companies within Acergy’s industry. Adjusted EBITDA for discontinued
operations is calculated as per methodology outlined above. Adjusted EBITDA for total operations is the total of continuing
operations and discontinued operations.

Forward-Looking Statements: Certain statements made in this announcement may include “forward-looking statements”
within the meaning of Section 27A of the Securities Act and Section 21E of the US Securities Exchange Act of 1934. These
statements may be identified by the use of words like “anticipate,” “believe,” “estimate,” “expect,” “intend,” “may,” “plan,”
“forecast”, “project,” “will,” “should,” “seek,” and similar expressions. These statements include, but are not limited to,
statements as to the approximate value of the awarded contracts, the strength and geographical orientation of our business,
our projections of 2009, expectations regarding our backlog and pre-backlog and statements contained in the “Current Trading
and Outlook” section, including our expected revenues and Adjusted EBITDA margin in fiscal 2009, the impact of activity
patterns in several territories on our annual profile of quarterly revenues, our ability to exploit new growth areas, such as
Brazil, and statements as to management’s confidence that our market will return to growth and we are well suited to our
clients’ strategic needs. The forward-looking statements reflect our current views and assumptions and are subject to risks and
uncertainties. The following factors, and others which are discussed in our public filings and submissions with the U.S.
Securities and Exchange Commission, are among those that may cause actual and future results and trends to differ materially
from our forward-looking statements: our ability to recover costs on significant projects; the general economic conditions and
competition in the markets and businesses in which we operate; our relationship with significant clients; the outcome of legal
and administrative proceedings or governmental enquiries; uncertainties inherent in operating internationally; the timely
delivery of ships on order and the timely completion of ship conversion programmes; the impact of laws and regulations; and
operating hazards, including spills and environmental damage. Many of these factors are beyond our ability to control or
predict. Given these factors, you should not place undue reliance on the forward-looking statements.


                                                         Page 4 of 14
Conference Call Information                                      Replay Facility Details
Lines will open 30 minutes prior to conference call.             A replay facility will be available for the following period:

Date:      Wednesday April 15, 2009                              Date:     Wednesday April 15, 2009
Time:      3.00pm UK Time                                        Time:     4.30pm UK Time

                                                                 Date:      Tuesday April 21, 2009
Conference Dial In Numbers:
                                                                 Time:      4.30pm UK Time
UK Toll Free        : 0800 694 0257
USA Toll Free       : 1 866 966 9439
France              : 0805 632056                                Conference Replay Dial In Number:
Norway              : 800 19414
Netherlands         : 0800 023 5091                              International Dial In:         +44 (0) 1452 550 000
Germany             : 0800 101 4960
                                                                 Passcode: 93199548#
International Dial In:     +44 (0) 1452 561 394

Passcode: 93199548


 Alternatively, a live webcast and a playback facility will be available on our website www.acergy-group.com

 Contacts:
 Karen Menzel
 Acergy S.A.
 +44 (0)20 8210 5568
 karen.menzel@acergy-group.com
 www.acergy-group.com

 If you no longer wish to receive our press releases please contact: kelly.good@acergy-group.com


                                                         - End Text –

                                                       - Tables Follow -


                                                         Page 5 of 14
ACERGY S.A. AND SUBSIDIARIES
                      CONSOLIDATED INCOME STATEMENT
                   (In $ millions, except share and per share data)

                                                        Three Months Ended
                                                       February     February
                                                       28, 2009     29, 2008
                                                       Unaudited    Unaudited

Revenue from continuing operations                        503.1         609.7
Operating expenses                                       (388.3)       (473.5)
Gross profit                                              114.8         136.2

Administrative expenses                                    (53.3)       (59.7)
Net other operating income/(loss)                            0.1         (0.7)
Share of results of associates and joint ventures            9.7         10.6
Net operating income from continuing operations             71.3         86.4

Investment income                                            1.8          5.7
Other gains and losses                                      (1.9)        (1.1)
Finance costs                                               (9.7)        (9.2)
Income before taxes from continuing operations              61.5         81.8

Taxation                                                   (22.4)       (33.4)
Income from continuing operations                           39.1         48.4
Net income / (loss) from discontinued operations             1.9         (7.3)


Net income                                                  41.0         41.1


Net income attributable to:
Equity holders of parent                                    37.3         38.1
Minority interest                                            3.7          3.0
Net income                                                  41.0         41.1


PER SHARE DATA
Earnings / (loss) per share
             Basic:
             Continuing operations                          0.19          0.24
             Discontinued operations                        0.01         (0.04)
             Net earnings                                   0.20          0.20


             Diluted:
             Continuing operations                          0.19          0.24
             Discontinued operations                        0.01         (0.04)
             Net earnings                                   0.20          0.20

Weighted average number of Common Shares
And Common Share equivalents outstanding
           Basic                                           182.8        188.1
           Diluted                                         183.4        191.0

SELECTED INFORMATION - CONTINUING OPERATIONS
Cash outflows for capital expenditures                      56.5         41.4
Depreciation and amortisation                               30.5         26.0


                                       Page 6 of 14
ACERGY S.A. AND SUBSIDIARIES
                                                  CONSOLIDATED BALANCE SHEETS
                                                          (In $ millions)
                                                                                          As at                 As at               As at
                                                                                        February             November             February
                                                                                                             30, 2008(1)
                                                                                        28, 2009                                  29, 2008
                                                                                        Unaudited             Audited             Unaudited
 ASSETS
 Non-current assets
 Intangible assets                                                                               3.8                  3.8                 3.7
 Property, plant and equipment                                                               899.3                 907.6               828.7
 Interest in associates and joint ventures                                                   144.2                 140.2               128.7
 Advances and receivables and other non-current assets                                         48.5                 47.9                 60.9
 Deferred tax assets                                                                           39.8                 39.8                 61.5
 Total non-current assets                                                                  1,135.6              1,139.3              1,083.5

 Current assets
 Inventories                                                                                   38.0                 38.5                 33.5
                                   (2)
 Trade and other receivables                                                                 324.5                 354.5               466.5
 Other current assets                                                                          45.5                 56.8                 31.7
 Assets held for sale                                                                            1.1                75.5                  1.1
 Other accrued income and prepaid expenses                                                   237.0                 233.5               241.2
 Cash and cash equivalents                                                                   677.6                 573.0               649.8
 Total current assets                                                                      1,323.7              1,331.8              1,423.8
 Total assets                                                                              2,459.3              2,471.1              2,507.3

 EQUITY
 Capital and reserves attributable to equity holders
 Issued share capital                                                                        389.9                 389.9               389.9
 Own shares                                                                                (228.8)                (229.4)             (116.6)
 Paid in surplus                                                                             500.2                 498.7               494.3
 Equity reserve                                                                              110.7                 110.7               110.7
 Translation reserve                                                                        (85.4)                 (70.4)                35.5
 Other reserves                                                                             (80.9)                 (70.4)                (8.5)
 Retained earnings / (Accumulated deficit)                                                   195.5                 158.6                (52.0)
 Equity attributable to equity holders of the parent                                         801.2                 787.7               853.3
 Minority interest                                                                             17.2                 13.7                 21.4
 Total equity                                                                                818.4                 801.4               874.7

 LIABILITIES
 Non-current liabilities
 Non-current portion of borrowings                                                           413.0                 409.2               389.9
 Retirement benefit obligation                                                                 20.4                 21.2                 51.1
 Deferred tax liabilities                                                                      56.1                 56.1                 36.0
 Other non-current liabilities                                                                 69.9                 69.0                 43.1
 Total non-current liabilities                                                               559.4                 555.5               520.1

 Current liabilities
 Trade and other payables                                                                    620.9                 651.6               653.7
 Current tax liabilities                                                                     101.5                  69.1               167.8
 Current portion of borrowings                                                                   4.8                10.1                  4.0
 Other current liabilities                                                                     82.1                 77.8                 34.3
 Deferred revenue                                                                            272.2                 305.6               252.7
 Total current liabilities                                                                 1,081.5              1,114.2              1,112.5
 Total liabilities                                                                         1,640.9              1,669.7              1,632.6
 Total equity and liabilities                                                              2,459.3              2,471.1              2,507.3

(1) These figures have been extracted from the Audited Consolidated Financial Statements for 2008.
(2) As at February 28, 2009 a total of $nil million of claims not formally agreed with clients has been included in trade and other receivables. This
compares to $nil million and $11.0 million of claims included in trade and other receivables as at November 30, 2008 and February 29, 2008 respectively.

                                                                      Page 7 of 14
ACERGY S.A. AND SUBSIDIARIES
                      STATEMENT OF MOVEMENT OF RETAINED EARNINGS
                        FOR THREE MONTHS ENDED FEBRUARY 28, 2009
                                      (In $ millions)

                                                                                               158.6
                  Balance, November 30, 2008


                                                                                                 37.3
                  Net income for three months ended February 28, 2009


                                                                                                (0.4)
                  Loss on sale of own shares


                                                                                               195.5
                  Balance, February 28, 2009


                                   ACERGY S.A. AND SUBSIDIARIES
                                 EARNINGS PER SHARE CALCULATION
                              (In $ millions, except share and per share data)

                                                                          Three Months Ended
                                                                      February              February
                                                                      28, 2009              29, 2008
          Net income attributable to equity holders                           37.3                  38.1
          (Income) / loss from discontinued operations                        (1.9)                   7.3
          Net Income from continuing operations                               35.4                  45.4
          Interest expense on convertible note                                  7.3                   7.0
          Adjusted net income from continuing operations
          including convertible note                                          42.7                  52.4

          Weighted-average number of common shares:
          Basic number of shares                                     182,840,184           188,086,510

          Diluted number of shares                                  183,412,182           190,973,907
          Convertible note dilutive effect                            20,790,021            20,790,021
          Total diluted number of shares                             204,202,203           211,763,928

          BASIC
          Continuing operations                                             $0.19                 $0.24
          Discontinued operations                                            $0.01               $(0.04)
          Net Earnings / (loss)                                             $0.20                 $0.20

          DILUTED excluding convertible note
          Continuing operations                                             $0.19                 $0.24
          Discontinued operations                                           $0.01               $(0.04)
          Net Earnings / (loss)                                             $0.20                 $0.20

          DILUTED including convertible note
          Continuing operations                                              $0.21                 $0.25
          Discontinued operations                                            $0.01               $(0.04)
          Net Earnings / (loss)                                             $0.22                 $0.21

•   For the three months ended February 2009 and 2008 the effect of inclusion of the Convertible note would be to increase
    the diluted EPS from $0.20 to $0.22 (Q1 2008: $0.20 to $0.21). This is anti-dilutive and is therefore not included in the
    calculation.


                                                     Page 8 of 14
ACERGY S.A. AND SUBSIDIARIES
                                                  SEGMENTAL ANALYSIS
                                                      (In $ millions)
The Group has six reportable segments based on the geographic distribution of its activities as follows: the Acergy Africa and
Mediterranean segment (AFMED) covers activities in Africa and the Mediterranean; the Acergy Northern Europe and Canada segment
(NEC) includes all activities in Northern Europe and Eastern Canada; the Acergy North America and Mexico segment (NAMEX)
includes all activities in the United States, Mexico, Central America and Western Canada; the Acergy South America segment (SAM)
incorporates activities in South America and the islands of the southern Atlantic Ocean; the Acergy Asia and Middle East segment
(AME) includes all activities in Asia Pacific, India and the Middle East (excluding the Caspian Sea) and including the SapuraAcergy joint
venture. The Acergy Corporate segment (Corporate) includes all activities that serve more than one region. These include the
activities of the SHL and NKT joint ventures. Also included are assets which have global mobility including construction ships, ROVs
and other assets that are not attributed to any one segment; management of offshore personnel; captive insurance activities; and
Management and corporate services provided for the benefit of the whole Group, including design engineering, finance and legal
departments.

 Three months ended                 Acergy        Acergy        Acergy        Acergy       Acergy        Acergy          Total –
 February 28, 2009                  AFMED          NEC          NAMEX          SAM          AME         Corporate      Continuing
                                                                                                                       operations
 (In $ millions)
 Revenue(1)                            228.0         138.1            4.3         85.3         47.1             0.3           503.1
 Net operating income                   37.0           1.5            4.6          7.5         12.6             8.1            71.3
   Investment income                                                                                                            1.8
   Other gains & losses                                                                                                       (1.9)
   Finance costs                                                                                                              (9.7)
 Net income before taxation from continuing operations                                                                         61.5


 Three months ended                  Acergy       Acergy        Acergy        Acergy        Acergy       Acergy          Total –
 February 29, 2008                   AFMED         NEC          NAMEX          SAM           AME        Corporate       Continuing
                                                                                                                        operations
 (In $ millions)
 Revenue(1)                            359.5         128.0            0.6         76.6          44.1            0.9            609.7
 Net operating income/(loss)            57.5           5.9            0.7          7.5         (2.7)           17.5              86.4
    Investment income                                                                                                             5.7
    Other gains & losses                                                                                                        (1.1)
    Finance costs                                                                                                               (9.2)
     Net income before taxation from continuing operations                                                                       81.8


1.
      Three clients each individually accounted for more than 10% of the Group's revenue from continuing operations for the
      quarter ended February 28, 2009. The revenue from these clients was $226.8 million and was attributable to Acergy
      Africa and Mediterranean, Acergy Northern Europe and Canada and Acergy South America. Two clients each individually
      accounted for more than 10% of our revenue from continuing operations for the quarter ended February 29, 2008. The
      revenue from these clients was $267.8 million and was attributable to Acergy Africa and Mediterranean, Acergy Northern
      Europe and Canada and Acergy South America.


                                                              Page 9 of 14
ACERGY S.A. AND SUBSIDIARIES
                             RECONCILIATION OF NET OPERATING INCOME
                                        TO ADJUSTED EBITDA
                                   (In $ millions, except percentages)

                                   Three Months Ended                                        Three Months Ended
                                        February     February
                           February                                               February        February       February
                                        28, 2009     28, 2009
                           28, 2009                                               29, 2008        29, 2008       29, 2008
                                                       Total                                                       Total
                          Continuing Discontinued                                 Continuing    Discontinued
                                                    Operations                                                  Operations

Net operating income          71.3                   5.4            76.7                86.4          (12.9)          73.5

Depreciation and
                              30.5                    -             30.5                26.0             2.0          28.0
amortisation

Impairments                       -                   -                   -                  -             -             -


Adjusted EBITDA              101.8                   5.4           107.2               112.4          (10.9)         101.5


Revenue                      503.1                 32.3            535.4               609.7            26.2         635.9


Adjusted EBITDA %           20.2%                16.7%           20.0%                18.4%          (41.6%)        16.0%


                                          ACERGY S.A. AND SUBSIDIARIES
                                          RECONCILIATION OF NET INCOME
                                                 TO ADJUSTED EBITDA
                                           (In $ millions, except percentages)


                                    Three Months Ended                                        Three Months Ended
                            February     February     February                      February       February       February
                            28, 2009     28, 2009     28, 2009                      29, 2008       29, 2008       29, 2008
                                                        Total                                                       Total
                           Continuing Discontinued                                 Continuing    Discontinued
                                                     Operations                                                  Operations

 Net income                     39.1                  1.9             41.0                48.4           (7.3)          41.1

 Depreciation and
                                30.5                        -         30.5                26.0             2.0          28.0
 amortisation
 Impairments                          -                     -                 -                  -             -             -
 Investment income             (1.8)                        -        (1.8)               (5.7)                 -       (5.7)
 Other gains and losses          1.9                  2.5                 4.4                1.1         (1.1)               -
 Finance costs                   9.7                        -             9.7                9.2               -         9.2
 Taxation                       22.4                  1.0             23.4                33.4           (4.5)          28.9


 Adjusted EBITDA               101.8                  5.4           107.2               112.4           (10.9)        101.5


 Revenue                       503.1                 32.3           535.4               609.7             26.2        635.9


 Adjusted EBITDA %            20.2%                16.7%           20.0%                18.4%         (41.6%)         16.0%


                                                          Page 10 of 14
APPENDIX:
                               2008 QUARTERLY RESULTS RE-PRESENTED
                               TO REFLECT DISCONTINUED OPERATIONS

                                             ACERGY S.A. AND SUBSIDIARIES
                                          CONSOLIDATED INCOME STATEMENT
                                       (In $ millions, except share and per share data)

                                                                                                                 Twelve
                                                                         Three Months Ended                      Months
                                                                                                                 Ended
                                                           February        May         August       November    November
                                                           29, 2008      31, 2008     31, 2008      30, 2008    30, 2008

                                                                                            639.2       567.9     2,522.4
Revenue from continuing operations                            609.7         705.6
                                                                                          (453.6)     (423.0)   (1,874.2)
Operating expenses                                           (473.5)       (524.1)
                                                                                            185.6       144.9       648.2
Gross profit                                                  136.2         181.5

                                                                                           (63.9)      (68.3)     (253.8)
Administrative expenses                                        (59.7)       (61.9)
                                                                                                -         0.1         3.4
Net other operating income/(loss)                               (0.7)         4.0
                                                                                             12.8        26.0        63.0
Share of results of associates and joint ventures               10.6         13.6
                                                                                            134.5       102.7       460.8
Net operating income from continuing operations                 86.4        137.2

                                                                                              5.0         4.3        17.9
Investment income                                               5.7           2.9
                                                                                             14.4        34.9        44.1
Other gains and losses                                         (1.1)         (4.1)
                                                                                            (9.9)       (6.2)      (30.5)
Finance costs                                                  (9.2)         (5.2)
                                                                                           144.0       135.7        492.3
Income before taxes from continuing operations                 81.8         130.8

                                                                                           (42.8)      (45.8)     (162.6)
Taxation                                                       (33.4)       (40.6)
                                                                                            101.2        89.9       329.7
Income from continuing operations                               48.4         90.2
                                                                                             11.7         1.5      (22.5)
Net income / (loss) from discontinued operations                (7.3)       (28.4)


Net income                                                     41.1          61.8          112.9        91.4       307.2

Net income attributable to:
                                                                                           112.3        85.3       301.4
Equity holders of parent                                        38.1          65.7
                                                                                             0.6         6.1         5.8
Minority interests                                               3.0         (3.9)
Net income                                                      41.1         61.8          112.9        91.4       307.2


PER SHARE DATA
Earnings / (loss) per share

             Basic:
                                                                                            0.55        0.46        1.76
             Continuing operations                              0.24         0.51
             Discontinued operations                          (0.04)        (0.15)          0.06        0.01       (0.12)
             Net earnings                                       0.20         0.36           0.61        0.47        1.64

             Diluted:
                                                                                            0.52        0.45        1.70
             Continuing operations                              0.24         0.49
             Discontinued operations                          (0.04)        (0.14)          0.06        0.01       (0.11)
             Net earnings                                       0.20         0.35           0.58        0.46        1.59

Weighted average number of Common Shares
And Common Share equivalents outstanding
                                                                                           182.5       182.8       184.1
           Basic                                               188.1         183.2
                                                                                           205.5       204.3       207.1
           Diluted                                             191.0         207.1

SELECTED INFORMATION - CONTINUING OPERATIONS
                                                                                            76.8       101.0       292.9
Cash outflows for capital expenditures                          41.4          73.7
                                                                                            27.8        30.6       110.4
Depreciation and amortisation                                   26.0          26.0
                                                                                               -         1.8         1.8
Impairment                                                       -             -

                                                         Page 11 of 14
ACERGY S.A. AND SUBSIDIARIES
                                             SEGMENTAL ANALYSIS
                                                 (In $ millions)

Three months ended              Acergy      Acergy         Acergy        Acergy     Acergy     Acergy      Total –
February 29, 2008               AFMED        NEC           NAMEX          SAM        AME      Corporate   Continuing
                                                                                                          operations
(In $ millions)
Revenue                           359.5        128.0             0.6        76.6       44.1         0.9        609.7
Net operating income/(loss)        57.5          5.9             0.7         7.5      (2.7)        17.5          86.4
   Investment income                                                                                              5.7
   Other gains & losses                                                                                         (1.1)
   Finance costs                                                                                                (9.2)
Net income before taxation from continuing operations                                                            81.8


Three months ended              Acergy      Acergy         Acergy        Acergy     Acergy     Acergy      Total –
May 31, 2008                    AFMED        NEC           NAMEX          SAM        AME      Corporate   Continuing
                                                                                                          operations
(In $ millions)
Revenue                           375.3        210.3             0.9        75.3       43.2         0.6        705.6
Net operating income/(loss)        82.7         32.4             5.6        11.2        8.2       (2.9)        137.2
   Investment income                                                                                              2.9
   Other gains & losses                                                                                         (4.1)
   Finance costs                                                                                                (5.2)
Net income before taxation from continuing operations                                                          130.8


Three months ended              Acergy      Acergy         Acergy        Acergy     Acergy     Acergy      Total –
August 30, 2008                 AFMED        NEC           NAMEX          SAM        AME      Corporate   Continuing
                                                                                                          operations
(In $ millions)
Revenue                           233.4        278.7             1.1         77.3      48.5         0.2        639.2
Net operating income/(loss)        20.7         88.3             0.3        (3.5)       6.8        21.9        134.5
   Investment income                                                                                              5.0
   Other gains & losses                                                                                          14.4
   Finance costs                                                                                                (9.9)
Net income before taxation from continuing operations                                                          144.0


Three months ended              Acergy      Acergy         Acergy        Acergy     Acergy     Acergy      Total –
November 30, 2008               AFMED        NEC           NAMEX          SAM        AME      Corporate   Continuing
                                                                                                          operations
(In $ millions)
Revenue                           207.7        226.1             1.8        90.9       45.0       (3.6)        567.9
Net operating income               22.8         65.4             3.9         7.4        2.1         1.1        102.7
   Investment income                                                                                              4.3
   Other gains & losses                                                                                          34.9
   Finance costs                                                                                                (6.2)
Net income before taxation from continuing operations                                                          135.7


Twelve months ended             Acergy      Acergy         Acergy        Acergy     Acergy     Acergy      Total –
November 30, 2008               AFMED        NEC           NAMEX          SAM        AME      Corporate   Continuing
                                                                                                          operations
(In $ millions)
Revenue                          1,175.9       843.1             4.4       320.1      180.8       (1.9)       2,522.4
Net operating income               183.7       192.0            10.5        22.6       14.4        37.6         460.8
   Investment income                                                                                             17.9
   Other gains & losses                                                                                          44.1
   Finance costs                                                                                               (30.5)
 Net income before taxation from continuing operations                                                          492.3


                                                         Page 12 of 14
ACERGY S.A. AND SUBSIDIARIES
                          RECONCILIATION OF NET OPERATING INCOME
                                     TO ADJUSTED EBITDA
                                (In $ millions, except percentages)

                                  Three Months Ended                              Three Months Ended
                       February        February       February           May             May            May
                       29, 2008        29, 2008       29, 2008         31, 2008        31, 2008       31, 2008
                                                        Total                                           Total
                       Continuing    Discontinued                      Continuing    Discontinued
                                                     Operations                                      Operations


Net operating income        86.4           (12.9)             73.5          137.2          (31.3)         105.9

Depreciation and
                            26.0              2.0             28.0           26.0             2.0          28.0
amortisation
Impairments                    -               -                   -              -              -            -


Adjusted EBITDA            112.4           (10.9)           101.5           163.2          (29.3)         133.9
Revenue                    609.7             26.2           635.9           705.6            36.8         742.4
Adjusted EBITDA %         18.4%          (41.6%)           16.0%           23.1%         (79.6%)         18.0%


                                  Three Months Ended                              Three Months Ended
                        August          August         August          November      November 30,    November
                       31, 2008        31, 2008       31, 2008         30, 2008          2008         30, 2008
                                                        Total                                           Total
                       Continuing    Discontinued                      Continuing    Discontinued
                                                     Operations                                      Operations


Net operating income       134.5             18.2           152.7           102.7             3.5         106.2

Depreciation and
                            27.8              2.0             29.8           30.6             2.0          32.6
amortisation
Impairments                    -               -                   -          1.8          (13.3)        (11.5)


Adjusted EBITDA            162.3             20.2           182.5           135.1            (7.8)        127.3
Revenue                    639.2            114.1           753.3           567.9           104.7         672.6
Adjusted EBITDA %         25.4%            17.7%           24.2%           23.8%           (7.4%)        18.9%


                                 Twelve Months Ended
                       November     November 30,     November
                       30, 2008          2008        30, 2008
                                                       Total
                       Continuing    Discontinued
                                                    Operations


Net operating income        460.8          (22.5)             438.3

Depreciation and
                            110.4             8.0             118.4
amortisation
Impairments                   1.8          (13.3)            (11.5)


Adjusted EBITDA             573.0          (27.8)             545.2
Revenue                   2,522.4           281.8          2,804.2
Adjusted EBITDA %          22.7%           (9.9%)            19.4%


                                                   Page 13 of 14
ACERGY S.A. AND SUBSIDIARIES
                                     RECONCILIATION OF NET INCOME
                                            TO ADJUSTED EBITDA
                                      (In $ millions, except percentages)

                                    Three Months Ended                              Three Months Ended
                         February        February       February           May             May            May
                         29, 2008        29, 2008       29, 2008         31, 2008        31, 2008       31, 2008
                                                          Total                                           Total
                         Continuing    Discontinued                      Continuing    Discontinued
                                                       Operations                                      Operations


Net income                    48.4              (7.3)          41.1            90.2          (28.4)          61.8
Depreciation and
                              26.0               2.0           28.0            26.0             2.0          28.0
amortisation
Impairments                      -                  -               -               -              -            -
Investment income            (5.7)                  -          (5.7)          (2.9)                -        (2.9)
Other gains and losses         1.1              (1.1)               -           4.1            (0.1)          4.0
Finance costs                  9.2                  -             9.2           5.2                -          5.2
Taxation                      33.4              (4.5)          28.9            40.6            (2.8)         37.8
Adjusted EBITDA              112.4             (10.9)         101.5           163.2          (29.3)         133.9
Revenue                      609.7              26.2          635.9           705.6            36.8         742.4
Adjusted EBITDA %           18.4%            (41.6%)          16.0%          23.1%         (79.6%)         18.0%

                                    Three Months Ended                              Three Months Ended
                          August          August         August          November      November 30,    November
                         31, 2008        31, 2008       31, 2008         30, 2008          2008         30, 2008
                                                          Total                                           Total
                         Continuing    Discontinued                      Continuing    Discontinued
                                                       Operations                                      Operations


Net income                   101.2              11.7          112.9            89.9             1.5          91.4
Depreciation and
                              27.8               2.0           29.8            30.6             2.0          32.6
amortisation
Impairments                      -                  -               -           1.8          (13.3)        (11.5)
Investment income            (5.0)                  -          (5.0)          (4.3)                -        (4.3)
Other gains and losses      (14.4)               0.6          (13.8)         (34.9)             1.7        (33.2)
Finance costs                  9.9                  -             9.9           6.2             1.0           7.2
Taxation                      42.8               5.9           48.7            45.8            (0.7)         45.1
Adjusted EBITDA              162.3              20.2          182.5           135.1            (7.8)        127.3
Revenue                      639.2             114.1          753.3           567.9           104.7         672.6
Adjusted EBITDA %           25.4%             17.7%           24.2%          23.8%           (7.4%)        18.9%

                                   Twelve Months Ended
                         November     November 30,     November
                         30, 2008          2008        30, 2008
                                                         Total
                         Continuing    Discontinued
                                                      Operations


Net income                    329.7            (22.5)          307.2
Depreciation and
                              110.4              8.0           118.4
amortisation
Impairments                     1.8            (13.3)          (11.5)
Investment income            (17.9)                 -          (17.9)
Other gains and losses       (44.1)              1.1           (43.0)
Finance costs                  30.5              1.0              31.5
Taxation                      162.6             (2.1)          160.5
Adjusted EBITDA               573.0            (27.8)          545.2
Revenue                     2,522.4            281.8          2,804.2
Adjusted EBITDA %            22.7%            (9.9%)           19.4%

                                                    - End -


                                                  Page 14 of 14

Mais conteúdo relacionado

Mais procurados

pepsi bottling library.corporate
  	 pepsi bottling library.corporate  	 pepsi bottling library.corporate
pepsi bottling library.corporatefinance19
 
duke energy 2Q 07_RegG
duke energy 2Q 07_RegGduke energy 2Q 07_RegG
duke energy 2Q 07_RegGfinance21
 
Electrolux Interim Report Q3 2011
Electrolux Interim Report Q3 2011  Electrolux Interim Report Q3 2011
Electrolux Interim Report Q3 2011 Electrolux Group
 
goodrich 1Q08slides
goodrich  1Q08slidesgoodrich  1Q08slides
goodrich 1Q08slidesfinance44
 
duke energy 1Q 07_RegG
duke energy 1Q 07_RegGduke energy 1Q 07_RegG
duke energy 1Q 07_RegGfinance21
 
Electrolux Consolidated results 2011
Electrolux Consolidated results 2011Electrolux Consolidated results 2011
Electrolux Consolidated results 2011Electrolux Group
 
Vodaphone 2008 Half-Yearly Results
Vodaphone 2008 Half-Yearly ResultsVodaphone 2008 Half-Yearly Results
Vodaphone 2008 Half-Yearly Resultsearningsreport
 
Conference call presentation 2 q10 results
Conference call presentation 2 q10 resultsConference call presentation 2 q10 results
Conference call presentation 2 q10 resultsOgx2011
 
spectra energy 1Q08SEEarningsReview
spectra energy 1Q08SEEarningsReviewspectra energy 1Q08SEEarningsReview
spectra energy 1Q08SEEarningsReviewfinance49
 
spectra energy 2Q_2007_SpectraEnergyEarnings
spectra energy 2Q_2007_SpectraEnergyEarningsspectra energy 2Q_2007_SpectraEnergyEarnings
spectra energy 2Q_2007_SpectraEnergyEarningsfinance49
 
AES 4Q 07 Review
AES 4Q 07 ReviewAES 4Q 07 Review
AES 4Q 07 Reviewfinance19
 
tribune earnings_q4_07_tables
tribune earnings_q4_07_tablestribune earnings_q4_07_tables
tribune earnings_q4_07_tablesfinance47
 

Mais procurados (16)

pepsi bottling library.corporate
  	 pepsi bottling library.corporate  	 pepsi bottling library.corporate
pepsi bottling library.corporate
 
duke energy 2Q 07_RegG
duke energy 2Q 07_RegGduke energy 2Q 07_RegG
duke energy 2Q 07_RegG
 
Electrolux Interim Report Q3 2011
Electrolux Interim Report Q3 2011  Electrolux Interim Report Q3 2011
Electrolux Interim Report Q3 2011
 
goodrich 1Q08slides
goodrich  1Q08slidesgoodrich  1Q08slides
goodrich 1Q08slides
 
duke energy 1Q 07_RegG
duke energy 1Q 07_RegGduke energy 1Q 07_RegG
duke energy 1Q 07_RegG
 
Electrolux Consolidated results 2011
Electrolux Consolidated results 2011Electrolux Consolidated results 2011
Electrolux Consolidated results 2011
 
ford 2007 Q3 Financial Result
ford 2007 Q3 Financial Resultford 2007 Q3 Financial Result
ford 2007 Q3 Financial Result
 
Vodaphone 2008 Half-Yearly Results
Vodaphone 2008 Half-Yearly ResultsVodaphone 2008 Half-Yearly Results
Vodaphone 2008 Half-Yearly Results
 
ford 2007 Q4 and Full Year Financial Result
ford 2007 Q4 and Full Year Financial Resultford 2007 Q4 and Full Year Financial Result
ford 2007 Q4 and Full Year Financial Result
 
Conference call presentation 2 q10 results
Conference call presentation 2 q10 resultsConference call presentation 2 q10 results
Conference call presentation 2 q10 results
 
spectra energy 1Q08SEEarningsReview
spectra energy 1Q08SEEarningsReviewspectra energy 1Q08SEEarningsReview
spectra energy 1Q08SEEarningsReview
 
spectra energy 2Q_2007_SpectraEnergyEarnings
spectra energy 2Q_2007_SpectraEnergyEarningsspectra energy 2Q_2007_SpectraEnergyEarnings
spectra energy 2Q_2007_SpectraEnergyEarnings
 
.credit Presentation slidessuiss
.credit Presentation slidessuiss.credit Presentation slidessuiss
.credit Presentation slidessuiss
 
AES 4Q 07 Review
AES 4Q 07 ReviewAES 4Q 07 Review
AES 4Q 07 Review
 
China Ting FY2014
China Ting FY2014China Ting FY2014
China Ting FY2014
 
tribune earnings_q4_07_tables
tribune earnings_q4_07_tablestribune earnings_q4_07_tables
tribune earnings_q4_07_tables
 

Destaque

Q1 2009 Earning Report of Selective Insurance Group, Inc.
Q1 2009 Earning Report of Selective Insurance Group, Inc.Q1 2009 Earning Report of Selective Insurance Group, Inc.
Q1 2009 Earning Report of Selective Insurance Group, Inc.earningreport earningreport
 
Q1 2009 Earning Report of Travelers Companies Inc.
Q1 2009 Earning Report of Travelers Companies Inc.Q1 2009 Earning Report of Travelers Companies Inc.
Q1 2009 Earning Report of Travelers Companies Inc.earningreport earningreport
 
201005 Debian/つくらぐ勉強会 lightning talk
201005 Debian/つくらぐ勉強会 lightning talk 201005 Debian/つくらぐ勉強会 lightning talk
201005 Debian/つくらぐ勉強会 lightning talk Hideki Yamane
 

Destaque (7)

Q1 2009 Earning Report of Selective Insurance Group, Inc.
Q1 2009 Earning Report of Selective Insurance Group, Inc.Q1 2009 Earning Report of Selective Insurance Group, Inc.
Q1 2009 Earning Report of Selective Insurance Group, Inc.
 
Q1 2009 Earning Report of Travelers Companies Inc.
Q1 2009 Earning Report of Travelers Companies Inc.Q1 2009 Earning Report of Travelers Companies Inc.
Q1 2009 Earning Report of Travelers Companies Inc.
 
201005 Debian/つくらぐ勉強会 lightning talk
201005 Debian/つくらぐ勉強会 lightning talk 201005 Debian/つくらぐ勉強会 lightning talk
201005 Debian/つくらぐ勉強会 lightning talk
 
Q1 2009 Earning Report of Vascular Solution
Q1 2009 Earning Report of Vascular SolutionQ1 2009 Earning Report of Vascular Solution
Q1 2009 Earning Report of Vascular Solution
 
Q1 2009 Earning Report of Ce Franklin Ltd.
Q1 2009 Earning Report of Ce Franklin Ltd.Q1 2009 Earning Report of Ce Franklin Ltd.
Q1 2009 Earning Report of Ce Franklin Ltd.
 
Q1 2009 Earning Report of Stamps Com
Q1 2009 Earning Report of Stamps ComQ1 2009 Earning Report of Stamps Com
Q1 2009 Earning Report of Stamps Com
 
Q1 2009 Earning Report of Tyco Electronics Ltd.
Q1 2009 Earning Report of Tyco Electronics Ltd.Q1 2009 Earning Report of Tyco Electronics Ltd.
Q1 2009 Earning Report of Tyco Electronics Ltd.
 

Semelhante a Acergy Q1 Results Show Solid Performance

SKF First-quarter report 2009
SKF First-quarter report 2009SKF First-quarter report 2009
SKF First-quarter report 2009SKF
 
Q1 2009 eng
Q1 2009 engQ1 2009 eng
Q1 2009 engSKF
 
Electrolux Interim Report Q4 2009
Electrolux Interim Report Q4 2009Electrolux Interim Report Q4 2009
Electrolux Interim Report Q4 2009Electrolux Group
 
goodrich 3Q06
goodrich  3Q06goodrich  3Q06
goodrich 3Q06finance44
 
goodrich 3Q06
goodrich  3Q06goodrich  3Q06
goodrich 3Q06finance44
 
Q4 2008 Earnings Press Release and Financial Tables
Q4 2008 Earnings Press Release and Financial TablesQ4 2008 Earnings Press Release and Financial Tables
Q4 2008 Earnings Press Release and Financial Tablesfinance7
 
motorola Q4 2008 Earnings Press Release and Financial Tables
motorola Q4 2008 Earnings Press Release and Financial Tablesmotorola Q4 2008 Earnings Press Release and Financial Tables
motorola Q4 2008 Earnings Press Release and Financial Tablesfinance7
 
goodrich 1Q08slides
goodrich  1Q08slidesgoodrich  1Q08slides
goodrich 1Q08slidesfinance44
 
raytheon Q4 Earnings Presentation
raytheon Q4 Earnings Presentationraytheon Q4 Earnings Presentation
raytheon Q4 Earnings Presentationfinance12
 
raytheon Q4 Earnings Presentation
raytheon Q4 Earnings Presentationraytheon Q4 Earnings Presentation
raytheon Q4 Earnings Presentationfinance12
 
Release ifrs us 3 q11 final
Release ifrs us 3 q11 finalRelease ifrs us 3 q11 final
Release ifrs us 3 q11 finalEmbraer RI
 
Q1 2009 Earning Report of Baldor Electric Company
Q1 2009 Earning Report of Baldor Electric Company Q1 2009 Earning Report of Baldor Electric Company
Q1 2009 Earning Report of Baldor Electric Company earningreport earningreport
 
northrop grumman Q3 08 Earnings Presentation
northrop grumman	Q3 08 Earnings Presentationnorthrop grumman	Q3 08 Earnings Presentation
northrop grumman Q3 08 Earnings Presentationfinance8
 
northrop grumman Slide Presentation 2008 3rd
northrop grumman  Slide Presentation 2008 3rdnorthrop grumman  Slide Presentation 2008 3rd
northrop grumman Slide Presentation 2008 3rdfinance8
 
northrop grumman Slide Presentation 2007 3rd
northrop grumman  Slide Presentation 2007 3rdnorthrop grumman  Slide Presentation 2007 3rd
northrop grumman Slide Presentation 2007 3rdfinance8
 
raytheon Q4 Earnings Presentation
raytheon Q4 Earnings Presentationraytheon Q4 Earnings Presentation
raytheon Q4 Earnings Presentationfinance12
 
Release Results IFRS US 3Q12
Release Results IFRS US 3Q12Release Results IFRS US 3Q12
Release Results IFRS US 3Q12Embraer RI
 

Semelhante a Acergy Q1 Results Show Solid Performance (20)

Q3 2009 Earning Report of Acergy S.A.
Q3 2009 Earning Report of Acergy S.A.Q3 2009 Earning Report of Acergy S.A.
Q3 2009 Earning Report of Acergy S.A.
 
Q1 2009 Earning Report of SKF AB
Q1 2009 Earning Report of SKF ABQ1 2009 Earning Report of SKF AB
Q1 2009 Earning Report of SKF AB
 
SKF First-quarter report 2009
SKF First-quarter report 2009SKF First-quarter report 2009
SKF First-quarter report 2009
 
Q1 2009 eng
Q1 2009 engQ1 2009 eng
Q1 2009 eng
 
Electrolux Interim Report Q4 2009
Electrolux Interim Report Q4 2009Electrolux Interim Report Q4 2009
Electrolux Interim Report Q4 2009
 
goodrich 3Q06
goodrich  3Q06goodrich  3Q06
goodrich 3Q06
 
goodrich 3Q06
goodrich  3Q06goodrich  3Q06
goodrich 3Q06
 
Q1 2009 Earning Report of Intersil Corp.
Q1 2009 Earning Report of Intersil Corp.Q1 2009 Earning Report of Intersil Corp.
Q1 2009 Earning Report of Intersil Corp.
 
Q4 2008 Earnings Press Release and Financial Tables
Q4 2008 Earnings Press Release and Financial TablesQ4 2008 Earnings Press Release and Financial Tables
Q4 2008 Earnings Press Release and Financial Tables
 
motorola Q4 2008 Earnings Press Release and Financial Tables
motorola Q4 2008 Earnings Press Release and Financial Tablesmotorola Q4 2008 Earnings Press Release and Financial Tables
motorola Q4 2008 Earnings Press Release and Financial Tables
 
goodrich 1Q08slides
goodrich  1Q08slidesgoodrich  1Q08slides
goodrich 1Q08slides
 
raytheon Q4 Earnings Presentation
raytheon Q4 Earnings Presentationraytheon Q4 Earnings Presentation
raytheon Q4 Earnings Presentation
 
raytheon Q4 Earnings Presentation
raytheon Q4 Earnings Presentationraytheon Q4 Earnings Presentation
raytheon Q4 Earnings Presentation
 
Release ifrs us 3 q11 final
Release ifrs us 3 q11 finalRelease ifrs us 3 q11 final
Release ifrs us 3 q11 final
 
Q1 2009 Earning Report of Baldor Electric Company
Q1 2009 Earning Report of Baldor Electric Company Q1 2009 Earning Report of Baldor Electric Company
Q1 2009 Earning Report of Baldor Electric Company
 
northrop grumman Q3 08 Earnings Presentation
northrop grumman	Q3 08 Earnings Presentationnorthrop grumman	Q3 08 Earnings Presentation
northrop grumman Q3 08 Earnings Presentation
 
northrop grumman Slide Presentation 2008 3rd
northrop grumman  Slide Presentation 2008 3rdnorthrop grumman  Slide Presentation 2008 3rd
northrop grumman Slide Presentation 2008 3rd
 
northrop grumman Slide Presentation 2007 3rd
northrop grumman  Slide Presentation 2007 3rdnorthrop grumman  Slide Presentation 2007 3rd
northrop grumman Slide Presentation 2007 3rd
 
raytheon Q4 Earnings Presentation
raytheon Q4 Earnings Presentationraytheon Q4 Earnings Presentation
raytheon Q4 Earnings Presentation
 
Release Results IFRS US 3Q12
Release Results IFRS US 3Q12Release Results IFRS US 3Q12
Release Results IFRS US 3Q12
 

Mais de earningreport earningreport

Q3 2009 Earning Report of Boston Scientific Corporation
Q3 2009 Earning Report of Boston Scientific CorporationQ3 2009 Earning Report of Boston Scientific Corporation
Q3 2009 Earning Report of Boston Scientific Corporationearningreport earningreport
 
Q3 2009 Earning Report of Boston Scientific Corporation
Q3 2009 Earning Report of Boston Scientific CorporationQ3 2009 Earning Report of Boston Scientific Corporation
Q3 2009 Earning Report of Boston Scientific Corporationearningreport earningreport
 
Q3 2009 Earning Report of Atheros Communications, Inc.
Q3 2009 Earning Report of Atheros Communications, Inc.Q3 2009 Earning Report of Atheros Communications, Inc.
Q3 2009 Earning Report of Atheros Communications, Inc.earningreport earningreport
 
Q3 2009 Earning Report of Hancock Holding Company
Q3 2009 Earning Report of Hancock Holding CompanyQ3 2009 Earning Report of Hancock Holding Company
Q3 2009 Earning Report of Hancock Holding Companyearningreport earningreport
 
Q3 2009 Earning Report of Infosys Technologies Ltd.
Q3 2009 Earning Report of Infosys Technologies Ltd.Q3 2009 Earning Report of Infosys Technologies Ltd.
Q3 2009 Earning Report of Infosys Technologies Ltd.earningreport earningreport
 
Q3 2009 Earning Report of Marriott International
Q3 2009 Earning Report of Marriott InternationalQ3 2009 Earning Report of Marriott International
Q3 2009 Earning Report of Marriott Internationalearningreport earningreport
 
Q3 2009 Earning Report of Worthington Industries, Inc.
Q3 2009 Earning Report of Worthington Industries, Inc.Q3 2009 Earning Report of Worthington Industries, Inc.
Q3 2009 Earning Report of Worthington Industries, Inc.earningreport earningreport
 

Mais de earningreport earningreport (20)

Q3 2009 Earning Report of Banco Santander S.A.
Q3 2009 Earning Report of Banco Santander S.A.Q3 2009 Earning Report of Banco Santander S.A.
Q3 2009 Earning Report of Banco Santander S.A.
 
Q3 Earning report of Daimler AG
Q3 Earning report of Daimler AGQ3 Earning report of Daimler AG
Q3 Earning report of Daimler AG
 
Q3 Earning Report of BB&T Corporation
Q3 Earning Report of BB&T CorporationQ3 Earning Report of BB&T Corporation
Q3 Earning Report of BB&T Corporation
 
Q3 Earning Report of BB&T Corporation
Q3 Earning Report of BB&T CorporationQ3 Earning Report of BB&T Corporation
Q3 Earning Report of BB&T Corporation
 
Q3 2009 Earning Report of Brown & Brown
Q3 2009 Earning Report of Brown & BrownQ3 2009 Earning Report of Brown & Brown
Q3 2009 Earning Report of Brown & Brown
 
Q3 2009 Earning Report of Boston Scientific Corporation
Q3 2009 Earning Report of Boston Scientific CorporationQ3 2009 Earning Report of Boston Scientific Corporation
Q3 2009 Earning Report of Boston Scientific Corporation
 
Q3 2009 Earning Report of Boston Scientific Corporation
Q3 2009 Earning Report of Boston Scientific CorporationQ3 2009 Earning Report of Boston Scientific Corporation
Q3 2009 Earning Report of Boston Scientific Corporation
 
Q3 2009 Earning Report of Atheros Communications, Inc.
Q3 2009 Earning Report of Atheros Communications, Inc.Q3 2009 Earning Report of Atheros Communications, Inc.
Q3 2009 Earning Report of Atheros Communications, Inc.
 
Q3 2009 Earning Report of Apple Inc.
Q3 2009 Earning Report of Apple Inc.Q3 2009 Earning Report of Apple Inc.
Q3 2009 Earning Report of Apple Inc.
 
Q3 2009 Earning Report of Hancock Holding Company
Q3 2009 Earning Report of Hancock Holding CompanyQ3 2009 Earning Report of Hancock Holding Company
Q3 2009 Earning Report of Hancock Holding Company
 
Q3 2009 Earning Report of Walgreen Co.
Q3 2009 Earning Report of Walgreen Co.Q3 2009 Earning Report of Walgreen Co.
Q3 2009 Earning Report of Walgreen Co.
 
Q3 2009 Earning Report of Infosys Technologies Ltd.
Q3 2009 Earning Report of Infosys Technologies Ltd.Q3 2009 Earning Report of Infosys Technologies Ltd.
Q3 2009 Earning Report of Infosys Technologies Ltd.
 
Q3 2009 Earning Report of Marriott International
Q3 2009 Earning Report of Marriott InternationalQ3 2009 Earning Report of Marriott International
Q3 2009 Earning Report of Marriott International
 
Q3 2009 Earning Report of PepsiCo.
Q3 2009 Earning Report of PepsiCo.Q3 2009 Earning Report of PepsiCo.
Q3 2009 Earning Report of PepsiCo.
 
Q3 2009 Earning Report of Alcoa, Inc.
Q3 2009 Earning Report of Alcoa, Inc.Q3 2009 Earning Report of Alcoa, Inc.
Q3 2009 Earning Report of Alcoa, Inc.
 
Q3 2009 Earning Report of Pepsi Bottling Group
Q3 2009 Earning Report of Pepsi Bottling GroupQ3 2009 Earning Report of Pepsi Bottling Group
Q3 2009 Earning Report of Pepsi Bottling Group
 
Q3 2009 Earning Report of Jean Coutu Group
Q3 2009 Earning Report of Jean Coutu GroupQ3 2009 Earning Report of Jean Coutu Group
Q3 2009 Earning Report of Jean Coutu Group
 
Q3 2009 Earning Report of Minerva plc
Q3 2009 Earning Report of Minerva plcQ3 2009 Earning Report of Minerva plc
Q3 2009 Earning Report of Minerva plc
 
Q3 2009 Earning Report of Worthington Industries, Inc.
Q3 2009 Earning Report of Worthington Industries, Inc.Q3 2009 Earning Report of Worthington Industries, Inc.
Q3 2009 Earning Report of Worthington Industries, Inc.
 
Q3 2009 Earning Report of Walgreen
Q3 2009 Earning Report of WalgreenQ3 2009 Earning Report of Walgreen
Q3 2009 Earning Report of Walgreen
 

Último

The Inspirational Story of Julio Herrera Velutini - Global Finance Leader
The Inspirational Story of Julio Herrera Velutini - Global Finance LeaderThe Inspirational Story of Julio Herrera Velutini - Global Finance Leader
The Inspirational Story of Julio Herrera Velutini - Global Finance LeaderArianna Varetto
 
NO1 Certified Amil Baba In Lahore Kala Jadu In Lahore Best Amil In Lahore Ami...
NO1 Certified Amil Baba In Lahore Kala Jadu In Lahore Best Amil In Lahore Ami...NO1 Certified Amil Baba In Lahore Kala Jadu In Lahore Best Amil In Lahore Ami...
NO1 Certified Amil Baba In Lahore Kala Jadu In Lahore Best Amil In Lahore Ami...Amil baba
 
Unit 4.1 financial markets operations .pdf
Unit 4.1 financial markets operations .pdfUnit 4.1 financial markets operations .pdf
Unit 4.1 financial markets operations .pdfSatyamSinghParihar2
 
2024-04-09 - Pension Playpen roundtable - slides.pptx
2024-04-09 - Pension Playpen roundtable - slides.pptx2024-04-09 - Pension Playpen roundtable - slides.pptx
2024-04-09 - Pension Playpen roundtable - slides.pptxHenry Tapper
 
Unveiling Poonawalla Fincorp’s Phenomenal Performance Under Abhay Bhutada’s L...
Unveiling Poonawalla Fincorp’s Phenomenal Performance Under Abhay Bhutada’s L...Unveiling Poonawalla Fincorp’s Phenomenal Performance Under Abhay Bhutada’s L...
Unveiling Poonawalla Fincorp’s Phenomenal Performance Under Abhay Bhutada’s L...beulahfernandes8
 
NO1 Certified Black Magic Removal in Uk kala jadu Specialist kala jadu for Lo...
NO1 Certified Black Magic Removal in Uk kala jadu Specialist kala jadu for Lo...NO1 Certified Black Magic Removal in Uk kala jadu Specialist kala jadu for Lo...
NO1 Certified Black Magic Removal in Uk kala jadu Specialist kala jadu for Lo...Amil baba
 
PMFBY , Pradhan Mantri Fasal bima yojna
PMFBY , Pradhan Mantri  Fasal bima yojnaPMFBY , Pradhan Mantri  Fasal bima yojna
PMFBY , Pradhan Mantri Fasal bima yojnaDharmendra Kumar
 
Financial analysis on Risk and Return.ppt
Financial analysis on Risk and Return.pptFinancial analysis on Risk and Return.ppt
Financial analysis on Risk and Return.ppttadegebreyesus
 
Guard Your Investments- Corporate Defaults Alarm.pdf
Guard Your Investments- Corporate Defaults Alarm.pdfGuard Your Investments- Corporate Defaults Alarm.pdf
Guard Your Investments- Corporate Defaults Alarm.pdfJasper Colin
 
NO1 Certified kala jadu karne wale ka contact number kala jadu karne wale bab...
NO1 Certified kala jadu karne wale ka contact number kala jadu karne wale bab...NO1 Certified kala jadu karne wale ka contact number kala jadu karne wale bab...
NO1 Certified kala jadu karne wale ka contact number kala jadu karne wale bab...Amil baba
 
Uae-NO1 Pakistani Amil Baba Real Amil baba In Pakistan Najoomi Baba in Pakist...
Uae-NO1 Pakistani Amil Baba Real Amil baba In Pakistan Najoomi Baba in Pakist...Uae-NO1 Pakistani Amil Baba Real Amil baba In Pakistan Najoomi Baba in Pakist...
Uae-NO1 Pakistani Amil Baba Real Amil baba In Pakistan Najoomi Baba in Pakist...Amil baba
 
Market Morning Updates for 16th April 2024
Market Morning Updates for 16th April 2024Market Morning Updates for 16th April 2024
Market Morning Updates for 16th April 2024Devarsh Vakil
 
Financial Preparation for Millennia.pptx
Financial Preparation for Millennia.pptxFinancial Preparation for Millennia.pptx
Financial Preparation for Millennia.pptxsimon978302
 
2024 Q1 Crypto Industry Report | CoinGecko
2024 Q1 Crypto Industry Report | CoinGecko2024 Q1 Crypto Industry Report | CoinGecko
2024 Q1 Crypto Industry Report | CoinGeckoCoinGecko
 
Gender and caste discrimination in india
Gender and caste discrimination in indiaGender and caste discrimination in india
Gender and caste discrimination in indiavandanasingh01072003
 
Economic Risk Factor Update: April 2024 [SlideShare]
Economic Risk Factor Update: April 2024 [SlideShare]Economic Risk Factor Update: April 2024 [SlideShare]
Economic Risk Factor Update: April 2024 [SlideShare]Commonwealth
 
Banking: Commercial and Central Banking.pptx
Banking: Commercial and Central Banking.pptxBanking: Commercial and Central Banking.pptx
Banking: Commercial and Central Banking.pptxANTHONYAKINYOSOYE1
 
NO1 Certified Black Magic Specialist Expert In Bahawalpur, Sargodha, Sialkot,...
NO1 Certified Black Magic Specialist Expert In Bahawalpur, Sargodha, Sialkot,...NO1 Certified Black Magic Specialist Expert In Bahawalpur, Sargodha, Sialkot,...
NO1 Certified Black Magic Specialist Expert In Bahawalpur, Sargodha, Sialkot,...Amil baba
 
Uae-NO1 Rohani Amil In Islamabad Amil Baba in Rawalpindi Kala Jadu Amil In Ra...
Uae-NO1 Rohani Amil In Islamabad Amil Baba in Rawalpindi Kala Jadu Amil In Ra...Uae-NO1 Rohani Amil In Islamabad Amil Baba in Rawalpindi Kala Jadu Amil In Ra...
Uae-NO1 Rohani Amil In Islamabad Amil Baba in Rawalpindi Kala Jadu Amil In Ra...Amil baba
 
Liquidity Decisions in Financial management
Liquidity Decisions in Financial managementLiquidity Decisions in Financial management
Liquidity Decisions in Financial managementshrutisingh143670
 

Último (20)

The Inspirational Story of Julio Herrera Velutini - Global Finance Leader
The Inspirational Story of Julio Herrera Velutini - Global Finance LeaderThe Inspirational Story of Julio Herrera Velutini - Global Finance Leader
The Inspirational Story of Julio Herrera Velutini - Global Finance Leader
 
NO1 Certified Amil Baba In Lahore Kala Jadu In Lahore Best Amil In Lahore Ami...
NO1 Certified Amil Baba In Lahore Kala Jadu In Lahore Best Amil In Lahore Ami...NO1 Certified Amil Baba In Lahore Kala Jadu In Lahore Best Amil In Lahore Ami...
NO1 Certified Amil Baba In Lahore Kala Jadu In Lahore Best Amil In Lahore Ami...
 
Unit 4.1 financial markets operations .pdf
Unit 4.1 financial markets operations .pdfUnit 4.1 financial markets operations .pdf
Unit 4.1 financial markets operations .pdf
 
2024-04-09 - Pension Playpen roundtable - slides.pptx
2024-04-09 - Pension Playpen roundtable - slides.pptx2024-04-09 - Pension Playpen roundtable - slides.pptx
2024-04-09 - Pension Playpen roundtable - slides.pptx
 
Unveiling Poonawalla Fincorp’s Phenomenal Performance Under Abhay Bhutada’s L...
Unveiling Poonawalla Fincorp’s Phenomenal Performance Under Abhay Bhutada’s L...Unveiling Poonawalla Fincorp’s Phenomenal Performance Under Abhay Bhutada’s L...
Unveiling Poonawalla Fincorp’s Phenomenal Performance Under Abhay Bhutada’s L...
 
NO1 Certified Black Magic Removal in Uk kala jadu Specialist kala jadu for Lo...
NO1 Certified Black Magic Removal in Uk kala jadu Specialist kala jadu for Lo...NO1 Certified Black Magic Removal in Uk kala jadu Specialist kala jadu for Lo...
NO1 Certified Black Magic Removal in Uk kala jadu Specialist kala jadu for Lo...
 
PMFBY , Pradhan Mantri Fasal bima yojna
PMFBY , Pradhan Mantri  Fasal bima yojnaPMFBY , Pradhan Mantri  Fasal bima yojna
PMFBY , Pradhan Mantri Fasal bima yojna
 
Financial analysis on Risk and Return.ppt
Financial analysis on Risk and Return.pptFinancial analysis on Risk and Return.ppt
Financial analysis on Risk and Return.ppt
 
Guard Your Investments- Corporate Defaults Alarm.pdf
Guard Your Investments- Corporate Defaults Alarm.pdfGuard Your Investments- Corporate Defaults Alarm.pdf
Guard Your Investments- Corporate Defaults Alarm.pdf
 
NO1 Certified kala jadu karne wale ka contact number kala jadu karne wale bab...
NO1 Certified kala jadu karne wale ka contact number kala jadu karne wale bab...NO1 Certified kala jadu karne wale ka contact number kala jadu karne wale bab...
NO1 Certified kala jadu karne wale ka contact number kala jadu karne wale bab...
 
Uae-NO1 Pakistani Amil Baba Real Amil baba In Pakistan Najoomi Baba in Pakist...
Uae-NO1 Pakistani Amil Baba Real Amil baba In Pakistan Najoomi Baba in Pakist...Uae-NO1 Pakistani Amil Baba Real Amil baba In Pakistan Najoomi Baba in Pakist...
Uae-NO1 Pakistani Amil Baba Real Amil baba In Pakistan Najoomi Baba in Pakist...
 
Market Morning Updates for 16th April 2024
Market Morning Updates for 16th April 2024Market Morning Updates for 16th April 2024
Market Morning Updates for 16th April 2024
 
Financial Preparation for Millennia.pptx
Financial Preparation for Millennia.pptxFinancial Preparation for Millennia.pptx
Financial Preparation for Millennia.pptx
 
2024 Q1 Crypto Industry Report | CoinGecko
2024 Q1 Crypto Industry Report | CoinGecko2024 Q1 Crypto Industry Report | CoinGecko
2024 Q1 Crypto Industry Report | CoinGecko
 
Gender and caste discrimination in india
Gender and caste discrimination in indiaGender and caste discrimination in india
Gender and caste discrimination in india
 
Economic Risk Factor Update: April 2024 [SlideShare]
Economic Risk Factor Update: April 2024 [SlideShare]Economic Risk Factor Update: April 2024 [SlideShare]
Economic Risk Factor Update: April 2024 [SlideShare]
 
Banking: Commercial and Central Banking.pptx
Banking: Commercial and Central Banking.pptxBanking: Commercial and Central Banking.pptx
Banking: Commercial and Central Banking.pptx
 
NO1 Certified Black Magic Specialist Expert In Bahawalpur, Sargodha, Sialkot,...
NO1 Certified Black Magic Specialist Expert In Bahawalpur, Sargodha, Sialkot,...NO1 Certified Black Magic Specialist Expert In Bahawalpur, Sargodha, Sialkot,...
NO1 Certified Black Magic Specialist Expert In Bahawalpur, Sargodha, Sialkot,...
 
Uae-NO1 Rohani Amil In Islamabad Amil Baba in Rawalpindi Kala Jadu Amil In Ra...
Uae-NO1 Rohani Amil In Islamabad Amil Baba in Rawalpindi Kala Jadu Amil In Ra...Uae-NO1 Rohani Amil In Islamabad Amil Baba in Rawalpindi Kala Jadu Amil In Ra...
Uae-NO1 Rohani Amil In Islamabad Amil Baba in Rawalpindi Kala Jadu Amil In Ra...
 
Liquidity Decisions in Financial management
Liquidity Decisions in Financial managementLiquidity Decisions in Financial management
Liquidity Decisions in Financial management
 

Acergy Q1 Results Show Solid Performance

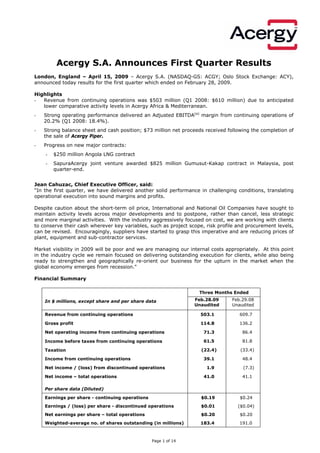
  • 1. Acergy S.A. Announces First Quarter Results London, England – April 15, 2009 – Acergy S.A. (NASDAQ-GS: ACGY; Oslo Stock Exchange: ACY), announced today results for the first quarter which ended on February 28, 2009. Highlights Revenue from continuing operations was $503 million (Q1 2008: $610 million) due to anticipated - lower comparative activity levels in Acergy Africa & Mediterranean. Strong operating performance delivered an Adjusted EBITDA(a) margin from continuing operations of - 20.2% (Q1 2008: 18.4%). Strong balance sheet and cash position; $73 million net proceeds received following the completion of - the sale of Acergy Piper. Progress on new major contracts: - $250 million Angola LNG contract - SapuraAcergy joint venture awarded $825 million Gumusut-Kakap contract in Malaysia, post - quarter-end. Jean Cahuzac, Chief Executive Officer, said: “In the first quarter, we have delivered another solid performance in challenging conditions, translating operational execution into sound margins and profits. Despite caution about the short-term oil price, International and National Oil Companies have sought to maintain activity levels across major developments and to postpone, rather than cancel, less strategic and more marginal activities. With the industry aggressively focused on cost, we are working with clients to conserve their cash wherever key variables, such as project scope, risk profile and procurement levels, can be revised. Encouragingly, suppliers have started to grasp this imperative and are reducing prices of plant, equipment and sub-contractor services. Market visibility in 2009 will be poor and we are managing our internal costs appropriately. At this point in the industry cycle we remain focused on delivering outstanding execution for clients, while also being ready to strengthen and geographically re-orient our business for the upturn in the market when the global economy emerges from recession.quot; Financial Summary Three Months Ended Feb.28.09 Feb.29.08 In $ millions, except share and per share data Unaudited Unaudited Revenue from continuing operations 503.1 609.7 Gross profit 114.8 136.2 Net operating income from continuing operations 71.3 86.4 61.5 81.8 Income before taxes from continuing operations (22.4) (33.4) Taxation Income from continuing operations 39.1 48.4 Net income / (loss) from discontinued operations 1.9 (7.3) Net income – total operations 41.0 41.1 Per share data (Diluted) Earnings per share - continuing operations $0.19 $0.24 Earnings / (loss) per share - discontinued operations $0.01 ($0.04) Net earnings per share – total operations $0.20 $0.20 Weighted-average no. of shares outstanding (in millions) 183.4 191.0 Page 1 of 14
  • 2. Operating Review Acergy Africa and Mediterranean – Revenue from continuing operations for the first quarter fell to $228.0 million (Q1 2008: $359.5 million) due to lower activity levels and the planned dry-dock of the Acergy Polaris. Good progress was made on Block 15, Tombua Landana and EPC2B, which completed during the quarter, and PazFlor, which passed the 5% profit recognition threshold during the quarter. Net operating income from continuing operations for the quarter was $37.0 million (Q1 2008: $57.5 million) due to lower activity levels and utilisation of assets. Acergy Northern Europe and Canada – Revenue from continuing operations for the first quarter was $138.1 million (Q1 2008: $128.0 million) reflecting good levels of SURF, IMR and survey activity. Good operational progress was made on StatoilHydro Alve, Dong Nini, Deep Panuke and Tyrihans Subsea Installation. Net operating income from continuing operations for the quarter was $1.5 million (Q1 2008: $5.9 million), reflecting the $6.5 million charge for the cancellation of the Merlin charter and lower asset utilisation during the quarter, offset by good project performance in a seasonally low period. Acergy North America and Mexico – Revenue from continuing operations for the first quarter was $4.3 million (Q1 2008: $0.6 million) with net operating income from continuing operations for the quarter of $4.6 million (Q1 2008: $0.7 million) an improvement due to the contribution from the cross-regional Frade Project which progressed well and good progress on the engineering phase of the Perdido Project. Acergy South America – Revenue from continuing operations for the first quarter was $85.3 million (Q1 2008: $76.6 million) driven by strong revenue contribution from the Frade Project. The three ships on long-term service agreements to Petrobras achieved high utilisation. Net operating income from continuing operations for the quarter was $7.5 million (Q1 2008: $7.5 million) following good performance on all activities. Acergy Asia and Middle East – Revenue from continuing operations for the first quarter was $47.1 million (Q1 2008: $44.1 million) reflecting good progress on projects, including Van Gogh and Pluto, which passed the 5% profit recognition threshold. Net operating income from continuing operations of $12.6 million (Q1 2008: net operating loss of $2.7 million) reflected good project performance, including project close-out on Dai Hung. Discontinued operations Net income from discontinued operations for the first quarter was $1.9 million (Q1 2008: net loss of $7.3 million) due to the positive contribution from the Mexilhao Trunkline Project. Asset Development In January 2009, the Acergy Piper was sold for net proceeds of $73 million. The Acergy Polaris completed her planned dry-dock programme and recommenced work in West Africa in the second half of the quarter. The charter arrangement for the Merlin was cancelled in February. All charges, including a $6.5 million settlement relating to the cancellation of the charter, have been recognised in Acergy Northern Europe and Canada during the first quarter. Financial Review Revenue from continuing operations for the first quarter of 2009 was $503 million (Q1 2008: $610 million) reflecting lower activity levels in West Africa and the planned dry-dock of the Acergy Polaris which were partially offset by good SURF and IMR activity levels in the North Sea and good SURF activity levels in Brazil and Asia Pacific. Gross profit was $115 million (Q1 2008: $136 million) reflecting the lower activity levels and fewer projects in installation phase in AFMED, which were partially offset by good project execution and some foreign exchange gains on trade balances during the quarter. Administrative expenses were $53 million (Q1 2008: $60 million) reflecting a strengthened US dollar, partially offset by higher tendering costs. Acergy’s share of results from associates and joint ventures was broadly flat at $10 million (Q1 2008: $11 million) reflecting a lower contribution from NKT Flexibles, partially offset by a good contribution from Seaway Heavy Lifting and an improvement from the SapuraAcergy joint venture, which delivered a small positive contribution in the quarter. Page 2 of 14
  • 3. The Adjusted EBITDA margin from continuing operations for the three months was 20.2% (Q1 2008: 18.4%). The Adjusted EBITDA margin from total operations for the three months was 20.0% (Q1 2008: 16.0%). Income before taxes from continuing operations for the first quarter was $62 million (Q1 2008: $82 million) reflecting the lower activity levels in AFMED, which were partially offset by good project execution and a good contribution from associates and joint ventures. Taxation for the quarter was $22 million (Q1 2008: $33 million), reflecting an effective rate of 36% (Q1 2008: 41%). Net income from continuing operations for the first quarter was $39 million (Q1 2008: $48 million). Net income from total operations for the first quarter was $41 million (Q1 2008: $41 million). The cash and cash equivalents position at the quarter end was $678 million (Q4 2008: $573 million). Deferred revenue, at the quarter end stood at $272 million (Q4 2008: $306 million). At quarter end, Acergy S.A. held directly 11,224,508 treasury shares representing 5.76% of the total number of issued shares, as well as indirectly holding 879,121 treasury shares, representing 0.45% of the total number of issued shares. Total shares in issue were 194,953,972, including these treasury shares. Backlog Backlog for continuing operations as at February 28, 2009 was approximately $2.4 billion, of which $1.2 billion is expected to be executed in the remainder of fiscal year 2009. This backlog figure does not include the backlog relating to associates and joint ventures. In $ millions as at: Feb.28.09 Nov.30.08 Feb.29.08 2,432 2,511 3,647 (1) Backlog 75 149 368 (2) Pre-Backlog (1) Backlog excludes amounts related to discontinued operations of Feb.28.09: $86 million, Nov.30.08: $114 million, Feb.29.08: $325 million (2) Pre-backlog reflects the stated value of letters of intent and the expected value of escalations on frame agreements Current Trading and Outlook Since the beginning of 2009, market conditions have become more challenging, characterised by sporadic order flow and pricing pressure on new contracts. Reduced market visibility and the late award of contracts make us more cautious in respect of our expectations. For fiscal year 2009, we expect revenue to decrease to levels marginally lower than current consensus. However, our Adjusted EBITDA margin will show some resilience as we deliver on the current order book. Activity patterns in several regions will disrupt the typical annual profile of quarterly revenues and profits and the third quarter may be weaker in comparison to the corresponding period in 2008. Looking ahead, we are confident that our skills and strengths meet our clients' strategic needs, particularly in the development of hydrocarbon discoveries secured in frontier acreage. As demand improves, and with field depletion increasing, the need to access new reserves and replenish production will return our markets to growth. We are well-placed, both financially and operationally, to exploit new growth areas, such as Brazil, while recognising that other regions have an evolving significance for the Group. ************************************************************************************ Acergy S.A. is a seabed-to-surface engineering and construction contractor to the offshore oil and gas industry worldwide. We provide integrated services, and we plan, design and deliver complex projects in harsh and challenging environments. ************************************************************************************ Page 3 of 14
  • 4. (a) Adjusted EBITDA: The Group calculates Adjusted EBITDA from continuing operations (adjusted earnings before interest, income taxation, depreciation and amortisation) as net income from continuing operations plus finance costs, other gains and losses, taxation, depreciation and amortisation and adjusted to exclude investment income and impairment of property, plant and equipment. Adjusted EBITDA margin from continuing operations is defined as Adjusted EBITDA divided by revenue from continuing operations. Management believes that Adjusted EBITDA and Adjusted EBITDA margin from continuing operations are important indicators of our operational strength and the performance of our business. Adjusted EBITDA and Adjusted EBITDA margin from continuing operations have not been prepared in accordance with International Financial Reporting Standards (“IFRS”) as issued by the IASB nor as endorsed for use in the European Union. These non-IFRS measures provide management with a meaningful comparison amongst our various regions, as they eliminate the effects of financing and depreciation. Adjusted EBITDA margin from continuing operations may also be a useful ratio to compare our performance to our competitors and is widely used by shareholders and analysts following the Group’s performance. However, Adjusted EBITDA and Adjusted EBITDA margin from continuing operations as presented by the Group may not be comparable to similarly titled measures reported by other companies. Such supplementary adjustments to EBITDA may not be in accordance with current practices or the rules and regulations adopted by the US Securities and Exchange Commission (the “SEC”) that apply to reports filed under the Securities Exchange Act of 1934. Accordingly, the SEC may require that Adjusted EBITDA and Adjusted EBITDA margin from continuing operations be presented differently in filings made with the SEC than as presented in this release, or not be presented at all. Adjusted EBITDA and Adjusted EBITDA margin from continuing operations are not measures determined in accordance with IFRS and should not be considered as an alternative to, or more meaningful than, net income (as determined in accordance with IFRS), as a measure of the Group’s operating results or cash flows from operations (as determined in accordance with IFRS) or as a measure of the Group’s liquidity. The reconciliation of the Group’s net income from continuing operations to Adjusted EBITDA from continuing operations is included in this release. This release also includes a supplemental calculation of Adjusted EBITDA from continuing operations calculated as net operating income from continuing operations, plus depreciation and amortisation and impairment charges on property, plant and equipment. Management believes that this supplemental presentation of Adjusted EBITDA from continuing operations is also useful as it is more in line with the presentation of similarly titled measures by companies within Acergy’s peer group and therefore believes it to be a helpful calculation for those evaluating companies within Acergy’s industry. Adjusted EBITDA for discontinued operations is calculated as per methodology outlined above. Adjusted EBITDA for total operations is the total of continuing operations and discontinued operations. Forward-Looking Statements: Certain statements made in this announcement may include “forward-looking statements” within the meaning of Section 27A of the Securities Act and Section 21E of the US Securities Exchange Act of 1934. These statements may be identified by the use of words like “anticipate,” “believe,” “estimate,” “expect,” “intend,” “may,” “plan,” “forecast”, “project,” “will,” “should,” “seek,” and similar expressions. These statements include, but are not limited to, statements as to the approximate value of the awarded contracts, the strength and geographical orientation of our business, our projections of 2009, expectations regarding our backlog and pre-backlog and statements contained in the “Current Trading and Outlook” section, including our expected revenues and Adjusted EBITDA margin in fiscal 2009, the impact of activity patterns in several territories on our annual profile of quarterly revenues, our ability to exploit new growth areas, such as Brazil, and statements as to management’s confidence that our market will return to growth and we are well suited to our clients’ strategic needs. The forward-looking statements reflect our current views and assumptions and are subject to risks and uncertainties. The following factors, and others which are discussed in our public filings and submissions with the U.S. Securities and Exchange Commission, are among those that may cause actual and future results and trends to differ materially from our forward-looking statements: our ability to recover costs on significant projects; the general economic conditions and competition in the markets and businesses in which we operate; our relationship with significant clients; the outcome of legal and administrative proceedings or governmental enquiries; uncertainties inherent in operating internationally; the timely delivery of ships on order and the timely completion of ship conversion programmes; the impact of laws and regulations; and operating hazards, including spills and environmental damage. Many of these factors are beyond our ability to control or predict. Given these factors, you should not place undue reliance on the forward-looking statements. Page 4 of 14
  • 5. Conference Call Information Replay Facility Details Lines will open 30 minutes prior to conference call. A replay facility will be available for the following period: Date: Wednesday April 15, 2009 Date: Wednesday April 15, 2009 Time: 3.00pm UK Time Time: 4.30pm UK Time Date: Tuesday April 21, 2009 Conference Dial In Numbers: Time: 4.30pm UK Time UK Toll Free : 0800 694 0257 USA Toll Free : 1 866 966 9439 France : 0805 632056 Conference Replay Dial In Number: Norway : 800 19414 Netherlands : 0800 023 5091 International Dial In: +44 (0) 1452 550 000 Germany : 0800 101 4960 Passcode: 93199548# International Dial In: +44 (0) 1452 561 394 Passcode: 93199548 Alternatively, a live webcast and a playback facility will be available on our website www.acergy-group.com Contacts: Karen Menzel Acergy S.A. +44 (0)20 8210 5568 karen.menzel@acergy-group.com www.acergy-group.com If you no longer wish to receive our press releases please contact: kelly.good@acergy-group.com - End Text – - Tables Follow - Page 5 of 14
  • 6. ACERGY S.A. AND SUBSIDIARIES CONSOLIDATED INCOME STATEMENT (In $ millions, except share and per share data) Three Months Ended February February 28, 2009 29, 2008 Unaudited Unaudited Revenue from continuing operations 503.1 609.7 Operating expenses (388.3) (473.5) Gross profit 114.8 136.2 Administrative expenses (53.3) (59.7) Net other operating income/(loss) 0.1 (0.7) Share of results of associates and joint ventures 9.7 10.6 Net operating income from continuing operations 71.3 86.4 Investment income 1.8 5.7 Other gains and losses (1.9) (1.1) Finance costs (9.7) (9.2) Income before taxes from continuing operations 61.5 81.8 Taxation (22.4) (33.4) Income from continuing operations 39.1 48.4 Net income / (loss) from discontinued operations 1.9 (7.3) Net income 41.0 41.1 Net income attributable to: Equity holders of parent 37.3 38.1 Minority interest 3.7 3.0 Net income 41.0 41.1 PER SHARE DATA Earnings / (loss) per share Basic: Continuing operations 0.19 0.24 Discontinued operations 0.01 (0.04) Net earnings 0.20 0.20 Diluted: Continuing operations 0.19 0.24 Discontinued operations 0.01 (0.04) Net earnings 0.20 0.20 Weighted average number of Common Shares And Common Share equivalents outstanding Basic 182.8 188.1 Diluted 183.4 191.0 SELECTED INFORMATION - CONTINUING OPERATIONS Cash outflows for capital expenditures 56.5 41.4 Depreciation and amortisation 30.5 26.0 Page 6 of 14
  • 7. ACERGY S.A. AND SUBSIDIARIES CONSOLIDATED BALANCE SHEETS (In $ millions) As at As at As at February November February 30, 2008(1) 28, 2009 29, 2008 Unaudited Audited Unaudited ASSETS Non-current assets Intangible assets 3.8 3.8 3.7 Property, plant and equipment 899.3 907.6 828.7 Interest in associates and joint ventures 144.2 140.2 128.7 Advances and receivables and other non-current assets 48.5 47.9 60.9 Deferred tax assets 39.8 39.8 61.5 Total non-current assets 1,135.6 1,139.3 1,083.5 Current assets Inventories 38.0 38.5 33.5 (2) Trade and other receivables 324.5 354.5 466.5 Other current assets 45.5 56.8 31.7 Assets held for sale 1.1 75.5 1.1 Other accrued income and prepaid expenses 237.0 233.5 241.2 Cash and cash equivalents 677.6 573.0 649.8 Total current assets 1,323.7 1,331.8 1,423.8 Total assets 2,459.3 2,471.1 2,507.3 EQUITY Capital and reserves attributable to equity holders Issued share capital 389.9 389.9 389.9 Own shares (228.8) (229.4) (116.6) Paid in surplus 500.2 498.7 494.3 Equity reserve 110.7 110.7 110.7 Translation reserve (85.4) (70.4) 35.5 Other reserves (80.9) (70.4) (8.5) Retained earnings / (Accumulated deficit) 195.5 158.6 (52.0) Equity attributable to equity holders of the parent 801.2 787.7 853.3 Minority interest 17.2 13.7 21.4 Total equity 818.4 801.4 874.7 LIABILITIES Non-current liabilities Non-current portion of borrowings 413.0 409.2 389.9 Retirement benefit obligation 20.4 21.2 51.1 Deferred tax liabilities 56.1 56.1 36.0 Other non-current liabilities 69.9 69.0 43.1 Total non-current liabilities 559.4 555.5 520.1 Current liabilities Trade and other payables 620.9 651.6 653.7 Current tax liabilities 101.5 69.1 167.8 Current portion of borrowings 4.8 10.1 4.0 Other current liabilities 82.1 77.8 34.3 Deferred revenue 272.2 305.6 252.7 Total current liabilities 1,081.5 1,114.2 1,112.5 Total liabilities 1,640.9 1,669.7 1,632.6 Total equity and liabilities 2,459.3 2,471.1 2,507.3 (1) These figures have been extracted from the Audited Consolidated Financial Statements for 2008. (2) As at February 28, 2009 a total of $nil million of claims not formally agreed with clients has been included in trade and other receivables. This compares to $nil million and $11.0 million of claims included in trade and other receivables as at November 30, 2008 and February 29, 2008 respectively. Page 7 of 14
  • 8. ACERGY S.A. AND SUBSIDIARIES STATEMENT OF MOVEMENT OF RETAINED EARNINGS FOR THREE MONTHS ENDED FEBRUARY 28, 2009 (In $ millions) 158.6 Balance, November 30, 2008 37.3 Net income for three months ended February 28, 2009 (0.4) Loss on sale of own shares 195.5 Balance, February 28, 2009 ACERGY S.A. AND SUBSIDIARIES EARNINGS PER SHARE CALCULATION (In $ millions, except share and per share data) Three Months Ended February February 28, 2009 29, 2008 Net income attributable to equity holders 37.3 38.1 (Income) / loss from discontinued operations (1.9) 7.3 Net Income from continuing operations 35.4 45.4 Interest expense on convertible note 7.3 7.0 Adjusted net income from continuing operations including convertible note 42.7 52.4 Weighted-average number of common shares: Basic number of shares 182,840,184 188,086,510 Diluted number of shares 183,412,182 190,973,907 Convertible note dilutive effect 20,790,021 20,790,021 Total diluted number of shares 204,202,203 211,763,928 BASIC Continuing operations $0.19 $0.24 Discontinued operations $0.01 $(0.04) Net Earnings / (loss) $0.20 $0.20 DILUTED excluding convertible note Continuing operations $0.19 $0.24 Discontinued operations $0.01 $(0.04) Net Earnings / (loss) $0.20 $0.20 DILUTED including convertible note Continuing operations $0.21 $0.25 Discontinued operations $0.01 $(0.04) Net Earnings / (loss) $0.22 $0.21 • For the three months ended February 2009 and 2008 the effect of inclusion of the Convertible note would be to increase the diluted EPS from $0.20 to $0.22 (Q1 2008: $0.20 to $0.21). This is anti-dilutive and is therefore not included in the calculation. Page 8 of 14
  • 9. ACERGY S.A. AND SUBSIDIARIES SEGMENTAL ANALYSIS (In $ millions) The Group has six reportable segments based on the geographic distribution of its activities as follows: the Acergy Africa and Mediterranean segment (AFMED) covers activities in Africa and the Mediterranean; the Acergy Northern Europe and Canada segment (NEC) includes all activities in Northern Europe and Eastern Canada; the Acergy North America and Mexico segment (NAMEX) includes all activities in the United States, Mexico, Central America and Western Canada; the Acergy South America segment (SAM) incorporates activities in South America and the islands of the southern Atlantic Ocean; the Acergy Asia and Middle East segment (AME) includes all activities in Asia Pacific, India and the Middle East (excluding the Caspian Sea) and including the SapuraAcergy joint venture. The Acergy Corporate segment (Corporate) includes all activities that serve more than one region. These include the activities of the SHL and NKT joint ventures. Also included are assets which have global mobility including construction ships, ROVs and other assets that are not attributed to any one segment; management of offshore personnel; captive insurance activities; and Management and corporate services provided for the benefit of the whole Group, including design engineering, finance and legal departments. Three months ended Acergy Acergy Acergy Acergy Acergy Acergy Total – February 28, 2009 AFMED NEC NAMEX SAM AME Corporate Continuing operations (In $ millions) Revenue(1) 228.0 138.1 4.3 85.3 47.1 0.3 503.1 Net operating income 37.0 1.5 4.6 7.5 12.6 8.1 71.3 Investment income 1.8 Other gains & losses (1.9) Finance costs (9.7) Net income before taxation from continuing operations 61.5 Three months ended Acergy Acergy Acergy Acergy Acergy Acergy Total – February 29, 2008 AFMED NEC NAMEX SAM AME Corporate Continuing operations (In $ millions) Revenue(1) 359.5 128.0 0.6 76.6 44.1 0.9 609.7 Net operating income/(loss) 57.5 5.9 0.7 7.5 (2.7) 17.5 86.4 Investment income 5.7 Other gains & losses (1.1) Finance costs (9.2) Net income before taxation from continuing operations 81.8 1. Three clients each individually accounted for more than 10% of the Group's revenue from continuing operations for the quarter ended February 28, 2009. The revenue from these clients was $226.8 million and was attributable to Acergy Africa and Mediterranean, Acergy Northern Europe and Canada and Acergy South America. Two clients each individually accounted for more than 10% of our revenue from continuing operations for the quarter ended February 29, 2008. The revenue from these clients was $267.8 million and was attributable to Acergy Africa and Mediterranean, Acergy Northern Europe and Canada and Acergy South America. Page 9 of 14
  • 10. ACERGY S.A. AND SUBSIDIARIES RECONCILIATION OF NET OPERATING INCOME TO ADJUSTED EBITDA (In $ millions, except percentages) Three Months Ended Three Months Ended February February February February February February 28, 2009 28, 2009 28, 2009 29, 2008 29, 2008 29, 2008 Total Total Continuing Discontinued Continuing Discontinued Operations Operations Net operating income 71.3 5.4 76.7 86.4 (12.9) 73.5 Depreciation and 30.5 - 30.5 26.0 2.0 28.0 amortisation Impairments - - - - - - Adjusted EBITDA 101.8 5.4 107.2 112.4 (10.9) 101.5 Revenue 503.1 32.3 535.4 609.7 26.2 635.9 Adjusted EBITDA % 20.2% 16.7% 20.0% 18.4% (41.6%) 16.0% ACERGY S.A. AND SUBSIDIARIES RECONCILIATION OF NET INCOME TO ADJUSTED EBITDA (In $ millions, except percentages) Three Months Ended Three Months Ended February February February February February February 28, 2009 28, 2009 28, 2009 29, 2008 29, 2008 29, 2008 Total Total Continuing Discontinued Continuing Discontinued Operations Operations Net income 39.1 1.9 41.0 48.4 (7.3) 41.1 Depreciation and 30.5 - 30.5 26.0 2.0 28.0 amortisation Impairments - - - - - - Investment income (1.8) - (1.8) (5.7) - (5.7) Other gains and losses 1.9 2.5 4.4 1.1 (1.1) - Finance costs 9.7 - 9.7 9.2 - 9.2 Taxation 22.4 1.0 23.4 33.4 (4.5) 28.9 Adjusted EBITDA 101.8 5.4 107.2 112.4 (10.9) 101.5 Revenue 503.1 32.3 535.4 609.7 26.2 635.9 Adjusted EBITDA % 20.2% 16.7% 20.0% 18.4% (41.6%) 16.0% Page 10 of 14
  • 11. APPENDIX: 2008 QUARTERLY RESULTS RE-PRESENTED TO REFLECT DISCONTINUED OPERATIONS ACERGY S.A. AND SUBSIDIARIES CONSOLIDATED INCOME STATEMENT (In $ millions, except share and per share data) Twelve Three Months Ended Months Ended February May August November November 29, 2008 31, 2008 31, 2008 30, 2008 30, 2008 639.2 567.9 2,522.4 Revenue from continuing operations 609.7 705.6 (453.6) (423.0) (1,874.2) Operating expenses (473.5) (524.1) 185.6 144.9 648.2 Gross profit 136.2 181.5 (63.9) (68.3) (253.8) Administrative expenses (59.7) (61.9) - 0.1 3.4 Net other operating income/(loss) (0.7) 4.0 12.8 26.0 63.0 Share of results of associates and joint ventures 10.6 13.6 134.5 102.7 460.8 Net operating income from continuing operations 86.4 137.2 5.0 4.3 17.9 Investment income 5.7 2.9 14.4 34.9 44.1 Other gains and losses (1.1) (4.1) (9.9) (6.2) (30.5) Finance costs (9.2) (5.2) 144.0 135.7 492.3 Income before taxes from continuing operations 81.8 130.8 (42.8) (45.8) (162.6) Taxation (33.4) (40.6) 101.2 89.9 329.7 Income from continuing operations 48.4 90.2 11.7 1.5 (22.5) Net income / (loss) from discontinued operations (7.3) (28.4) Net income 41.1 61.8 112.9 91.4 307.2 Net income attributable to: 112.3 85.3 301.4 Equity holders of parent 38.1 65.7 0.6 6.1 5.8 Minority interests 3.0 (3.9) Net income 41.1 61.8 112.9 91.4 307.2 PER SHARE DATA Earnings / (loss) per share Basic: 0.55 0.46 1.76 Continuing operations 0.24 0.51 Discontinued operations (0.04) (0.15) 0.06 0.01 (0.12) Net earnings 0.20 0.36 0.61 0.47 1.64 Diluted: 0.52 0.45 1.70 Continuing operations 0.24 0.49 Discontinued operations (0.04) (0.14) 0.06 0.01 (0.11) Net earnings 0.20 0.35 0.58 0.46 1.59 Weighted average number of Common Shares And Common Share equivalents outstanding 182.5 182.8 184.1 Basic 188.1 183.2 205.5 204.3 207.1 Diluted 191.0 207.1 SELECTED INFORMATION - CONTINUING OPERATIONS 76.8 101.0 292.9 Cash outflows for capital expenditures 41.4 73.7 27.8 30.6 110.4 Depreciation and amortisation 26.0 26.0 - 1.8 1.8 Impairment - - Page 11 of 14
  • 12. ACERGY S.A. AND SUBSIDIARIES SEGMENTAL ANALYSIS (In $ millions) Three months ended Acergy Acergy Acergy Acergy Acergy Acergy Total – February 29, 2008 AFMED NEC NAMEX SAM AME Corporate Continuing operations (In $ millions) Revenue 359.5 128.0 0.6 76.6 44.1 0.9 609.7 Net operating income/(loss) 57.5 5.9 0.7 7.5 (2.7) 17.5 86.4 Investment income 5.7 Other gains & losses (1.1) Finance costs (9.2) Net income before taxation from continuing operations 81.8 Three months ended Acergy Acergy Acergy Acergy Acergy Acergy Total – May 31, 2008 AFMED NEC NAMEX SAM AME Corporate Continuing operations (In $ millions) Revenue 375.3 210.3 0.9 75.3 43.2 0.6 705.6 Net operating income/(loss) 82.7 32.4 5.6 11.2 8.2 (2.9) 137.2 Investment income 2.9 Other gains & losses (4.1) Finance costs (5.2) Net income before taxation from continuing operations 130.8 Three months ended Acergy Acergy Acergy Acergy Acergy Acergy Total – August 30, 2008 AFMED NEC NAMEX SAM AME Corporate Continuing operations (In $ millions) Revenue 233.4 278.7 1.1 77.3 48.5 0.2 639.2 Net operating income/(loss) 20.7 88.3 0.3 (3.5) 6.8 21.9 134.5 Investment income 5.0 Other gains & losses 14.4 Finance costs (9.9) Net income before taxation from continuing operations 144.0 Three months ended Acergy Acergy Acergy Acergy Acergy Acergy Total – November 30, 2008 AFMED NEC NAMEX SAM AME Corporate Continuing operations (In $ millions) Revenue 207.7 226.1 1.8 90.9 45.0 (3.6) 567.9 Net operating income 22.8 65.4 3.9 7.4 2.1 1.1 102.7 Investment income 4.3 Other gains & losses 34.9 Finance costs (6.2) Net income before taxation from continuing operations 135.7 Twelve months ended Acergy Acergy Acergy Acergy Acergy Acergy Total – November 30, 2008 AFMED NEC NAMEX SAM AME Corporate Continuing operations (In $ millions) Revenue 1,175.9 843.1 4.4 320.1 180.8 (1.9) 2,522.4 Net operating income 183.7 192.0 10.5 22.6 14.4 37.6 460.8 Investment income 17.9 Other gains & losses 44.1 Finance costs (30.5) Net income before taxation from continuing operations 492.3 Page 12 of 14
  • 13. ACERGY S.A. AND SUBSIDIARIES RECONCILIATION OF NET OPERATING INCOME TO ADJUSTED EBITDA (In $ millions, except percentages) Three Months Ended Three Months Ended February February February May May May 29, 2008 29, 2008 29, 2008 31, 2008 31, 2008 31, 2008 Total Total Continuing Discontinued Continuing Discontinued Operations Operations Net operating income 86.4 (12.9) 73.5 137.2 (31.3) 105.9 Depreciation and 26.0 2.0 28.0 26.0 2.0 28.0 amortisation Impairments - - - - - - Adjusted EBITDA 112.4 (10.9) 101.5 163.2 (29.3) 133.9 Revenue 609.7 26.2 635.9 705.6 36.8 742.4 Adjusted EBITDA % 18.4% (41.6%) 16.0% 23.1% (79.6%) 18.0% Three Months Ended Three Months Ended August August August November November 30, November 31, 2008 31, 2008 31, 2008 30, 2008 2008 30, 2008 Total Total Continuing Discontinued Continuing Discontinued Operations Operations Net operating income 134.5 18.2 152.7 102.7 3.5 106.2 Depreciation and 27.8 2.0 29.8 30.6 2.0 32.6 amortisation Impairments - - - 1.8 (13.3) (11.5) Adjusted EBITDA 162.3 20.2 182.5 135.1 (7.8) 127.3 Revenue 639.2 114.1 753.3 567.9 104.7 672.6 Adjusted EBITDA % 25.4% 17.7% 24.2% 23.8% (7.4%) 18.9% Twelve Months Ended November November 30, November 30, 2008 2008 30, 2008 Total Continuing Discontinued Operations Net operating income 460.8 (22.5) 438.3 Depreciation and 110.4 8.0 118.4 amortisation Impairments 1.8 (13.3) (11.5) Adjusted EBITDA 573.0 (27.8) 545.2 Revenue 2,522.4 281.8 2,804.2 Adjusted EBITDA % 22.7% (9.9%) 19.4% Page 13 of 14
  • 14. ACERGY S.A. AND SUBSIDIARIES RECONCILIATION OF NET INCOME TO ADJUSTED EBITDA (In $ millions, except percentages) Three Months Ended Three Months Ended February February February May May May 29, 2008 29, 2008 29, 2008 31, 2008 31, 2008 31, 2008 Total Total Continuing Discontinued Continuing Discontinued Operations Operations Net income 48.4 (7.3) 41.1 90.2 (28.4) 61.8 Depreciation and 26.0 2.0 28.0 26.0 2.0 28.0 amortisation Impairments - - - - - - Investment income (5.7) - (5.7) (2.9) - (2.9) Other gains and losses 1.1 (1.1) - 4.1 (0.1) 4.0 Finance costs 9.2 - 9.2 5.2 - 5.2 Taxation 33.4 (4.5) 28.9 40.6 (2.8) 37.8 Adjusted EBITDA 112.4 (10.9) 101.5 163.2 (29.3) 133.9 Revenue 609.7 26.2 635.9 705.6 36.8 742.4 Adjusted EBITDA % 18.4% (41.6%) 16.0% 23.1% (79.6%) 18.0% Three Months Ended Three Months Ended August August August November November 30, November 31, 2008 31, 2008 31, 2008 30, 2008 2008 30, 2008 Total Total Continuing Discontinued Continuing Discontinued Operations Operations Net income 101.2 11.7 112.9 89.9 1.5 91.4 Depreciation and 27.8 2.0 29.8 30.6 2.0 32.6 amortisation Impairments - - - 1.8 (13.3) (11.5) Investment income (5.0) - (5.0) (4.3) - (4.3) Other gains and losses (14.4) 0.6 (13.8) (34.9) 1.7 (33.2) Finance costs 9.9 - 9.9 6.2 1.0 7.2 Taxation 42.8 5.9 48.7 45.8 (0.7) 45.1 Adjusted EBITDA 162.3 20.2 182.5 135.1 (7.8) 127.3 Revenue 639.2 114.1 753.3 567.9 104.7 672.6 Adjusted EBITDA % 25.4% 17.7% 24.2% 23.8% (7.4%) 18.9% Twelve Months Ended November November 30, November 30, 2008 2008 30, 2008 Total Continuing Discontinued Operations Net income 329.7 (22.5) 307.2 Depreciation and 110.4 8.0 118.4 amortisation Impairments 1.8 (13.3) (11.5) Investment income (17.9) - (17.9) Other gains and losses (44.1) 1.1 (43.0) Finance costs 30.5 1.0 31.5 Taxation 162.6 (2.1) 160.5 Adjusted EBITDA 573.0 (27.8) 545.2 Revenue 2,522.4 281.8 2,804.2 Adjusted EBITDA % 22.7% (9.9%) 19.4% - End - Page 14 of 14