SlideShare a Scribd company logo
1 of 60
ANNOTATED BIBLIOGRAPHY
1
ANNOTATED BIBLIOGRAPHY
2
Annotated Bibliography
Leila Bazzi
Dr. Zhong Xu Lui
Experimental Psychology
2-14-19
Article #1
Lin, C., Adolphs, R., & Alvarez, R. M. (2018). Inferring
Whether Officials Are Corruptible from Looking at Their
Faces. Psychological Science, 29 (11), 1807-1823.
In the target article, “Inferring Whether Officials Are
Corruptible from Looking at Their Faces”, the main topic is
inferring character traits from a facial expression as it relates to
a real-world outcome. This article provides an evaluation which
intends to find out how facial inferences is related to the
outcome that has a close connection with the face bearer’s mode
of behaving. The authors of the article aim at investigating
political officials on corruption based on their facial expression.
The main raise of using facial based conclusion in this study is
because facial inferences are able to guide people’s social
behavior due to the fact that facial expression is rich in
information. The study clearly shows that people can be able to
separate corrupt politicians from clean ones by simply looking
at portraits.
The article consisted of researchers gathering four preregistered
studies of 325 sample participants who filed through photos of
elected officials in order to make trait judgements of probable
corruptibility. Study 1 inspected state and federal officials,
whereas Study 2 examined officials from lower levels of
government. In Study 3, the researchers examined whether the
results from the previous studies correlated with corruptibility
reasoning. Furthermore, in Study 4 the researchers narrowed the
study down to the specific features of officials that appear them
to look corruptible. As stated, the experimental design in this
study was conducted through four different parts; this is where
the strength of the study can be based on, in which the
researchers collected pictures of politicians which were
presented to volunteers. The participants were asked to rate how
each politician was corrupt, selfish, generous, trustworthy, and
dishonest. The findings from the research raises many questions
which would otherwise provide a basis for future research. An
example of a question that I suspected to be unanswered is,
“What is the underlying mechanism for the relation between
possible corruption and politician’s records?” I think that the
findings from the article raise the question as to why politicians
who are corrupt are elected in office in the first place, seeming
as people are able to tell that they are corrupt simply by having
a look at them. The weaknesses of this study also include that
there are other factors, rather than a face-first impression, that
come into the picture and override initial face judgments.
Overall, the study investigated quite an interesting matter. With
that being said, my group has selected this topic to research
based off of our natural curiosity on the subject. Rather, instead
of looking at the face of an official as a whole, we are going to
be focusing on studying the eye vs. mouth region of their faces.
We chose to focus on the aforementioned face regions due to
the fact that they are the biggest indicators of lying or
deceiving. Therefore, participants paying closer attention to
these facial regions will hopefully help us in answering our
research question.
Articles from within the target article
Article #2
Cogsdill, E. J., Todorov, A. T., Spelke, E. S., & Banaji, M. R.
(2014). Inferring Character
from Faces: A Developmental Study. Psychological Science, 25,
1132–1139.
This article discusses many similar things as our target article
does, such as participants’ presuming a person’s character by
looking simply looking at computer-generated faces,
categorizing them to be low or high on perceived
trustworthiness, competence, or dominance. This article can
contribute to our project due to the correspondence of the study
as well as its results.
Article #3
Lin, C., Adolphs, R., & Alvarez, R. M. (2017). Cultural effects
on the association
between election outcomes and face- based trait inferences.
PLOS ONE, 12(7),
Article e0180837. doi:10.1371/journal.pone. 0180837
This article also heavily relates to the target article we
examined, correlating how competent a politician looks with
whether the politician gets elected. In addition, it goes further
to explain cultural differences in candidate appearances. For
example, the article dives into detail about how American
politicians tend to show more excited smiles in their candidacy
photos compared to Chinese politicians. All in all, these
cultural distinctions contribute to how face-based trait
assumptions that are made correlate with actual election
outcomes.
Article #4
Rule, N. O., Krendl, A. C., Ivcevic, Z., & Ambady, N. (2013).
Accuracy and consensus
in judgments of trustworthiness from faces: Behavioral and
neural correlates.
Journal of Personality and Social Psychology, 104, 409–426.
This article dives into the accuracy of first impression
judgements made by looking at faces. The results from this
article will definitely help us answer our research question
considering the authors conducted 5 different studies to
authenticate their findings.
Article #5
Todorov, A., Olivola, C. Y., Dotsch, R., & Mende-Siedlecki, P.
(2015). Social attributions from
faces: Determinants, con- sequences, accuracy, and functional
significance. Annual
Review of Psychology, 66, 519–545.
This article makes multiple points on how people make social
attributions from faces. To be specific, the article entails a
summary box which includes the various ways that influence
social attributions and how they are decided by looking at a
face. Taking note of the 8 points listed and keeping them in
mind while conducting our own research can help effectively
help us.
New articles
Article #6
Andrew D. Engell, James V. Haxby, and Alexander Todorov.
(2007) Implicit Trustworthiness
Decisions: Automatic Coding of Face Properties in the Human
Amygdala. Journal
of Cognitive Neuroscience 2007 Vol. 19, 1508-1519.
Among the articles I came across, this was one of the most
interesting. This study involved participants deciding whether
an unfamiliar face was trustworthy or not by using functional
magnetic resonance imaging to display amygdala response rates.
A study like this would definitely be beneficial for my group to
read before beginning our research.
Article #7
Suzuki, A., Tsukamoto, S., & Takahashi, Y. (2017). Faces Tell
Everything in a Just and
Biologically Determined World: Lay Theories Behind Face
Reading. Social
Psychological and Personality Science,10 (1), 62-72.
doi:10.1177/1948550617734616.
This article discusses multiple theories, specifically the
“physiognomic belief”, the generic belief that numerous traits
can simply be inferred from faces. Both countries, U.S. and
Japan heavily demonstrate this belief. As stated in the article,
“the physiognomic belief is positively associated with a
biologically deterministic view of personality traits and a belief
in a just world”. This research correlates directly with the study
we will be conducting.
Article #8
Kramer, R. S., Mileva, M., & Ritchie, K. L. (2018). Inter-rater
agreement in trait judgements
from faces. Plos One,13(8). doi:10.1371/journal.pone.0202655
This article stood out from the rest due to the type of study it
was. Kramer’s study dives into trait judgements from faces by
incorporating inter-rater reliability. This is when there are
multiple raters rating the same performance or behavior in order
to check for agreement in ratings. Using this type of reliability
only strengthens the study and solidifies its’ findings.
Article #9
Sakuta, Y., Kanazawa, S., & Yamaguchi, M. K. (2018). Infants
prefer a trustworthy person: An early sign of social cognition in
infants. Plos One,13(9). doi:10.1371/journal.pone.0203541
This article has many diverse aspects, starting with the study
itself. The participants of this study are infants, measuring their
preferability for trustworthy faces. To clarify previous studies
from adults, the researchers examined whether 6-8 month old
infants preferred a trustworthy face to an untrustworthy one
when both faces were high in dominance. The findings of this
study suggest that the perception of trustworthiness based on
facial images emerges early on in child development.
Coronel & Morris Chapter 1, Problems 5-9
Coronel & Morris Chapter 2, Problems 13-15
Chapter 1
#5 Identify and discuss the serious data redundancy problems
exhibited by the file structure shown in Figure P1.5
#6 Looking at the EMP_NAME and EMP_PHONE contents in
Figure P1.5, what change(s) would you recommend?
#7 Identify the various data sources in the file you examined in
Problem 5.
#8 Given your answer to Problem 7, what new files should you
create to help eliminate the data redundancies found in the file
shown in Figure P1.5?
#9 Identify and discuss the serious data redundancy problems
exhibited by the file structure shown in Figure P1.9
Chapter 2
#13 Describe the relationships (identify the business rules)
depicted in the Crow’s Foot ERD shown in Figure P2.13
#14 create a Crow’s Foot ERD to include the following business
rules for the ProdCo Company:
a. Each sales representative writes many invoices
b. Each invoice is written by one sales representative
c. Each sales representative is assigned to one department
d. Each department has many sales representatives
e. Each customer can generate many invoices
f. Each invoice is generated by one customer
#15 write the business rules that are reflected in the ERD shown
in Figure P2.15. (Note that the ERD reflects some simplifying
assumptions. For example, each book is written by only one
author. Also, remember that the ERD is always read from the
“1” to the “M” side, regardless of the orientation of the ERD
components.
https://doi.org/10.1177/0956797618788882
Psychological Science
2018, Vol. 29(11) 1807 –1823
© The Author(s) 2018
Article reuse guidelines:
sagepub.com/journals-permissions
DOI: 10.1177/0956797618788882
www.psychologicalscience.org/PS
ASSOCIATION FOR
PSYCHOLOGICAL SCIENCEResearch Article
Faces are rich in information: They provide clues about
gender, race, age, and trait attributes, which are inferred
spontaneously and ubiquitously (Engell, Haxby, &
Todorov, 2007; Todorov, 2017). Moreover, such infer-
ences often guide our social behavior—for instance, we
decide whom to trust on the basis of how trustworthy
a face looks (Rezlescu, Duchaine, Olivola, & Chater,
2012; Van’t Wout & Sanfey, 2008). Many trait judgments
made by participants across generations and cultures
show consensus (Cogsdill, Todorov, Spelke, & Banaji,
2014; Lin, Adolphs, & Alvarez, 2017; Rule et al., 2010).
But are trait judgments from faces accurate?
Previous research has shown that trait judgments
from faces can be associated with important real-world
social outcomes, such as dating and mating (Olivola
et al., 2014; Valentine, Li, Penke, & Perrett, 2014), earn-
ings and fundraising (Genevsky & Knutson, 2015;
Hamermesh, 2011; Ravina, 2012), science communica-
tion (Gheorghiu, Callan, & Skylark, 2017), sentencing
decisions (Berry & Zebrowitz-McArthur, 1988; Blair,
Judd, & Chapleau, 2004; Wilson & Rule, 2015; Zebrowitz
& McDonald, 1991), and leader selection (Todorov,
Mandisodza, Goren, & Hall, 2005; for reviews, see
Antonakis & Eubanks, 2017; Todorov, Olivola, Dotsch,
& Mende-Siedlecki, 2015). Yet this prior research on the
association between trait judgments from faces and real-
world outcomes leaves open two important questions.
First, most associations have focused on prosocial out-
comes (e.g., correlations between competence judg-
ments and election success; Todorov et al., 2005).
Second, most associations are plausibly driven not by
the behavior of the targets whose face is being judged
but by the interests of the perceivers who are making
the judgments (e.g., correlations between interesting-
looking scientists and the perceiver’s interest in their
work). Here, we investigated an antisocial judgment that
788882PSSXXX10.1177/0956797618788882Lin et al.Facial
Inferences and Corruption
research-article2018
Corresponding Author:
Chujun Lin, California Institute of Technology, Division of
Humanities
and Social Sciences, HSS 228-77, 1200 E. California Blvd.,
Pasadena,
CA 91125
E-mail: [email protected]
Inferring Whether Officials Are
Corruptible From Looking at Their Faces
Chujun Lin, Ralph Adolphs, and R. Michael Alvarez
Division of Humanities and Social Sciences, California Institute
of Technology
Abstract
While inferences of traits from unfamiliar faces prominently
reveal stereotypes, some facial inferences also correlate
with real-world outcomes. We investigated whether facial
inferences are associated with an important real-world
outcome closely linked to the face bearer’s behavior: political
corruption. In four preregistered studies (N = 325),
participants made trait judgments of unfamiliar government
officials on the basis of their photos. Relative to peers with
clean records, federal and state officials convicted of political
corruption (Study 1) and local officials who violated
campaign finance laws (Study 2) were perceived as more
corruptible, dishonest, selfish, and aggressive but similarly
competent, ambitious, and masculine (Study 3). Mediation
analyses and experiments in which the photos were digitally
manipulated showed that participants’ judgments of how
corruptible an official looked were causally influenced by
the face width of the stimuli (Study 4). The findings shed new
light on the complex causal mechanisms linking facial
appearances with social behavior.
Keywords
face perception, corruption, social attribution, stereotyping,
political psychology, open data, open materials,
preregistered
Received 9/25/17; Revision accepted 6/3/18
1808 Lin et al.
may offer a clearer insight into associations with the
judged person’s own behavior: political corruption.
Political corruption has been a major cause of regime
change and an important subject of much study in
political science and economics (Rose-Ackerman, 2013).
The possibility that corruptibility inferences from faces
might be associated with real-world measures of cor-
ruption is raised by three areas of previous research.
First, theories of self-fulfilling prophecy argue that the
impressions and expectations a face creates (e.g., how
corruptible an official looks) influence how other peo-
ple interact with the face bearer (e.g., how likely others
would be to bribe the official) and that those recurrent
interactions in turn shape the face bearer’s behavior so
as to confirm other people’s impressions and expecta-
tions (Haselhuhn, Wong, & Ormiston, 2013; Jussim,
1986; Slepian & Ames, 2016). Second, analyses of sen-
tencing decisions show that evaluations of guilt and
recommendations of punishment are influenced by the
defendant’s facial appearance (Berry & Zebrowitz-
McArthur, 1988; Blair et al., 2004; Wilson & Rule, 2015;
Zebrowitz & McDonald, 1991). These findings suggest
that officials who look more corruptible might be more
likely to be accused, prosecuted, and convicted. Third,
some studies have argued that the face contains a kernel
of truth about a person’s nature—such as personality and
criminal inclinations (Penton-Voak, Pound, Little, & Perrett,
2006; Valla, Ceci, & Williams, 2011)—even though the diag-
nostic validity and the causal mechanisms remain obscure.
Given past research, we hypothesized that elected
officials’ corruption records would be associated with
traits, such as corruptibility, inferred from their facial
appearances. We examined this association in three
preregistered studies, where participants made trait
inferences on the basis of the photos of unfamiliar
government officials. To account for the possibility that
this association might depend on the severity of corrup-
tion and the level of office, we inspected both serious
violations (i.e., cases considered political corruption)
and minor violations (i.e., cases meriting a fine) and
included officials at different levels of government (fed-
eral, state, and local). In a fourth preregistered study,
we explored which facial features might be causally
mediating the impression of how corruptible an official
was, using mediation analyses as well as experimental
manipulations of the face stimuli. In this fourth study,
we focused on metrics of facial structures—in particu-
lar, facial width (relative to facial height) because it has
been reported that men with wider faces are judged as
less trustworthy (Haselhuhn et al., 2013; Stirrat & Perrett,
2010), more threatening (Geniole, Denson, Dixson,
Carré, & McCormick, 2015), and less than fully human
(Deska, Lloyd, & Hugenberg, 2018), although it remains
unknown whether facial width-to-height ratio associates
with actual behavior.
We have reported all measures, all conditions, all
data exclusions, and how sample sizes were determined
in this article and on the Open Science Framework
(https://osf.io/k4mds/). All materials, data, and analysis
codes for the present research can be accessed at this
link.
Study 1
Our first study focused on federal and state officials
and compared those who had clean records with those
who were convicted of political corruption.
Method
Participants. This study was preregistered before data
collection began (https://osf.io/mge8r/). A sample size of
100 participants was predetermined on the basis of two
pilot studies—one carried out in the lab in May 2016 and
the other via Amazon’s Mechanical Turk (MTurk) in
October 2016. The lab study included 32 participants
recruited from the general public of Southern California,
and the MTurk study had 18 participants. For the hypoth-
esis that elected officials’ corruption records would be
associated with face-based inferences of corruptibility,
the laboratory pilot study yielded an estimated effect size
of 1.06, and the MTurk pilot study yielded an estimated
effect size of 1.05, justifying a minimum sample size of 16
participants. Given these results and to ensure sufficient
power even with dropout, we recruited 100 MTurk par-
ticipants in November 2016. We selected participants
who were native English speakers, located in the United
States, and 18 years old or older. In addition, they had to
have normal or corrected-to-normal vision, an educa-
tional attainment of high school or above, a good MTurk
participation history (a human-intelligence-task, or HIT,
approval rate ≥ 95% and ≥ 1,000 HITs approved), and no
prior participation in our pilot studies.
Eighteen individuals were excluded in total, 2 for
not being native English speakers, 6 for pressing the
same response key for all trials in a block, and 10 for
failing to input valid responses for more than 10% of
the trials in a block (responses were considered not
valid if missing or entered within 100 ms—the minimum
time needed for visual exploration of the face; Olivola
& Todorov, 2010). After exclusion, there were 82 par-
ticipants in our final sample (42 female; age: M = 39
years, SD = 12; 84% White, 10% Black, 5% Asian).
Stimuli. Stimuli were photos of 72 real elected officials.
All were Caucasian males who have held federal or state
legislative offices in the United States. Photos were offi-
cial headshots obtained from government websites and
personal campaign websites (63%), news articles (23%), and
Wikipedia (14%). All photos were converted to gray-scale
Facial Inferences and Corruption 1809
images on a plain gray background and cropped to a uni-
form size. All faces were frontal, smiling, in clear focus,
and centered in the middle of the image.
Among the 72 officials, half were convicted of
political corruption (corrupt officials), and the other
half had clean records (noncorrupt officials). The cor-
rupt officials were from two Wikipedia data sets (list of
American state and local politicians convicted of crimes:
https://en.wikipedia.org/wiki/List_of_American_state_
and_local_politicians_convicted_of_crimes; list of
American federal politicians convicted of crimes:
https://en.wikipedia.org/wiki/List_of_American_fed
eral_politicians_convicted_of_crimes). To reduce
sources of variability, we included only officials who
were Caucasian, were male, held federal or state legisla-
tive offices, and were convicted between 2001 and 2016
of political corruption conducted while in office (brib-
ery, money laundering, embezzlement, mail fraud, wire
fraud, tax fraud, conflict of interest, misusing funds,
misusing office, or falsifying records). In addition, age
information for these officials had to be publicly avail-
able, as did frontal photographs of acceptable clarity
in which the official was smiling. All photographs had
been taken while officials were in office. Most photos
of the corrupt officials had a known creation date, and
we confirmed that the photos were taken before their
conviction (72%); for the rest of the photos (28%), the
creation date was unknown (analyses were also per-
formed when excluding data for these stimuli; the pat-
tern of results did not change). The noncorrupt officials
were randomly matched from the list of incumbents
who had clean records, were holding the same office
in the same state, and were of the same gender, the
same race, and similar age (±12 years) as the corrupt
officials during the period of their misconduct. For
instance, if the stimuli contained a Caucasian male cor-
rupt official who was a member of the Arizona House
of Representatives during his misconduct at the age of
55, then a noncorrupt official would be randomly
selected from our available stimulus set from the list of
Arizona House of Representatives incumbents who had
a clean record and who was a Caucasian male between
the ages of 43 and 67.
Procedures. Participants were not informed of the pur-
pose of the study or the sampling of the stimuli. In par-
ticular, they were not given any information about the
percentage of politicians in our stimulus set who might
be corrupt in real life. They were told only that they
would view a series of politician photos and that they
should judge how corruptible, dishonest, selfish, trust-
worthy, and generous these politicians looked to them
(experiment instructions are available at https://osf.io/
k4mds/). Participants completed five blocks of experi-
ments, with each block corresponding to judging one trait
for all faces. The ordering of the faces within each block
as well as the ordering of the blocks were randomized.
Each block started with an instruction screen that
specified the trait to be judged (e.g., corruptibility).
Participants were instructed to make their decisions as
quickly and precisely as possible. Six practice trials
familiarized participants with the task. Participants
viewed photos of officials one at a time in randomized
order and made judgments. Each trial began with a
fixation cross, followed by the photo (1 s) with a 5-point
Likert scale below it. Scales were anchored with bipolar
adjectives (Fig. 1). Participants could make a decision
as soon as the photo appeared and within 4 s after the
photo disappeared. The orientation of the scale was
randomized across blocks, and scores were reverse-
coded as needed.
After completing all five blocks of ratings, partici-
pants were asked whether they had recognized any of
the officials and filled out a short survey questionnaire
0.5–1.5 s 1 s Maximum of 4 s 0.5 s
Time
Fig. 1. An example trial in the corruptibility-judgment block.
Each trial began with a fixation cross. Then a photo of an
official appeared for
1 s. The orientation of the scale was randomly flipped for each
block and each participant. Participants made a decision by
pressing one of
the number keys from “1” to “5” on their keyboard. As soon as
a valid key was pressed (or 4 s after the photo disappeared if no
valid key
was pressed), the trial ended, and there was a blank
interstimulus interval.
1810 Lin et al.
on demographic characteristics, political attitudes, and
personality.
Results
Reliability of face-based trait inferences. Following
our preregistered plan, we excluded from further analy-
sis any responses faster than 100 ms and data for officials
who were recognized. Among the 82 participants, 7 rec-
ognized one official (in total, four officials were recog-
nized). The percentages of participants who used the full
scale to rate the faces ranged from 59% to 68% across the
five traits, and over 90% of the participants used scores
on both sides of the midpoint to rate the faces (see Fig.
S1 in the Supplemental Material available online).
First, we checked whether participants gave consis-
tent judgments for a face across different traits. We
expected consistent ratings for a face on traits with the
same valence to be positively correlated and ratings on
traits with opposite valences to be negatively corre-
lated. Although this was not planned in our preregistra-
tion, we computed repeated measures correlations (the
R function rmcorr) to determine the common within-
individuals correlations for ratings between each pair
of traits, to handle the issue of nonindependence in
repeated measures. Results (see Table S1 in the Supple-
mental Material for coefficients and 95% confidence
intervals, or CIs) showed that at an individual level,
judgments of a face for traits with the same valence
were positively correlated (repeated measures rs rang-
ing from .24 to .31, ps < .001), and judgments of a face
for traits with opposite valences were negatively cor-
related (repeated measures rs ranging from –.30 to –.21,
ps < .001). Following our preregistered plan, we also
analyzed the consistency of these ratings at an aggre-
gate level. Ratings for each face were first averaged over
participants, and (tie-corrected) Spearman correlation
coefficients were calculated for each pair of traits with
those averaged ratings. Aggregate-level judgments for
a face were highly consistent across traits because they
averaged out the measurement noise inherent in the
individual-level correlations (|r| ≥ .75; see Table S2 in
the Supplemental Material).
Next, intraclass correlation coefficients (ICCs) were
computed for each trait separately to test whether infer-
ences of a trait showed consensus across participants—
ICCs were computed according to type ICC(2, k) on the
basis of complete cases. A high ICC indicates that the
total variance in ratings is mainly explained by rating
variance across images instead of across participants.
In line with prior literature (see the introduction), our
results showed high consensus among participants for
inferences of corruptibility, ICC = .81, F(48, 3888) = 6.4,
95% CI = [.73, .88]; dishonesty, ICC = .82, F(45, 3645) =
6.7, 95% CI = [.74, .89]; selfishness, ICC = .86, F(42,
3402) = 8.1, 95% CI = [.80, .91]; trustworthiness, ICC =
.82, F(43, 3483) = 6.7, 95% CI = [.74, .89]; and generos-
ity, ICC = .82, F(43, 3483) = 6.6, 95% CI = [.74, .89].
Association between corruption records and face-
based trait inferences: preregistered analyses. Our
primary interest in the current study was the extent to
which trait inferences from a face were associated with
actual corruption records. First, we followed the analysis
methods planned in our preregistration and tested for
these associations on the basis of inference judgments
aggregated across participants and individually within
subjects. For inferences of a negative trait, we deemed an
official to be categorized accurately if he was convicted
of corruption and received a high rating (> 3) or, con-
versely, if he had a clean record and received a low rating
(≤ 3); for inferences of a positive trait, we deemed an
official to be categorized accurately if he was convicted
of corruption and received a low rating (< 3) or, con-
versely, if he had a clean record and received a high rat-
ing (≥ 3).
One-sample, one-tailed proportion tests against
chance (50%) were performed on the aggregated-level
accuracies across officials. One-sample one-tailed
t tests against chance (50%) were performed on the
individual-level accuracies across participants (we also
calculated individual-level accuracies by categorizing
midpoint 3 in the opposite way; see Table S3 in the
Supplemental Material). Results (summarized in Table
1) showed that both aggregate-level and individual-
level inferences of traits were associated with actual
corruption records of the facial identities at a level
better than chance (see Fig. S2 in the Supplemental
Material for full distributions of individual-level
accuracies).
Association between corruption records and face-
based trait inferences: extensions to preregistered
analyses. Beyond our planned preregistered analyses,
we conducted three additional robustness checks on the asso-
ciation between trait inferences from faces and corruption
records. First, we confirmed that the above-chance accu-
racy we observed was not driven just by a small subset of
faces: For each trait, we ranked the officials by the num-
ber of participants who categorized them accurately; we
then calculated the average individual-level accuracy for
subsets of stimuli in which the officials were progres-
sively excluded one by one from the official who was
accurately categorized by most participants to the official
who was accurately categorized by fewest participants.
For all five traits, average individual-level accuracies
decreased smoothly as the highest ranked officials were
removed and stayed above chance even after the 12th
Facial Inferences and Corruption 1811
highest ranked official was excluded from the stimulus
set (see Table S4 in the Supplemental Material).
Second, although participants were not informed of
the purpose of the study or the percentage of corrupt
politicians in our stimulus set (they were told only that
these people were politicians), their beliefs (implicit or
explicit) about the base rates of corrupt politicians in
the real world or the percentage of corrupt politicians
in our experiment might bias the ratings they gave. We
corrected for such possibly idiosyncratic biases among
our participants by calculating individual-level accura-
cies using an alternative method. Ratings for each par-
ticipant were centered on that participant’s mean across
all of his or her ratings on a trait (see Fig. S3 in the
Supplemental Material for the full distributions of mean
ratings).
For this analysis, inferences of a negative trait were
deemed accurate if the official had been convicted of
corruption and received a rating from a participant that
was higher than the participant’s mean rating or, con-
versely, if the official had a clean record and received
a rating from a participant that was lower than the
participant’s mean rating; inferences of a positive trait
were deemed accurate if the official was convicted of
corruption and received a rating from a participant that
was lower than the participant’s mean rating or, con-
versely, if the official had a clean record and received
a rating from a participant that was higher than the
participant’s mean rating. One-sample, one-tailed t tests
against chance (50%) were performed on individual-
mean-centered accuracies across participants. Corrobo-
rating the results reported previously, individual-level
trait inferences correlated with officials’ corruption
records at a level better than chance, and the effect
sizes were large—corruptibility inferences: M = 55.57%,
SD = 7.75%, lower bound of 95% CI = 54.14%, t(81) =
6.50, p < .001, d = 0.72; dishonesty inferences: M =
55.12%, SD = 6.43%, lower bound of 95% CI = 53.94%,
t(81) = 7.22, p < .001, d = 0.80; selfishness inferences:
M = 54.95%, SD = 7.87%, lower bound of 95% CI =
53.50%, t(81) = 5.69, p < .001, d = 0.63; trustworthiness
inferences: M = 55.59%, SD = 6.53%, lower bound of 95%
CI = 54.39%, t(81) = 7.75, p < .001, d = 0.86; and gener-
osity inferences: M = 55.31%, SD = 6.95%, lower bound
of 95% CI = 54.03%, t(81) = 6.92, p < .001, d = 0.76.
Third, to address the concern that dichotomizing rat-
ings into accurate and inaccurate might lead to loss of
measurement sensitivity and to handle the nonindepen-
dence in ratings due to repeated measures designs, we
performed general linear mixed-model (GLMM) analyses
for inferences of each trait, respectively. Officials’ cor-
ruption records (1 = conviction, 0 = clean) were regressed
on individual-level ratings in logistic models, and par-
ticipants were treated as random factors (N = 5,757; N
was determined by the number of participants multi-
plied by the number of faces, excluding omitted obser-
vations; observations from a participant for a face would
be omitted if ratings were not available for all five traits).
In addition, photo characteristics (the official’s age and
smile intensity; the presence of glasses, a beard, a mus-
tache, and a bald head; image clarity; and image sources)
were included as control variables in all models. All
continuous variables were standardized.
We observed significant effects of trait ratings: Officials
who were rated as looking more corruptible, b = 0.23,
SE = 0.03, 95% CI = [0.17, 0.29], z = 7.66, p < .001; dis-
honest, b = 0.17, SE = 0.03, 95% CI = [0.11, 0.23], z =
5.75, p < .001; and selfish, b = 0.20, SE = 0.03, 95%
CI = [0.14, 0.26], z = 6.77, p < .001, were more likely to
have been convicted of corruption, whereas officials
who were rated as looking more trustworthy, b = −0.19,
SE = 0.03, 95% CI = [−0.25, −0.13], z = −6.41, p < .001,
and generous, b = −0.20, SE = 0.03, 95% CI = [−0.26,
−0.14], z = −6.59, p < .001, were less likely to have been
convicted of corruption (for complete lists of coeffi-
cients, see Table S5 in the Supplemental Material).
Table 1. Results for Correctly Categorized Officials Based on
Aggregate-Level Trait Inferences and Individual-Level
Trait Inferences From Study 1
Trait
Aggregate-level accuracy Average individual-level accuracya
Percentage of
correctly categorized
officials (N = 72)
Lower
bound of
95% CI χ2(1) p
Mean
accuracy
(N = 82) SD
Lower
bound of
95% CI t(81)
Cohen’s
d
Corruptibility 69.44% 59.22% 10.13 < .001 55.73% 6.95%
54.46% 7.47 0.82
Dishonesty 70.83% 60.67% 11.68 < .001 54.82% 6.41% 53.64%
6.81 0.75
Selfishness 66.67% 56.36% 7.35 .003 55.10% 6.76% 53.86%
6.83 0.75
Trustworthiness 68.06% 57.79% 8.68 .002 55.03% 6.41%
53.85% 7.10 0.78
Generosity 63.89% 53.53% 5.01 .013 54.97% 5.99% 53.87%
7.51 0.83
Note: CI = confidence interval.
aAll ps for this variable are less than .001.
1812 Lin et al.
Association between corruption records and face-
based trait inferences: further exploration of poten-
tial mechanisms. Finally, we performed two additional
analyses that were also beyond our preregistration. We
performed GLMM analyses on two subsets of data to test
two photo-selection–related mechanisms underlying the
face–corruption-record association we found. To test the
hypothesis that potential negative biases in the convicted
officials’ photos that were from sources beyond the con-
trol of the officials might be driving the association, we
conducted GLMM analyses on a subset of data that included
only officials whose photos were self-selected—that is,
those from government websites and personal campaign
websites (n = 45; 20 were convicted of corruption; in this
subset, only 1 official had a beard, and only 2 officials were
bald, and therefore these two predictors were removed
from the model).
The associations between trait inferences and records
remained significant—corruptibility inferences: b =
0.24, SE = 0.04, 95% CI = [0.17, 0.32], z = 6.81, p < .001;
dishonesty inferences: b = 0.19, SE = 0.04, 95% CI =
[0.12, 0.26], z = 5.21, p < .001; selfishness inferences:
b = 0.18, SE = 0.04, 95% CI = [0.11, 0.25], z = 5.07, p <
.001; trustworthiness inferences: b = −0.20, SE = 0.04,
95% CI = [–0.27, –0.13], z = −5.63, p < .001; and gener-
osity inferences: b = −0.17, SE = 0.04, 95% CI = [–0.24,
–0.10], z = −4.66, p < .001.
To test the hypothesis that potential negative biases
in the convicted officials’ photos that were taken after
conviction might be driving the face–corruption-record
association, we conducted GLMM analyses on a subset
of data that included only officials whose photo dates
were known (and were prior to the date of conviction,
for convicted officials; n = 62; 26 were convicted of
corruption). The associations between trait inferences
and records became weaker but remained significant—
corruptibility inferences: b = 0.17, SE = 0.03, 95% CI =
[0.10, 0.23], z = 4.93, p < .001; dishonesty inferences:
b = 0.11, SE = 0.03, 95% CI = [0.04, 0.18], z = 3.29, p =
.001; selfishness inferences: b = 0.16, SE = 0.03, 95%
CI = [0.09, 0.22], z = 4.64, p < .001; trustworthiness
inferences: b = −0.14, SE = 0.03, 95% CI = [–0.20, –0.07],
z = −4.06, p < .001; and generosity inferences: b = −0.19,
SE = 0.03, 95% CI = [–0.26, –0.13], z = −5.74, p < .001.
This indicates that while potential biases in photo selec-
tion can explain some of the relationship between trait
ratings and officials’ records, they cannot entirely
account for our main findings.
Two additional analyses were preregistered but are
not presented in this article; the codes to conduct those
analyses can be found at https://osf.io/k4mds/. In our
preregistration, we proposed an alternative approach
to analyze individual-level ratings (logistic regression
with adjusting standard errors for clustering). These
analyses are not presented here because the GLMM
analyses reported previously are more appropriate for
handling repeated measures. We had also planned
analyses of correlations between individual-level accu-
racies and response times, but these were intended to
answer a question that is beyond the scope of the cur-
rent article.
Study 2
Study 1 showed that compared with peers with clean
records, federal and state officials who were convicted
of political corruption were perceived as more corrupt-
ible, dishonest, and selfish and less trustworthy and
generous. To assess the generalizability of these find-
ings, we next tested whether they would also hold for
officials from lower levels of governments and for the
comparison between officials with clean records and
officials who violated campaign finance laws.
Method
Participants. This study was preregistered before data
collection began (https://osf.io/tgzpz/). A pilot study
with 24 MTurk workers conducted in February 2017
yielded an estimated effect size of 1.39, justifying a mini-
mum sample size of 10 participants. To ensure sufficient
power and to have a sample size comparable with that of
Study 1, we predetermined the sample size to be 100
participants. The same inclusion and exclusion criteria as
in Study 1 were applied (including exclusion of partici-
pants from Study 1). We excluded 22 individuals, 3 for
not being native English speakers, 2 for pressing the
same response key for all trials in a block, and 17 for fail-
ing to input valid responses for more than 10% of the
trials in a block. After these exclusions, there were 78
MTurk workers who participated in this study in Febru-
ary and March 2017 (33 female; age: M = 38 years, SD =
11; 83% White, 9% Black, 6% Asian).
Stimuli. Stimuli were photos of 80 real elected officials.
All officials were Caucasian males who held offices in
California state and local governments. Photos were official
headshots obtained from government websites and per-
sonal campaign websites (86%), news articles, and Wiki-
pedia (14%). All photos were converted to gray scale on a
plain gray background and were cropped to a uniform
size. All faces were frontal, smiling, in clear focus, and
centered in the middle of the image.
Among the 80 officials, half violated the California
Political Reform Act (officials with violations), and the
other half had clean records (officials without viola-
tions). The officials with violations were from the data-
base of the California Fair Political Practices Commission’s
Facial Inferences and Corruption 1813
“Enforcement Cases” (http://www.fppc.ca.gov/about-
fppc/hearings-meetings-workshops/current-agenda/
past-agendas.html). To reduce sources of variability, we
included only officials who were Caucasian, were male,
and had committed a violation related to election cam-
paigns (laundered campaign contributions, accepted
over-the-limit gifts and contributions, improperly used
campaign funds, had conflicts of interest, inadequately
or inaccurately reported on campaign statements, did
not file campaign statements or filed them late, or were
involved in illegal campaign coordination). In addition,
we included only successful candidates of the election
related to the violation, whose cases merited pursuit of
a fine over $215, whose cases were closed between
January 2015 and January 2017, whose age information
was publicly available, and who had publicly available
frontal photographs of acceptable clarity that featured
them smiling. All photographs had been taken while in
office. Most photos of the officials with violations had
a known creation date, and we confirmed that the pho-
tos were taken before the cases were closed (88%); for
the rest of the photos (12%), the creation date was
unknown (analyses were also performed when exclud-
ing data for these stimuli). The officials without viola-
tions were randomly generated from our available
stimulus set from the list of incumbents who had clean
records and were holding the same office in the state
of California and were the same gender, the same race,
and of similar age as the officials with violations.
Procedure. Participants followed the same experimental
procedure as in Study 1 but viewed a new set of stimuli,
as described previously.
Results
Reliability of face-based trait inferences. Follow-
ing our preregistered plan, we excluded responses
faster than 100 ms and responses for officials who were
recognized. Among the 78 participants, only 1 recog-
nized one official. As in Study 1, ratings across faces
given by each participant had sufficient variance: The
majority of participants used the full scale to rate the
faces (the percentages of participants ranged from 58% to
63% across the five traits), and more than 97% of the par-
ticipants used scores on both sides of the midpoint to
rate the faces (see Fig. S4 in the Supplemental Material).
To test how consistently a participant judged a face
across different traits, we computed repeated measures
correlations (using the R function rmcorr) following
the method in Study 1. A participant’s ratings of a face
on traits with the same valence were positively correlated
(repeated measures rs ranging from .26 to .35, ps < .001),
and ratings on traits with opposite valences were
negatively correlated (repeated measures rs ranging
from –.38 to –.26, ps < .001; see Table S6 in the Supple-
mental Material for coefficients and 95% CIs). As
planned in our preregistration, we also computed (tie-
corrected) Spearman correlation coefficients for each
pair of traits using ratings averaged over participants
for each face. Aggregate-level judgments of a face were
once again highly consistent across traits (|r| ≥ .77; see
Table S7 in the Supplemental Material).
In line with Study 1 and prior literature, we observed
high consensus among participants for face-based judg-
ments of corruptibility, ICC = .81, F(64, 4928) = 6.3, 95%
CI = [.75, .87]; dishonesty, ICC = .82, F(61, 4697) = 6.7,
95% CI = [.75, .87]); selfishness, ICC = .82, F(45, 3465) =
6.2, 95% CI = [.74, .89]; trustworthiness, ICC = .86, F(58,
4466) = 8.6, 95% CI = [.81, .91]; and generosity, ICC =
.87, F(56, 4312) = 8.9, 95% CI = [.82, .91]. ICCs were
computed according to type ICC(2, k) on the basis of
complete cases.
Association between records of violations and face-
based trait inferences: preregistered analyses. Fol-
lowing the methods in Study 1, we calculated the proportions
of correctly categorized officials for each trait on the basis
of aggregate-level inferences and individual-level infer-
ences as planned in our preregistration. Table 2 summa-
rizes one-sample one-tailed proportion-test statistics of
aggregate-level accuracies and one-sample one-tailed t-test
statistics of individual-level accuracies (see Fig. S5 in the
Supplemental Material for full distributions of individual-
level accuracies; see Table S8 in the Supplemental Material
for average individual-level accuracies calculated with cat-
egorizing midpoint 3 in an opposite way). The findings
replicated those from Study 1.
Association between corruption records and face-
based trait inferences: extensions to preregistered
analyses. As in Study 1, we conducted three analyses in
addition to those we had preregistered to check the
robustness of the association between trait inferences
from officials’ faces and the records of violations of the
facial identities. First, we verified that the above-chance
accuracy observed earlier was not driven just by a small
subset of faces. Following the same approach as Study 1,
we recalculated individual-level accuracies for subsets of
stimuli in which the stimulus was excluded one by one
from the official who was accurately categorized by most
participants to the official who was accurately catego-
rized by the fewest participants. Average individual-level
accuracies for each trait decreased smoothly as the high-
est ranked officials were progressively excluded and
stayed above chance even after the 14th highest ranked
official was excluded from the stimulus set (see Table S9
in the Supplemental Material).
1814 Lin et al.
Second, participants’ beliefs (implicit or explicit)
about the base rates of corrupt politicians in the real
world or the percentage of corrupt politicians in our
study might have influenced their trait judgments from
politicians’ faces. Consequently, we computed the
individual-level accuracies using an alternative method
that took into account the heterogeneous beliefs of
base rates across participants. As in Study 1, a mean
rating was computed for each participant by averaging
the ratings he or she gave across all faces for a trait
(see Fig. S6 in the Supplemental Material for the full
distributions of mean ratings). This mean rating was
used as a cutoff for dichotomizing whether the partici-
pant’s rating correctly categorized an official. These
individual-mean-centered accuracies across participants
were then tested against chance (50%). We observed
significantly above-chance accuracies and large effect
sizes for corruptibility inferences, M = 55.06%, SD =
6.98%, lower 95% CI = 53.74%, t(77) = 6.40, p < .001,
d = 0.72; dishonesty inferences, M = 56.06%, SD = 7.32%,
lower 95% CI = 54.68%, t(77) = 7.31, p < .001, d = 0.83;
selfishness inferences, M = 55.74%, SD = 7.98%, lower
95% CI = 54.24%, t(77) = 6.36, p < .001, d = 0.72; trust-
worthiness inferences, M = 56.00%, SD = 7.05%, lower
95% CI = 54.67%, t(77) = 7.52, p < .001, d = 0.85; and
generosity inferences, M = 55.61%, SD = 6.62%, lower
95% CI = 54.36%, t(77) = 7.48, p < .001, d = 0.85.
Third, data were further analyzed in GLMM analyses
to handle the nonindependence in ratings due to the
repeated measures design and avoid any data dichoto-
mization. Officials’ records of violations (1 = violation,
0 = clean) were regressed on individual-level ratings in
logistic models, and participants were treated as ran-
dom factors (N = 6,115; N was determined by the num-
ber of participants multiplied by the number of faces
excluding omitted observations; observations from a
participant for a face would be omitted if ratings were
not available for all five traits). In addition, photo
characteristics (the official’s age and smile intensity; the
presence of glasses, a beard, a mustache, and a bald
head; image clarity; and image sources) were included
as control variables in all models. All continuous vari-
ables were standardized. Results revealed significant
effects of trait ratings: Officials who were rated as look-
ing more corruptible, b = 0.24, SE = 0.03, 95% CI = [0.18,
0.29], z = 8.19, p < .001; dishonest, b = 0.28, SE = 0.03,
95% CI = [0.23, 0.34], z = 9.77, p < .001; and selfish,
b = 0.27, SE = 0.03, 95% CI = [0.21, 0.32], z = 9.31, p <
.001, were more likely to have violated campaign
finance laws, whereas officials who were rated as look-
ing more trustworthy, b = −0.26, SE = 0.03, 95% CI =
[–0.32, –0.20], z = −9.05, p < .001, and generous, b =
−0.27, SE = 0.03, 95% CI = [–0.33, –0.22], z = −9.53, p <
.001, were less likely to have violated campaign finance
laws (for complete lists of coefficients, see Table S10
in the Supplemental Material).
Association between corruption records and face-
based trait inferences: further exploration of poten-
tial mechanisms. Finally, to elucidate whether the ob -
served associations between trait judgments from faces
and records of violations of the facial identities might in
part be attributable to unintended properties of photo
sources, we performed GLMM analyses on two subsets of
data, respectively. For one subset of data, we excluded
officials whose photos were not self-selected—that is, we
included only officials whose photos were from govern-
ment websites and personal campaign websites (N = 69;
33 violated campaign finance laws). Trait inferences based
on photos self-selected by the officials were significantly
associated with the officials’ records of violations—cor-
ruptibility inferences: b = 0.23, SE = 0.03, 95% CI = [0.17,
0.29], z = 7.48, p < .001; dishonesty inferences: b = 0.26,
SE = 0.03, 95% CI = [0.20, 0.32], z = 8.68, p < .001; selfish-
ness inferences: b = 0.25, SE = 0.03, 95% CI = [0.19, 0.31],
z = 8.37, p < .001; trustworthiness inferences: b = −0.25,
Table 2. Results for Correctly Categorized Officials Based on
Aggregate-Level Trait Inferences and Individual-Level
Trait Inferences From Study 2
Trait
Aggregate-level accuracy Average individual-level accuracya
Percentage of
correctly categorized
officials (N = 80)
Lower
bound of
95% CI χ2(1) p
Mean
accuracy
(N = 78) SD
Lower
bound of
95% CI t(77)
Cohen’s
d
Corruptibility 67.50% 57.79% 9.11 .001 54.72% 6.59%
53.48% 6.32 0.72
Dishonesty 70.00% 60.38% 12.01 < .001 56.15% 6.51% 54.92%
8.34 0.94
Selfishness 65.00% 55.23% 6.61 .005 55.78% 7.21% 54.42%
7.08 0.80
Trustworthiness 70.00% 60.38% 12.01 < .001 56.00% 6.31%
54.74% 7.98 0.90
Generosity 67.50% 57.79% 9.11 .001 55.80% 5.51% 54.76%
9.29 1.05
Note: CI = confidence interval.
aAll ps for this variable are less than .001.
Facial Inferences and Corruption 1815
SE = 0.03, 95% CI = [–0.31, –0.19], z = −8.31, p < .001; and
generosity inferences: b = −0.25, SE = 0.03, 95% CI =
[–0.31, –0.19], z = −8.15, p < .001.
To test the hypothesis that potential negative biases
in photos of officials with violations if the photos were
taken after the violation was caught might be driving
the face–corruption-record association, we performed
GLMM analyses on a subset of data that included only
officials for whom the dates on which their photo was
taken was known (and were taken prior to the date
when the violation was caught, for officials with viola-
tions; n = 75; 35 violated campaign finance laws). The
associations between trait inferences and records
remained significant: corruptibility inferences, b = 0.25,
SE = 0.03, 95% CI = [0.19, 0.31], z = 8.33, p < .001; dis-
honesty inferences, b = 0.29, SE = 0.03, 95% CI = [0.24,
0.35], z = 9.78, p < .001; selfishness inferences, b = 0.29,
SE = 0.03, 95% CI = [0.23, 0.34], z = 9.56, p < .001;
trustworthiness inferences, b = −0.28, SE = 0.03, 95%
CI = [–0.33, –0.22], z = −9.27, p < .001; and generosity
inferences, b = −0.30, SE = 0.03, 95% CI = [–0.36, –0.24],
z = −10.17, p < .001.
The analysis of the correlation between individual-
level accuracies and response times was also planned.
Results are not detailed here because these analyses
intended to answer a question that is beyond the scope
of the current article. For readers interested in these
results, all relevant data and analysis codes can be
accessed at https://osf.io/k4mds/.
Study 3
Study 2 replicated the face–record association found in
Study 1 with an independent set of stimuli. However,
these findings were based on traits that either were
close in meaning to corruptibility (selfishness, dishon-
esty) or have the opposite meaning from it (trustworthi-
ness, generosity). This resulted in our findings deriving
from a single underlying factor with no comparison to
different traits. Study 3 therefore aimed to test that the
effects found in Studies 1 and 2 could be attributed
specifically to corruptibility judgments.
Method
Participants. This study was preregistered before data
collection began (https://osf.io/7a7eu/). To ensure a
sample size comparable with that used in Study 1, we
recruited 100 participants via MTurk. The same inclusion
and exclusion criteria as in Study 1 were applied; in addi-
tion, participants were required to have no prior partici-
pation in Study 1. We excluded 15 individuals, 2 for not
being native English speakers, 2 for pressing the same
response key for all trials in a block, and 11 for failing to
input valid responses for more than 10% of the trials in a
block. After exclusions, data were retained from 85 par-
ticipants who were recruited from MTurk in February
and March 2017 (42 female; age: M = 37 years, SD = 10;
88% White, 6% Black, 4% Asian).
Stimuli and procedure. We used stimuli identical to
those from Study 1 and a protocol similar to that of Study
1 except that participants evaluated the officials on a dif-
ferent set of traits: corruptibility, aggressiveness, mascu-
linity, competence, and ambitiousness.
Results
Reliability of face-based trait inferences. We excluded
from further analysis any responses faster than 100 ms
and responses for officials who were recognized. Among
the 85 participants, 3 recognized at least one official (in
total, two officials were ever recognized).
We first checked the variation of individual-level rat-
ings across faces for each trait. For all the four traits
except masculinity, the majority of participants used
the full scale to rate the faces, and over 92% of the
participants used scores on both sides of the midpoint
to rate the faces (see Fig. S7 in the Supplemental Mate-
rial). Not surprisingly, given that all the officials were
male, ratings for masculinity were skewed toward mas-
culine; however, 80% of the participants still rated the
faces on masculinity using scores on both sides of the
midpoint.
Participants showed high consensus on face-based
trait judgments for corruptibility, ICC = .86, F(52, 4368) =
8.7, 95% CI = [.80, .91]; aggressiveness, ICC = .85, F(54,
4536) = 8.3, 95% CI = [.79, .90]; masculinity, ICC = .89,
F(53, 4452) = 13.6, 95% CI = [.85, .93]; and competence,
ICC = .84, F(58, 4872) = 8.4, 95% CI = [.78, .89]; and the
consensus on ambitiousness judgments was fair, ICC =
.69, F(53, 4452) = 3.9, 95% CI = [.57, .79]. ICCs were
computed according to type ICC(2, k) based on com-
plete cases.
Association between corruption records and face-
based trait inferences. Critically, we replicated the results
found in Study 1 with this new set of participants: Officials
who were convicted of political corruption looked more
corruptible than their peers with clean records, aggregate-
level accuracy = 72.22%, lower 95% CI = 62.12%, χ2(1) =
13.35, p < .001; average individual-level accuracy = 56.30%,
SD = 7.22%, lower 95% CI = 55.00%, t(84) = 8.04, d = 0.87,
p < .001. Additionally, participants in Study 1 and the pres-
ent study viewed the same set of stimuli, and their judg-
ments (averaged over participants within each study) of
how corruptible a face looked were highly correlated, ρ =
0.88, 95% CI = [0.81, 0.92], p < .001.
1816 Lin et al.
Interestingly, data from the present study revealed that
officials who were perceived as more aggressive were
also more likely to have been convicted of political cor-
ruption, aggregate-level accuracy = 66.67%, lower 95%
CI = 56.36%, χ2(1) = 7.35, p = .003; average individual-
level accuracy = 55.09%, SD = 6.13%, lower 95% CI =
53.98%, t(84) = 7.66, d = 0.83, p < .001. However, the
associations between corruption records and inferences
of masculinity, ambitiousness, and competence were not
statistically reliable (95% CIs included 50%, and ps were
> .01 for aggregate-level accuracies).
Correlation structure of trait inferences. Our pri-
mary interest in the current study was whether the
observed face–corruption-record associations resulted
from inferences of specific traits or global valence evalu-
ations of the face. We first analyzed the correlation struc-
ture of the trait inferences. To allow for analyses across
all nine traits (those from Study 1 and Study 3 combined),
we first averaged inferences of traits across participants
for each face, and then these aggregate-level data were
merged across Study 1 and the present study. Figure 2
shows the Spearman correlation coefficients between
each pair of traits. All correlations were in expected
directions and generally strong, except for masculinity
and ambitiousness.
A principal component analysis with varimax rotation
indicated that these trait inferences clustered on three
distinctive factors: a corruptibility-related factor (corrupt-
ibility, dishonesty, selfishness, aggressiveness, generosity,
and trustworthiness), a competence-related factor (com-
petence and ambitiousness), and a masculinity-related
factor (masculinity), each accounting for 57%, 19%, and
15% of the variance in the data, respectively (see Table
S11 in the Supplemental Material). A composite score
was computed for each factor with the trait inferences
that comprised it (Todorov et al., 2005; for the corrupt-
ibility-related factor, positive and negative traits were
aggregated with opposite signs). Importantly, logistic
regression analyses with each of these three factors
independently while controlling for other covariates
demonstrated that only the corruptibility-related factor
was associated with corruption records (Fig. 3).
Study 4
Study 3 demonstrated that elected officials’ corruption
records were associated with specific trait inferences
(e.g., corruptibility). A final important question concerns
the facial features that make some officials look more
corruptible than others. Study 4 provided a preliminary
exploration of this question by first estimating the rela-
tionship between objective facial structures, inferences
of traits, and officials’ records with causal mediation
models (Study 4a; not preregistered). Second, the causal
effects suggested by the mediation analysis were directly
Fig. 2. Spearman correlation coefficients between each pair of
traits across Study 1 and
Study 3, calculated with aggregate-level trait ratings (N = 72).
Inferences of corruptibility
were averaged over the two studies.
Facial Inferences and Corruption 1817
tested in an experiment that manipulated the face stim-
uli (Study 4b; preregistered).
Study 4a
Method. Study 1 and Study 2 collected judgments of a
common set of traits (corruptibility, dishonesty, selfish-
ness, trustworthiness, and generosity) for two distinct sets
of officials. The present study merged data from both
studies. For trait judgments of an official given by a par-
ticipant, we computed a composite score using his ratings
across the five traits and referred to it as corruptibility-
related trait inferences.
Officials were those used in Study 1 and Study 2.
Whether an official is corrupt was measured by his
record. A record of conviction of political corruption
or violation of campaign finance laws suggests that an
official is corrupt, and a clean record suggests an offi-
cial is not corrupt. Officials’ records are one metric of
real-world corruption, but the potential measurement
error of this metric is beyond the scope of the present
study.
Eight metrics representing the distances between
facial landmarks specified by anthropometric definitions
were measured (Farkas, 1994; Stirrat & Perrett, 2010).
Stimuli were the photos of the elected officials used in
Study 1 and Study 2. We adjusted for shifts in posture
or tilts in head angle by making all measurements only
on one side of the face—the side turned most toward
the camera—and by generating a face-based reference
frame—the horizontal axis of the face was defined by
the line connecting the two pupils, and the vertical axis
was defined by the line through landmark n (for nasion)
that was perpendicular to the horizontal axis (Fig. 4).
Summary statistics of these metrics are reported in the
Supplemental Material (Table S12).
Results. Studies 1 to 3 demonstrated that officials who
had clean records were judged differently on corruptibil-
ity than officials who were convicted of political corrup-
tion and those who violated campaign finance laws. To
test the hypothesis that the perceptual difference was
mediated by certain facial structures, we analyzed a
causal mediation model linking whether an official is cor-
rupt, corruptibility-related trait inferences, and each facial
structure with data from Study 1 and Study 2 (Fig. 5). The
effect of whether an official is corrupt on the facial struc-
ture (path a) and the effect of the facial structure on
Factor
Age at Time
of Photo
Glasses
Bald Head
Beard
Mustache
Smile Intensity
Megapixels
Image Sources:
Wikipedia
Image Sources:
News Articles
–5 0 5
Coefficient
10
Masculinity Factor Competence Factor Corruptibility Factor
Fig. 3. Unstandardized logistic regression (N = 72) coefficients
for factors and photo characteristics as regressors of the
officials’ corruption records (1 = conviction, 0 = clean) in
Study 3. Thick lines represent 90% confidence intervals, and
thin lines represent 95% confidence intervals. Glasses is a
dummy variable with 1 indicating the official wore glasses.
Bald head is a dummy variable with 1 indicating the official
was bald. Beard is a dummy variable with 1 indicating
the official had a beard. Mustache is a dummy variable with 1
indicating the official had a mustache. Smile intensity
was coded manually with three levels (1 = smile with no teeth
exposed, 2 = smile with teeth but not gums exposed,
3 = smile with gums exposed). There were three sources of
photos: government and campaign websites (benchmark),
Wikipedia, and news articles. All variables were normalized
into the range of [0, 1].
1818 Lin et al.
corruptibility-related trait inferences controlling for whether
an official is corrupt (path b) constitute the indirect effect
from whether an official is corrupt to corruptibility-related
trait inferences (path ab). Path a was estimated with lin-
ear regression models. Path b was estimated with linear
mixed models in which subjects, images nested within
record types, and the interactions between subjects and
record types were treated as random factors. The indirect
effect was estimated with RMediation in R. The direct
effect (path c′ ) of whether an official is corrupt on cor-
ruptibility-related trait inferences after controlling for the
indirect effect was estimated in the same model as for
path b. Photo characteristics (the official’s age and smile
intensity; the presence of glasses, a beard, a mustache,
and a bald head; image clarity; and image sources) were
included as covariates in all models; for simplicity, these
paths are not depicted in the figure.
Two of the eight facial structures were identified to
have significant indirect effects: facial width-to-height
ratio (unstandardized coefficient for path ab = 0.06,
SE = 0.03, 95% CI = [0.01, 0.12]), and face width/lower
face height (unstandardized coefficient for path ab =
0.11, SE = 0.04, 95% CI = [0.04, 0.18]). These results
revealed that compared with officials who had clean
records, those who were convicted of political corrup-
tion and violated campaign finance laws were perceived
more negatively (more corruptible, dishonest, and selfish
and less trustworthy and generous), and these negative
impressions were partially attributable to higher facial
width-to-height ratio and face width/lower-face height.
Study 4b
Study 4a suggests that compared with officials with
slimmer faces, officials with wider faces were judged
more negatively on corruptibility-related traits. This
finding raises an important question: Given the same
elected official, is how corruptible he looks influenced
by how wide his face is in a photo? Study 4b directly
tested this causal hypothesis by manipulating the facial
width of the photos and contrasting the degree of cor-
ruptibility inferred from the slim, original, and fat ver-
sion photos of the same official.
Method.
Stimuli. This study was preregistered before data col-
lection began (https://osf.io/58x6e/). Stimuli were 450
black-and-white headshots of real elected officials. There
were three versions of the stimuli: original, fat, and slim.
Original stimuli consisted of 71 photos from Study 1
and 79 photos from Study 2 (1 photo from Study 1 and
1 photo from Study 2 were excluded from the present
study because the manipulation of face width distorted
these two faces). These 150 original stimuli were further
manipulated with the Adobe Photoshop Face-Aware
Liquify tool to increase face width by 7% and decrease
face width by 7%, which resulted in two additional ver-
sions of each facial identity (see Fig. 6 for an example;
all stimuli used in the present study can be accessed
at https://osf.io/k4mds/). Fat stimuli consisted of the
150 photos with increased face width, and slim stimuli
consisted of the 150 photos with decreased face width.
Fig. 4. Illustration of facial landmarks (white points) and the
coor-
dinate system (red lines). Facial width-to-height ratio was
calculated
as the bizygomatic width (the horizontal distance from landmark
zy
to the y-axis multiplied by 2) divided by the upper-face height
(the
vertical distance from the highest point of the upper lip to the
highest
point of the eyelids). Face width/lower-face height was
calculated as
the bizygomatic width divided by the lower-face height (the
vertical
distance between landmark ex and landmark gn). Lower
face/face
height was calculated as the lower-face height divided by the
physi-
ognomic face height (the vertical distance between landmark tr
and
landmark gn). Cheekbone prominence was calculated as the
bizygo-
matic width divided by the jawbone width (the horizontal
distance
from landmark go to the y-axis multiplied by 2). Internal eye-
corner
distance was calculated as the ratio of the internal eye-corner
width
(the horizontal distance from landmark en to the y-axis
multiplied
by 2) to the bizygomatic width. Nose height was calculated as
the
ratio of the nose length (the vertical distance from landmark n
to
landmark sn) to the lower face height. Mouth width was
calculated
as the ratio of the mouth corner distance (the horizontal
distance
from landmark ch to the y-axis multiplied by 2) to the jawbone
width.
Nose/mouth width was calculated as the ratio of the nose width
(the
horizontal distance from landmark al to the y-axis multiplied by
2)
to the mouth corner distance.
Facial Inferences and Corruption 1819
This percentage of face-width change was the maximum
manipulation we could achieve subject to the constraints
that all faces should look natural and the manipulation
should be subtle enough to go unnoticed.
Participants. To investigate our main hypothesis that
the same official would be judged as more corruptible
when his face was fatter relative to when it was slimmer,
we conducted a pilot study on MTurk with 18 partici-
pants, which yielded 2,700 observations. These obser-
vations gave an estimated effect size of 0.09, justifying
a minimum sample size of 16 participants and 2,375
observations. To ensure sufficient power even with data
exclusion, we predetermined the sample size to be 100
participants. Participants were required to be located in
the United States, to be 18 years old or older, and to have
normal or corrected-to-normal vision, an educational
attainment of high school or above, a HIT approval rate
greater than or equal to 95%, and no prior participation
in the pilot study. Additionally, two open-ended ques-
tions and one closed-ended question in the survey at the
end of the experiment (Table S13 in the Supplemental
Material) gauged whether participants noticed that the
width of the faces was manipulated; participants who
mentioned face width to any of the open-ended ques-
tions were excluded from data analysis.
Only 1 participant recognized that the face width of
the stimuli was manipulated; this individual was
excluded from data analyses. Another 19 participants
were excluded for failing to input valid responses for
more than 10 trials. After exclusions, the final sample
consisted of 80 participants (37 female; age: M = 38
years, SD = 10; 89% White, 5% Black, 5% Asian), who
were recruited from MTurk in July 2017.
Procedures. Participants were not informed about the
purpose of the study (they were told only that this was
a study about judging how corruptible politicians looked
Facial Width-to-Height Ratio
Corruptibility-Related Trait InferencesWhether an Official Is
Corrupt
Path a:
0.13* (0.05)
Path b:
0.45*** (0.11)
Path c′:
0.28*** (0.05)
Path ab:
0.06* (0.03), 95% CI = [0.01, 0.12]
Face Width/Lower Face Height
Corruptibility-Related Trait InferencesWhether an Official Is
Corrupt
Path a:
0.11*** (0.03)
Path b:
0.96*** (0.22)
Path c′:
0.26*** (0.05)
Path ab:
0.11** (0.04), 95% CI = [0.04, 0.18]
a
b
Fig. 5. Results of causal mediation analyses showing the
influence of whether an official is corrupt on corruptibility-
related trait infer-
ences, as mediated by facial structures (Study 4a). A mediation
model was constructed for each of the eight facial metrics
separately and
was tested with data from Study 1 and Study 2. Two of the eight
facial metrics, (a) face width-to-height ratio and (b) face
width/lower-face
height, showed significant indirect effects. Unstandardized
coefficients are shown, and standard errors are given in
parentheses. Coef-
ficients for path a were estimated in linear regression models.
Coefficients for path b and path c′ were estimated in linear
mixed models.
The indirect effects of path ab were estimated with RMediation
in R. Photo characteristics were included as covariates in all
models; for
simplicity, these variables and the corresponding paths are not
depicted in the figure. No indirect effect was found for the other
six facial
metrics. Asterisks indicate significant paths (*p < .05, **p <
.005, ***p < .0005). CI = confidence interval.
1820 Lin et al.
on the basis of their photos). They were instructed to
make their decisions as quickly and precisely as pos-
sible. Participants viewed and evaluated the 450 stimuli
one at a time in 10 blocks; they had the option to take
breaks between blocks. The order of the 450 stimuli
was randomized under a constraint that different ver-
sions of photos of the same facial identity did not appear
within 10 consecutive images. Participants indicated how
corruptible each face looked on a 9-point Likert scale
anchored with bipolar adjectives (corruptible and incor-
ruptible) and were encouraged to use the full range to
rate the faces. The orientation of the scale was random-
ized for each participant. Except for the change of the
Likert scale, the present study followed the same experi-
mental procedures as the previous studies. After rating all
stimuli, participants were asked whether they had recog-
nized any of the officials or noticed that the width of the
faces were manipulated (see Table S13) and filled out a
short survey questionnaire on demographic characteris-
tics, political attitudes, and personality.
Results. The survey responses revealed that when told
that photos of the same politicians were shown more
than once during the experiment and asked whether
photos of the same politician were used, 61 of the 80
participants reported that they believed the repeated
photos of the same politician were identical. The rest of
the participants either indicated that they were not sure
whether the photos of the same politician were different
or identical (n = 3) or mentioned that the faces in these
photos might have different facial expressions (n = 4),
hair or facial hair (n = 4), smile intensity (n = 3), eyes
(n = 1), glasses (n = 1), or head shapes (n = 1); the indi-
vidual pictured might be wearing different clothing (n =
1); or some photos looked scarier (n = 1), might be
mixed with parts from other pictures (n = 1), or might be
taken from different angles (n = 1).
Most of the participants (71.25%) used the full range
to rate the faces as instructed, and all participants used
both sides of the scale to rate the faces. Data were
analyzed in linear mixed models, and subjects, images,
and the interactions between subjects and versions
were treated as random factors. As hypothesized,
individual-level data showed that face width had a sig-
nificant effect on inferences of corruptibility; specifi-
cally, a participant perceived an official as more
corruptible when his face was fat relative to when his
face was slim, b = 0.06, SE = 0.02, 95% CI = [0.03, 0.09],
p < .001, d = 0.22. This unconscious perceptual bias
was symmetrically driven by increasing face width, b =
0.06, SE = 0.02, 95% CI = [0.02, 0.11], p = .008, d = 0.22,
and decreasing face width, b = 0.06, SE = 0.03, 95%
CI = [0.02, 0.11], p = .025, d = 0.22. We further ana-
lyzed whether the perceptual bias to rate the fat version
of a face as more corruptible than the slim version of
that face varied as a function of the baseline corrupt-
ibility rating of the original photo, as planned in our
preregistration. The ratings for each official in each ver-
sion of the photo were first averaged over participants,
and then these aggregate-level ratings for different pho-
tos of the same official were used to calculate perceptual
biases. We did not observe significant correlation
Fig. 6. Example of the same face in (a) slim, (b) original, and
(c) fat versions.
Facial Inferences and Corruption 1821
between perceptual bias (fat vs. slim versions of the
photo) and the corruptibility inferences based on the
original version of the photo, ρ = 0.01, SE = 0.03, 95%
CI = [–0.06, 0.07], p = 0.789 (photo characteristics were
included as control variables; see Fig. S8 in the Supple-
mental Material).
General Discussion
Across three preregistered studies, we found evidence
supporting the hypothesis that trait-specific inferences,
such as corruptibility, made from photographs of offi-
cials’ faces are associated with real-world measures of
political corruption and violation. This association was
replicated across officials at different levels of govern-
ment. It was not driven by just a small subset of faces
or fully explained by other photo characteristics, such
as smile intensity. The association remained robust
when analyses controlled for heterogeneous beliefs
about corruption base rates and potential photo-
selection biases.
It is important to distinguish accuracy as defined by
agreement with consensus judgments from accuracy
related to actual real-world metrics (Funder, 1987).
Similar to prominent studies of the association between
competence judgments and election success (e.g.,
Todorov et al., 2005), our present work has pursued
the latter interpretation of accuracy. The accuracy
related to corruption records we found was comparable
with that related to election success—for instance,
Todorov et al. (2005) found that for 2004 U.S. Senate
races, aggregate-level accuracy was 68.8%, and average
individual-level accuracy was 53%. We emphasize that
for our present work and a large literature on the asso-
ciation between face-based trait judgments and real-
world metrics, accuracies at an individual level were
only slightly above chance (but significantly so), and
participants were very often wrong. However, the con-
siderably larger effect sizes for aggregated judgments
have important implications for real-world collective deci-
sions such as elections and corruption investigations.
In Study 4, we found that an official was perceived
as more corruptible when his face was manipulated to
be slightly wider and less corruptible when his face
was manipulated to be slightly slimmer, even though
participants did not detect such manipulation of the
facial identity. Our finding dovetails with the large lit-
erature on perceptual biases related to face width-to-
height ratio (e.g., Deska et al., 2018) and the literature
on weight stereotypes, which shows that overweight
individuals are judged as lazy, greedy, selfish, and less
trustworthy (Greenleaf, Chambliss, Rhea, Martin, &
Morrow, 2006; Larkin & Pines, 1979). Yet widening or
narrowing the face potentially introduces other changes
to the geometry of the face. It will be important for
future studies to investigate which of these correlated
structural changes are in fact detected by the brain and
drive the change in social judgments that perceivers
make.
The detailed causal mechanisms that ultimately
underlie the association between a record of corruption
and face-based judgments of corruptibility we found
are likely to be complex and bidirectional (Swann,
1984). In particular, people who look corruptible might
be more likely to be approached by others with the
intent to corrupt them, which in turn results in the
mutual behaviors required for corruption to occur
(Kruglanski, 1989); further experimental studies would
be required to tease apart their relative contributions.
Given these considerations, we emphasize that our
findings should be interpreted with caution. Do they
show that corruptible individuals have a different facial
structure, as suggested by physiognomy? There are
strong reasons to be skeptical. First, the record of an
official is unlikely to be an errorless measure of how
corruptible he actually is. Second, the photographs
posted on government and campaign websites might
provide a biased representation of an official’s face—for
example, some photos have clearly been retouched for
skin texture and lighting. Third, there might well be
other unknown confounding effects. For example, per-
haps officials who committed a corrupt act might have
looked more guilty when they posed for photos (even
prior to being convicted), which in turn could have
provided subtle visual cues for trait judgments. Fourth,
both face judgments and social behaviors strongly
depend on context (Todorov, 2017). For instance, in
the context of business corruption, business executives’
corruption records were not associated with how trust-
worthy they looked (Rule, Krendl, Ivcevic, & Ambady,
2013). These findings and the considerations mentioned
previously suggest that the self-fulfilling prophecy (e.g.,
Haselhuhn et al., 2013; Slepian & Ames, 2016) together
with biases in judicial decisions (e.g., Wilson & Rule,
2015; Zebrowitz & McDonald, 1991) may be more plau-
sible explanations than physiognomy for the face–
corruption-record association we found. Future studies
should examine multiple photographs of the same official
taken in different contexts (e.g., posed and candid photos)
and at different time points (e.g., from the time he ran for
office, after misconducts, and after prosecutions).
There are important limitations to the generalizability
of our studies (Simons, Shoda, & Lindsay, 2017). They
leave open whether such trait judgments operate in the
real world, where faces are not photographs and whether
similar associations would hold for other cultures or for
antisocial behaviors among people in general. It is also
possible that corruptibility judgments are better
1822 Lin et al.
correlated with other social behaviors that we did not
measure, which in turn provide an indirect link to
recorded corruption—indeed, it is conceivable that pros-
ecutors’ decisions might be one such social behavior.
We conclude with a future direction suggested by
this work. The ultimate explanation for the findings we
report must reside in evolutionarily based or experience-
based neural mechanisms in the brains of both the
subjects making the social judgments and the officials
engaging in the corrupt behaviors. For instance, there
are already claims that individual differences in traits
can be predicted from patterns of brain activity (Dubois,
Galdi, Paul, & Adolphs, 2018; Finn et al., 2015), and
there is a large literature showing that social inferences
engage specific neural networks in the brains of per-
ceivers (Spunt & Adolphs, 2017). Future studies using
neuroimaging could help further uncover the causal
mechanisms behind our findings.
Action Editor
D. Stephen Lindsay served as action editor for this article.
Author Contributions
All authors developed the study concept and designed the
study. Testing and data collection were performed by C. Lin,
who also analyzed and interpreted the data under the super-
vision of R. Adolphs and R. M. Alvarez. All authors drafted
the manuscript. All the authors approved the final manuscript
for submission.
Acknowledgments
We thank Colin F. Camerer, Antonio Rangel, Anita Tusche,
and Shuo Wang for helpful conversations.
Declaration of Conflicting Interests
The author(s) declared that there were no conflicts of interest
with respect to the authorship or the publication of this
article.
Funding
This research was supported in part by a Conte Center grant
from the National Institute of Mental Health (P50MH094258).
Supplemental Material
Additional supporting information can be found at http://
journals.sagepub.com/doi/suppl/10.1177/0956797618788882
Open Practices
All data and materials have been made publicly available via
the Open Science Framework (OSF) and can be accessed at
https://osf.io/chpfn/. The design and analysis plans for the
experiments were preregistered at the OSF (Study 1: https://
osf.io/mge8r/, Study 2: https://osf.io/tgzpz/, Study 3: https://osf
.io/7a7eu/, Study 4: https://osf.io/58x6e/). The complete Open
Practices Disclosure for this article can be found at http://
journals.sagepub.com/doi/suppl/10.1177/0956797618788882.
This article has received badges for Open Data, Open Materials,
and Preregistration. More information about the Open Practices
badges can be found at http://www.psychologicalscience.org/
publications/badges.
References
Antonakis, J., & Eubanks, D. L. (2017). Looking leadership
in the face. Current Directions in Psychological Science,
26, 270–275.
Berry, D. S., & Zebrowitz-McArthur, L. (1988). What’s in a
face? Facial maturity and the attribution of legal respon-
sibility. Personality and Social Psychology Bulletin, 14,
23–33.
Blair, I. V., Judd, C. M., & Chapleau, K. M. (2004). The influ-
ence of Afrocentric facial features in criminal sentencing.
Psychological Science, 15, 674–679.
Cogsdill, E. J., Todorov, A. T., Spelke, E. S., & Banaji, M. R.
(2014). Inferring character from faces: A developmental
study. Psychological Science, 25, 1132–1139.
Deska, J. C., Lloyd, E. P., & Hugenberg, K. (2018). Facing
humanness: Facial width-to-height ratio predicts ascrip-
tions of humanity. Journal of Personality and Social
Psychology, 114, 75–94.
Dubois, J. C., Galdi, P., Paul, L. K., & Adolphs, R. (2018). A
distributed brain network predicts general intelligence
from resting-state human neuroimaging data. bioRxiv,
Article 257865. doi:10.1101/257865
Engell, A. D., Haxby, J. V., & Todorov, A. (2007). Implicit
trustworthiness decisions: Automatic coding of face
properties in the human amygdala. Journal of Cognitive
Neuroscience, 19, 1508–1519.
Farkas, L. G. (Ed.). (1994). Anthropometry of the head and
face. New York, NY: Raven Press.
Finn, E. S., Shen, X., Scheinost, D., Rosenberg, M. D., Huang,
J., Chun, M. M., . . . Constable, R. T. (2015). Functional
connectome fingerprinting: Identifying individuals using
patterns of brain connectivity. Nature Neuroscience, 18,
1664–1671.
Funder, D. C. (1987). Errors and mistakes: Evaluating the
accuracy of social judgment. Psychological Bulletin, 101,
75–90.
Genevsky, A., & Knutson, B. (2015). Neural affective mecha-
nisms predict market-level microlending. Psychological
Science, 26, 1411–1422.
Geniole, S. N., Denson, T. F., Dixson, B. J., Carré, J. M., &
McCormick, C. M. (2015). Evidence from meta-analyses
of the facial width-to-height ratio as an evolved cue of
threat. PLOS ONE, 10(7), Article e0132726. doi:10.1371/
journal.pone.0132726
Gheorghiu, A. I., Callan, M. J., & Skylark, W. J. (2017). Facial
appearance affects science communication. Proceedings
of the National Academy of Sciences, USA, 114, 5970–
5975.
Facial Inferences and Corruption 1823
Greenleaf, C., Chambliss, H., Rhea, D. J., Martin, S. B., &
Morrow, J. R. (2006). Weight stereotypes and behavioral
intentions toward thin and fat peers among White and
Hispanic adolescents. Journal of Adolescent Health, 39,
546–552.
Hamermesh, D. S. (2011). Beauty pays: Why attractive people
are more successful. Princeton, NJ: Princeton University
Press.
Haselhuhn, M. P., Wong, E. M., & Ormiston, M. E. (2013).
Self-fulfilling prophecies as a link between men’s facial
width-to-height ratio and behavior. PLOS ONE, 8(8),
Article e72259. doi:10.1371/journal.pone.0072259
Jussim, L. (1986). Self-fulfilling prophecies: A theoretical and
integrative review. Psychological Review, 93, 429–445.
Kruglanski, A. W. (1989). The psychology of being “right”:
The problem of accuracy in social perception and cogni-
tion. Psychological Bulletin, 106, 395–409.
Larkin, J. C., & Pines, H. A. (1979). No fat persons need apply:
Experimental studies of the overweight stereotype and
hiring preference. Sociology of Work and Occupations,
6, 312–327.
Lin, C., Adolphs, R., & Alvarez, R. M. (2017). Cultural effects
on the association between election outcomes and face-
based trait inferences. PLOS ONE, 12(7), Article e0180837.
doi:10.1371/journal.pone.0180837
Olivola, C. Y., Eastwick, P. W., Finkel, E. J., Hortacsu, A.,
Ariely, D., & Todorov, A. (2014). A picture is worth a thou-
sand inferences: First impressions and mate selection in
Internet matchmaking and speed-dating. Pittsburgh, PA:
Tepper School of Business, Carnegie Mellon University.
Olivola, C. Y., & Todorov, A. (2010). Elected in 100 milli-
seconds: Appearance-based trait inferences and voting.
Journal of Nonverbal Behavior, 34, 83–110.
Penton-Voak, I. S., Pound, N., Little, A. C., & Perrett, D. I.
(2006). Personality judgments from natural and composite
facial images: More evidence for a “kernel of truth” in
social perception. Social Cognition, 24, 607–640.
Ravina, E. (2012). Love & loans: The effect of beauty and per-
sonal characteristics in credit markets. SSRN. doi:10.2139/
ssrn.1107307
Rezlescu, C., Duchaine, B., Olivola, C. Y., & Chater, N. (2012).
Unfakeable facial configurations affect strategic choices
in trust games with or without information about past
behavior. PLOS ONE, 7(3), Article e34293. doi:10.1371/
journal.pone.0034293
Rose-Ackerman, S. (2013). Corruption: A study in political
economy. San Diego, CA: Academic Press.
Rule, N. O., Ambady, N., Adams, R. B., Jr., Ozono, H.,
Nakashima, S., Yoshikawa, S., & Watabe, M. (2010).
Polling the face: Prediction and consensus across
cultures. Journal of Personality and Social Psychology,
98, 1–15.
Rule, N. O., Krendl, A. C., Ivcevic, Z., & Ambady, N. (2013).
Accuracy and consensus in judgments of trustworthiness
from faces: Behavioral and neural correlates. Journal of
Personality and Social Psychology, 104, 409–426.
Simons, D. J., Shoda, Y., & Lindsay, D. S. (2017). Constraints
on generality (COG): A proposed addition to all empirical
papers. Perspectives on Psychological Science, 12, 1123–1128.
Slepian, M. L., & Ames, D. R. (2016). Internalized impres-
sions: The link between apparent facial trustworthiness
and deceptive behavior is mediated by targets’ expecta-
tions of how they will be judged. Psychological Science,
27, 282–288.
Spunt, R. P., & Adolphs, R. (2017). The neuroscience of
understanding the emotions of others. Neuroscience
Letters. Advance online publication. doi:10.1016/j.neu
let.2017.06.018
Stirrat, M., & Perrett, D. I. (2010). Valid facial cues to coop-
eration and trust: Male facial width and trustworthiness.
Psychological Science, 21, 349–354.
Swann, W. B. (1984). Quest for accuracy in person percep-
tion: A matter of pragmatics. Psychological Review, 91,
457–477.
Todorov, A. (2017). Face value: The irresistible influence of
first impressions. Princeton, NJ: Princeton University Press.
Todorov, A., Mandisodza, A. N., Goren, A., & Hall, C. C.
(2005). Inferences of competence from faces predict elec-
tion outcomes. Science, 308, 1623–1626.
Todorov, A., Olivola, C. Y., Dotsch, R., & Mende-Siedlecki, P.
(2015). Social attributions from faces: Determinants, con-
sequences, accuracy, and functional significance. Annual
Review of Psychology, 66, 519–545.
Valentine, K. A., Li, N. P., Penke, L., & Perrett, D. I. (2014).
Judging a man by the width of his face: The role of facial
ratios and dominance in mate choice at speed-dating
events. Psychological Science, 25, 806–811.
Valla, J. M., Ceci, S. J., & Williams, W. M. (2011). The accu-
racy of inferences about criminality based on facial
appearance. Journal of Social, Evolutionary, and Cultural
Psychology, 5(1), 66–91.
Van’t Wout, M., & Sanfey, A. G. (2008). Friend or foe: The
effect of implicit trustworthiness judgments in social deci-
sion-making. Cognition, 108, 796–803.
Wilson, J. P., & Rule, N. O. (2015). Facial trustworthi-
ness predicts extreme criminal-sentencing outcomes.
Psychological Science, 26, 1325–1331.
Zebrowitz, L. A., & McDonald, S. M. (1991). The impact of
liti-
gants’ baby-facedness and attractiveness on adjudications in
small claims courts. Law and Human Behavior, 15, 603–623.

More Related Content

Similar to ANNOTATED BIBLIOGRAPHY 1ANNOTATED BIBLIOGRAPHY 2Anno.docx

Relationship between Personality Traits, Academic Achievement and Salary: An ...
Relationship between Personality Traits, Academic Achievement and Salary: An ...Relationship between Personality Traits, Academic Achievement and Salary: An ...
Relationship between Personality Traits, Academic Achievement and Salary: An ...iosrjce
 
Org Behavior Case Study
Org Behavior Case StudyOrg Behavior Case Study
Org Behavior Case StudyCasey Hudson
 
Limitations of self report
Limitations of self reportLimitations of self report
Limitations of self reportAndrew Pearce
 
Employee retention
Employee retentionEmployee retention
Employee retentionAbhranil Das
 
Employee Performance in relation to Job Satisfaction
Employee Performance in relation to Job SatisfactionEmployee Performance in relation to Job Satisfaction
Employee Performance in relation to Job SatisfactionEtienneka
 
Masculinity and femenity
Masculinity and femenityMasculinity and femenity
Masculinity and femenityKatalia1
 
Week 11Collection of Data – questionnaire and Instruments & .docx
Week 11Collection of Data – questionnaire and Instruments & .docxWeek 11Collection of Data – questionnaire and Instruments & .docx
Week 11Collection of Data – questionnaire and Instruments & .docxjessiehampson
 
Psychological Perspectives On Studying Juvenile...
Psychological Perspectives On Studying Juvenile...Psychological Perspectives On Studying Juvenile...
Psychological Perspectives On Studying Juvenile...Monica Rivera
 
For my final project I am choosing the environmental influences on.docx
For my final project I am choosing the environmental influences on.docxFor my final project I am choosing the environmental influences on.docx
For my final project I am choosing the environmental influences on.docxrhetttrevannion
 
Running head LITERATURE REVIEW .docx
Running head LITERATURE REVIEW                                   .docxRunning head LITERATURE REVIEW                                   .docx
Running head LITERATURE REVIEW .docxcharisellington63520
 

Similar to ANNOTATED BIBLIOGRAPHY 1ANNOTATED BIBLIOGRAPHY 2Anno.docx (13)

Mega Essay
Mega EssayMega Essay
Mega Essay
 
Relationship between Personality Traits, Academic Achievement and Salary: An ...
Relationship between Personality Traits, Academic Achievement and Salary: An ...Relationship between Personality Traits, Academic Achievement and Salary: An ...
Relationship between Personality Traits, Academic Achievement and Salary: An ...
 
Org Behavior Case Study
Org Behavior Case StudyOrg Behavior Case Study
Org Behavior Case Study
 
Limitations of self report
Limitations of self reportLimitations of self report
Limitations of self report
 
Employee retention
Employee retentionEmployee retention
Employee retention
 
Employee Performance in relation to Job Satisfaction
Employee Performance in relation to Job SatisfactionEmployee Performance in relation to Job Satisfaction
Employee Performance in relation to Job Satisfaction
 
Exploratory Essay Example
Exploratory Essay ExampleExploratory Essay Example
Exploratory Essay Example
 
Masculinity and femenity
Masculinity and femenityMasculinity and femenity
Masculinity and femenity
 
Week 11Collection of Data – questionnaire and Instruments & .docx
Week 11Collection of Data – questionnaire and Instruments & .docxWeek 11Collection of Data – questionnaire and Instruments & .docx
Week 11Collection of Data – questionnaire and Instruments & .docx
 
PSY130_3_43915833
PSY130_3_43915833PSY130_3_43915833
PSY130_3_43915833
 
Psychological Perspectives On Studying Juvenile...
Psychological Perspectives On Studying Juvenile...Psychological Perspectives On Studying Juvenile...
Psychological Perspectives On Studying Juvenile...
 
For my final project I am choosing the environmental influences on.docx
For my final project I am choosing the environmental influences on.docxFor my final project I am choosing the environmental influences on.docx
For my final project I am choosing the environmental influences on.docx
 
Running head LITERATURE REVIEW .docx
Running head LITERATURE REVIEW                                   .docxRunning head LITERATURE REVIEW                                   .docx
Running head LITERATURE REVIEW .docx
 

More from durantheseldine

Angela’s Ashes​ - Murasaki Shikibu said that the novel happens be.docx
Angela’s Ashes​ - Murasaki Shikibu said that the novel happens be.docxAngela’s Ashes​ - Murasaki Shikibu said that the novel happens be.docx
Angela’s Ashes​ - Murasaki Shikibu said that the novel happens be.docxdurantheseldine
 
ANG1922, Winter 2016Essay 02 InstructionsYour second e.docx
ANG1922, Winter 2016Essay 02 InstructionsYour second e.docxANG1922, Winter 2016Essay 02 InstructionsYour second e.docx
ANG1922, Winter 2016Essay 02 InstructionsYour second e.docxdurantheseldine
 
Anecdotal Records Anecdotal Record Developmental Domain__ _.docx
Anecdotal Records Anecdotal Record Developmental Domain__      _.docxAnecdotal Records Anecdotal Record Developmental Domain__      _.docx
Anecdotal Records Anecdotal Record Developmental Domain__ _.docxdurantheseldine
 
Andy and Beth are neighbors in a small duplex. In the evenings after.docx
Andy and Beth are neighbors in a small duplex. In the evenings after.docxAndy and Beth are neighbors in a small duplex. In the evenings after.docx
Andy and Beth are neighbors in a small duplex. In the evenings after.docxdurantheseldine
 
Andrew John De Los SantosPUP 190SOS 111 Sustainable CitiesMar.docx
Andrew John De Los SantosPUP 190SOS 111 Sustainable CitiesMar.docxAndrew John De Los SantosPUP 190SOS 111 Sustainable CitiesMar.docx
Andrew John De Los SantosPUP 190SOS 111 Sustainable CitiesMar.docxdurantheseldine
 
Android Permissions DemystifiedAdrienne Porter Felt, Erika.docx
Android Permissions DemystifiedAdrienne Porter Felt, Erika.docxAndroid Permissions DemystifiedAdrienne Porter Felt, Erika.docx
Android Permissions DemystifiedAdrienne Porter Felt, Erika.docxdurantheseldine
 
ANDREW CARNEGIE PRINCE OF STEELNARRATOR On November 25th, 1835 i.docx
ANDREW CARNEGIE PRINCE OF STEELNARRATOR On November 25th, 1835 i.docxANDREW CARNEGIE PRINCE OF STEELNARRATOR On November 25th, 1835 i.docx
ANDREW CARNEGIE PRINCE OF STEELNARRATOR On November 25th, 1835 i.docxdurantheseldine
 
Andrew CassidySaint Leo UniversityContemporary Issues in Crimina.docx
Andrew CassidySaint Leo UniversityContemporary Issues in Crimina.docxAndrew CassidySaint Leo UniversityContemporary Issues in Crimina.docx
Andrew CassidySaint Leo UniversityContemporary Issues in Crimina.docxdurantheseldine
 
andrea lunsfordstanford universitymichal brodysono.docx
andrea lunsfordstanford universitymichal brodysono.docxandrea lunsfordstanford universitymichal brodysono.docx
andrea lunsfordstanford universitymichal brodysono.docxdurantheseldine
 
Andrea Azpiazo – Review One. Little Havana Multifamily Developme.docx
Andrea Azpiazo – Review One.  Little Havana Multifamily Developme.docxAndrea Azpiazo – Review One.  Little Havana Multifamily Developme.docx
Andrea Azpiazo – Review One. Little Havana Multifamily Developme.docxdurantheseldine
 
And what we students of history always learn is that the human bein.docx
And what we students of history always learn is that the human bein.docxAnd what we students of history always learn is that the human bein.docx
And what we students of history always learn is that the human bein.docxdurantheseldine
 
and Contradiction in Architecture Robert Venturi .docx
and Contradiction in Architecture Robert Venturi .docxand Contradiction in Architecture Robert Venturi .docx
and Contradiction in Architecture Robert Venturi .docxdurantheseldine
 
Ancient Egypt1The Civilization of the Nile River V.docx
Ancient Egypt1The Civilization of the Nile River V.docxAncient Egypt1The Civilization of the Nile River V.docx
Ancient Egypt1The Civilization of the Nile River V.docxdurantheseldine
 
Anayze a landmark case. The assesment should include a full discussi.docx
Anayze a landmark case. The assesment should include a full discussi.docxAnayze a landmark case. The assesment should include a full discussi.docx
Anayze a landmark case. The assesment should include a full discussi.docxdurantheseldine
 
Anatomy and Physiology of the Digestive SystemObjectives· Iden.docx
Anatomy and Physiology of the Digestive SystemObjectives· Iden.docxAnatomy and Physiology of the Digestive SystemObjectives· Iden.docx
Anatomy and Physiology of the Digestive SystemObjectives· Iden.docxdurantheseldine
 
ANAThe Article Review by Jeanette Keith on Book by Stephanie McCu.docx
ANAThe Article  Review by Jeanette Keith on Book by Stephanie McCu.docxANAThe Article  Review by Jeanette Keith on Book by Stephanie McCu.docx
ANAThe Article Review by Jeanette Keith on Book by Stephanie McCu.docxdurantheseldine
 
Analyzing workers social networking behavior – an invasion of priva.docx
Analyzing workers social networking behavior – an invasion of priva.docxAnalyzing workers social networking behavior – an invasion of priva.docx
Analyzing workers social networking behavior – an invasion of priva.docxdurantheseldine
 
Analyzing and Visualizing Data Chapter 6Data Represent.docx
Analyzing and Visualizing Data Chapter 6Data Represent.docxAnalyzing and Visualizing Data Chapter 6Data Represent.docx
Analyzing and Visualizing Data Chapter 6Data Represent.docxdurantheseldine
 
Analyzing and Visualizing Data Chapter 1The .docx
Analyzing and Visualizing Data Chapter 1The .docxAnalyzing and Visualizing Data Chapter 1The .docx
Analyzing and Visualizing Data Chapter 1The .docxdurantheseldine
 
Analyzing a Primary Source RubricName ______________________.docx
Analyzing a Primary Source RubricName ______________________.docxAnalyzing a Primary Source RubricName ______________________.docx
Analyzing a Primary Source RubricName ______________________.docxdurantheseldine
 

More from durantheseldine (20)

Angela’s Ashes​ - Murasaki Shikibu said that the novel happens be.docx
Angela’s Ashes​ - Murasaki Shikibu said that the novel happens be.docxAngela’s Ashes​ - Murasaki Shikibu said that the novel happens be.docx
Angela’s Ashes​ - Murasaki Shikibu said that the novel happens be.docx
 
ANG1922, Winter 2016Essay 02 InstructionsYour second e.docx
ANG1922, Winter 2016Essay 02 InstructionsYour second e.docxANG1922, Winter 2016Essay 02 InstructionsYour second e.docx
ANG1922, Winter 2016Essay 02 InstructionsYour second e.docx
 
Anecdotal Records Anecdotal Record Developmental Domain__ _.docx
Anecdotal Records Anecdotal Record Developmental Domain__      _.docxAnecdotal Records Anecdotal Record Developmental Domain__      _.docx
Anecdotal Records Anecdotal Record Developmental Domain__ _.docx
 
Andy and Beth are neighbors in a small duplex. In the evenings after.docx
Andy and Beth are neighbors in a small duplex. In the evenings after.docxAndy and Beth are neighbors in a small duplex. In the evenings after.docx
Andy and Beth are neighbors in a small duplex. In the evenings after.docx
 
Andrew John De Los SantosPUP 190SOS 111 Sustainable CitiesMar.docx
Andrew John De Los SantosPUP 190SOS 111 Sustainable CitiesMar.docxAndrew John De Los SantosPUP 190SOS 111 Sustainable CitiesMar.docx
Andrew John De Los SantosPUP 190SOS 111 Sustainable CitiesMar.docx
 
Android Permissions DemystifiedAdrienne Porter Felt, Erika.docx
Android Permissions DemystifiedAdrienne Porter Felt, Erika.docxAndroid Permissions DemystifiedAdrienne Porter Felt, Erika.docx
Android Permissions DemystifiedAdrienne Porter Felt, Erika.docx
 
ANDREW CARNEGIE PRINCE OF STEELNARRATOR On November 25th, 1835 i.docx
ANDREW CARNEGIE PRINCE OF STEELNARRATOR On November 25th, 1835 i.docxANDREW CARNEGIE PRINCE OF STEELNARRATOR On November 25th, 1835 i.docx
ANDREW CARNEGIE PRINCE OF STEELNARRATOR On November 25th, 1835 i.docx
 
Andrew CassidySaint Leo UniversityContemporary Issues in Crimina.docx
Andrew CassidySaint Leo UniversityContemporary Issues in Crimina.docxAndrew CassidySaint Leo UniversityContemporary Issues in Crimina.docx
Andrew CassidySaint Leo UniversityContemporary Issues in Crimina.docx
 
andrea lunsfordstanford universitymichal brodysono.docx
andrea lunsfordstanford universitymichal brodysono.docxandrea lunsfordstanford universitymichal brodysono.docx
andrea lunsfordstanford universitymichal brodysono.docx
 
Andrea Azpiazo – Review One. Little Havana Multifamily Developme.docx
Andrea Azpiazo – Review One.  Little Havana Multifamily Developme.docxAndrea Azpiazo – Review One.  Little Havana Multifamily Developme.docx
Andrea Azpiazo – Review One. Little Havana Multifamily Developme.docx
 
And what we students of history always learn is that the human bein.docx
And what we students of history always learn is that the human bein.docxAnd what we students of history always learn is that the human bein.docx
And what we students of history always learn is that the human bein.docx
 
and Contradiction in Architecture Robert Venturi .docx
and Contradiction in Architecture Robert Venturi .docxand Contradiction in Architecture Robert Venturi .docx
and Contradiction in Architecture Robert Venturi .docx
 
Ancient Egypt1The Civilization of the Nile River V.docx
Ancient Egypt1The Civilization of the Nile River V.docxAncient Egypt1The Civilization of the Nile River V.docx
Ancient Egypt1The Civilization of the Nile River V.docx
 
Anayze a landmark case. The assesment should include a full discussi.docx
Anayze a landmark case. The assesment should include a full discussi.docxAnayze a landmark case. The assesment should include a full discussi.docx
Anayze a landmark case. The assesment should include a full discussi.docx
 
Anatomy and Physiology of the Digestive SystemObjectives· Iden.docx
Anatomy and Physiology of the Digestive SystemObjectives· Iden.docxAnatomy and Physiology of the Digestive SystemObjectives· Iden.docx
Anatomy and Physiology of the Digestive SystemObjectives· Iden.docx
 
ANAThe Article Review by Jeanette Keith on Book by Stephanie McCu.docx
ANAThe Article  Review by Jeanette Keith on Book by Stephanie McCu.docxANAThe Article  Review by Jeanette Keith on Book by Stephanie McCu.docx
ANAThe Article Review by Jeanette Keith on Book by Stephanie McCu.docx
 
Analyzing workers social networking behavior – an invasion of priva.docx
Analyzing workers social networking behavior – an invasion of priva.docxAnalyzing workers social networking behavior – an invasion of priva.docx
Analyzing workers social networking behavior – an invasion of priva.docx
 
Analyzing and Visualizing Data Chapter 6Data Represent.docx
Analyzing and Visualizing Data Chapter 6Data Represent.docxAnalyzing and Visualizing Data Chapter 6Data Represent.docx
Analyzing and Visualizing Data Chapter 6Data Represent.docx
 
Analyzing and Visualizing Data Chapter 1The .docx
Analyzing and Visualizing Data Chapter 1The .docxAnalyzing and Visualizing Data Chapter 1The .docx
Analyzing and Visualizing Data Chapter 1The .docx
 
Analyzing a Primary Source RubricName ______________________.docx
Analyzing a Primary Source RubricName ______________________.docxAnalyzing a Primary Source RubricName ______________________.docx
Analyzing a Primary Source RubricName ______________________.docx
 

Recently uploaded

Concurrency Control in Database Management system
Concurrency Control in Database Management systemConcurrency Control in Database Management system
Concurrency Control in Database Management systemChristalin Nelson
 
Virtual-Orientation-on-the-Administration-of-NATG12-NATG6-and-ELLNA.pdf
Virtual-Orientation-on-the-Administration-of-NATG12-NATG6-and-ELLNA.pdfVirtual-Orientation-on-the-Administration-of-NATG12-NATG6-and-ELLNA.pdf
Virtual-Orientation-on-the-Administration-of-NATG12-NATG6-and-ELLNA.pdfErwinPantujan2
 
FILIPINO PSYCHology sikolohiyang pilipino
FILIPINO PSYCHology sikolohiyang pilipinoFILIPINO PSYCHology sikolohiyang pilipino
FILIPINO PSYCHology sikolohiyang pilipinojohnmickonozaleda
 
Field Attribute Index Feature in Odoo 17
Field Attribute Index Feature in Odoo 17Field Attribute Index Feature in Odoo 17
Field Attribute Index Feature in Odoo 17Celine George
 
Global Lehigh Strategic Initiatives (without descriptions)
Global Lehigh Strategic Initiatives (without descriptions)Global Lehigh Strategic Initiatives (without descriptions)
Global Lehigh Strategic Initiatives (without descriptions)cama23
 
Transaction Management in Database Management System
Transaction Management in Database Management SystemTransaction Management in Database Management System
Transaction Management in Database Management SystemChristalin Nelson
 
Visit to a blind student's school🧑‍🦯🧑‍🦯(community medicine)
Visit to a blind student's school🧑‍🦯🧑‍🦯(community medicine)Visit to a blind student's school🧑‍🦯🧑‍🦯(community medicine)
Visit to a blind student's school🧑‍🦯🧑‍🦯(community medicine)lakshayb543
 
call girls in Kamla Market (DELHI) 🔝 >༒9953330565🔝 genuine Escort Service 🔝✔️✔️
call girls in Kamla Market (DELHI) 🔝 >༒9953330565🔝 genuine Escort Service 🔝✔️✔️call girls in Kamla Market (DELHI) 🔝 >༒9953330565🔝 genuine Escort Service 🔝✔️✔️
call girls in Kamla Market (DELHI) 🔝 >༒9953330565🔝 genuine Escort Service 🔝✔️✔️9953056974 Low Rate Call Girls In Saket, Delhi NCR
 
THEORIES OF ORGANIZATION-PUBLIC ADMINISTRATION
THEORIES OF ORGANIZATION-PUBLIC ADMINISTRATIONTHEORIES OF ORGANIZATION-PUBLIC ADMINISTRATION
THEORIES OF ORGANIZATION-PUBLIC ADMINISTRATIONHumphrey A Beña
 
Student Profile Sample - We help schools to connect the data they have, with ...
Student Profile Sample - We help schools to connect the data they have, with ...Student Profile Sample - We help schools to connect the data they have, with ...
Student Profile Sample - We help schools to connect the data they have, with ...Seán Kennedy
 
Procuring digital preservation CAN be quick and painless with our new dynamic...
Procuring digital preservation CAN be quick and painless with our new dynamic...Procuring digital preservation CAN be quick and painless with our new dynamic...
Procuring digital preservation CAN be quick and painless with our new dynamic...Jisc
 
How to Add Barcode on PDF Report in Odoo 17
How to Add Barcode on PDF Report in Odoo 17How to Add Barcode on PDF Report in Odoo 17
How to Add Barcode on PDF Report in Odoo 17Celine George
 
USPS® Forced Meter Migration - How to Know if Your Postage Meter Will Soon be...
USPS® Forced Meter Migration - How to Know if Your Postage Meter Will Soon be...USPS® Forced Meter Migration - How to Know if Your Postage Meter Will Soon be...
USPS® Forced Meter Migration - How to Know if Your Postage Meter Will Soon be...Postal Advocate Inc.
 
Difference Between Search & Browse Methods in Odoo 17
Difference Between Search & Browse Methods in Odoo 17Difference Between Search & Browse Methods in Odoo 17
Difference Between Search & Browse Methods in Odoo 17Celine George
 
INTRODUCTION TO CATHOLIC CHRISTOLOGY.pptx
INTRODUCTION TO CATHOLIC CHRISTOLOGY.pptxINTRODUCTION TO CATHOLIC CHRISTOLOGY.pptx
INTRODUCTION TO CATHOLIC CHRISTOLOGY.pptxHumphrey A Beña
 
MULTIDISCIPLINRY NATURE OF THE ENVIRONMENTAL STUDIES.pptx
MULTIDISCIPLINRY NATURE OF THE ENVIRONMENTAL STUDIES.pptxMULTIDISCIPLINRY NATURE OF THE ENVIRONMENTAL STUDIES.pptx
MULTIDISCIPLINRY NATURE OF THE ENVIRONMENTAL STUDIES.pptxAnupkumar Sharma
 
Influencing policy (training slides from Fast Track Impact)
Influencing policy (training slides from Fast Track Impact)Influencing policy (training slides from Fast Track Impact)
Influencing policy (training slides from Fast Track Impact)Mark Reed
 
AUDIENCE THEORY -CULTIVATION THEORY - GERBNER.pptx
AUDIENCE THEORY -CULTIVATION THEORY -  GERBNER.pptxAUDIENCE THEORY -CULTIVATION THEORY -  GERBNER.pptx
AUDIENCE THEORY -CULTIVATION THEORY - GERBNER.pptxiammrhaywood
 

Recently uploaded (20)

Concurrency Control in Database Management system
Concurrency Control in Database Management systemConcurrency Control in Database Management system
Concurrency Control in Database Management system
 
Virtual-Orientation-on-the-Administration-of-NATG12-NATG6-and-ELLNA.pdf
Virtual-Orientation-on-the-Administration-of-NATG12-NATG6-and-ELLNA.pdfVirtual-Orientation-on-the-Administration-of-NATG12-NATG6-and-ELLNA.pdf
Virtual-Orientation-on-the-Administration-of-NATG12-NATG6-and-ELLNA.pdf
 
FILIPINO PSYCHology sikolohiyang pilipino
FILIPINO PSYCHology sikolohiyang pilipinoFILIPINO PSYCHology sikolohiyang pilipino
FILIPINO PSYCHology sikolohiyang pilipino
 
Field Attribute Index Feature in Odoo 17
Field Attribute Index Feature in Odoo 17Field Attribute Index Feature in Odoo 17
Field Attribute Index Feature in Odoo 17
 
Global Lehigh Strategic Initiatives (without descriptions)
Global Lehigh Strategic Initiatives (without descriptions)Global Lehigh Strategic Initiatives (without descriptions)
Global Lehigh Strategic Initiatives (without descriptions)
 
Transaction Management in Database Management System
Transaction Management in Database Management SystemTransaction Management in Database Management System
Transaction Management in Database Management System
 
Raw materials used in Herbal Cosmetics.pptx
Raw materials used in Herbal Cosmetics.pptxRaw materials used in Herbal Cosmetics.pptx
Raw materials used in Herbal Cosmetics.pptx
 
Visit to a blind student's school🧑‍🦯🧑‍🦯(community medicine)
Visit to a blind student's school🧑‍🦯🧑‍🦯(community medicine)Visit to a blind student's school🧑‍🦯🧑‍🦯(community medicine)
Visit to a blind student's school🧑‍🦯🧑‍🦯(community medicine)
 
call girls in Kamla Market (DELHI) 🔝 >༒9953330565🔝 genuine Escort Service 🔝✔️✔️
call girls in Kamla Market (DELHI) 🔝 >༒9953330565🔝 genuine Escort Service 🔝✔️✔️call girls in Kamla Market (DELHI) 🔝 >༒9953330565🔝 genuine Escort Service 🔝✔️✔️
call girls in Kamla Market (DELHI) 🔝 >༒9953330565🔝 genuine Escort Service 🔝✔️✔️
 
THEORIES OF ORGANIZATION-PUBLIC ADMINISTRATION
THEORIES OF ORGANIZATION-PUBLIC ADMINISTRATIONTHEORIES OF ORGANIZATION-PUBLIC ADMINISTRATION
THEORIES OF ORGANIZATION-PUBLIC ADMINISTRATION
 
Student Profile Sample - We help schools to connect the data they have, with ...
Student Profile Sample - We help schools to connect the data they have, with ...Student Profile Sample - We help schools to connect the data they have, with ...
Student Profile Sample - We help schools to connect the data they have, with ...
 
Procuring digital preservation CAN be quick and painless with our new dynamic...
Procuring digital preservation CAN be quick and painless with our new dynamic...Procuring digital preservation CAN be quick and painless with our new dynamic...
Procuring digital preservation CAN be quick and painless with our new dynamic...
 
YOUVE GOT EMAIL_FINALS_EL_DORADO_2024.pptx
YOUVE GOT EMAIL_FINALS_EL_DORADO_2024.pptxYOUVE GOT EMAIL_FINALS_EL_DORADO_2024.pptx
YOUVE GOT EMAIL_FINALS_EL_DORADO_2024.pptx
 
How to Add Barcode on PDF Report in Odoo 17
How to Add Barcode on PDF Report in Odoo 17How to Add Barcode on PDF Report in Odoo 17
How to Add Barcode on PDF Report in Odoo 17
 
USPS® Forced Meter Migration - How to Know if Your Postage Meter Will Soon be...
USPS® Forced Meter Migration - How to Know if Your Postage Meter Will Soon be...USPS® Forced Meter Migration - How to Know if Your Postage Meter Will Soon be...
USPS® Forced Meter Migration - How to Know if Your Postage Meter Will Soon be...
 
Difference Between Search & Browse Methods in Odoo 17
Difference Between Search & Browse Methods in Odoo 17Difference Between Search & Browse Methods in Odoo 17
Difference Between Search & Browse Methods in Odoo 17
 
INTRODUCTION TO CATHOLIC CHRISTOLOGY.pptx
INTRODUCTION TO CATHOLIC CHRISTOLOGY.pptxINTRODUCTION TO CATHOLIC CHRISTOLOGY.pptx
INTRODUCTION TO CATHOLIC CHRISTOLOGY.pptx
 
MULTIDISCIPLINRY NATURE OF THE ENVIRONMENTAL STUDIES.pptx
MULTIDISCIPLINRY NATURE OF THE ENVIRONMENTAL STUDIES.pptxMULTIDISCIPLINRY NATURE OF THE ENVIRONMENTAL STUDIES.pptx
MULTIDISCIPLINRY NATURE OF THE ENVIRONMENTAL STUDIES.pptx
 
Influencing policy (training slides from Fast Track Impact)
Influencing policy (training slides from Fast Track Impact)Influencing policy (training slides from Fast Track Impact)
Influencing policy (training slides from Fast Track Impact)
 
AUDIENCE THEORY -CULTIVATION THEORY - GERBNER.pptx
AUDIENCE THEORY -CULTIVATION THEORY -  GERBNER.pptxAUDIENCE THEORY -CULTIVATION THEORY -  GERBNER.pptx
AUDIENCE THEORY -CULTIVATION THEORY - GERBNER.pptx
 

ANNOTATED BIBLIOGRAPHY 1ANNOTATED BIBLIOGRAPHY 2Anno.docx

  • 1. ANNOTATED BIBLIOGRAPHY 1 ANNOTATED BIBLIOGRAPHY 2 Annotated Bibliography Leila Bazzi Dr. Zhong Xu Lui Experimental Psychology 2-14-19 Article #1 Lin, C., Adolphs, R., & Alvarez, R. M. (2018). Inferring Whether Officials Are Corruptible from Looking at Their Faces. Psychological Science, 29 (11), 1807-1823. In the target article, “Inferring Whether Officials Are Corruptible from Looking at Their Faces”, the main topic is inferring character traits from a facial expression as it relates to a real-world outcome. This article provides an evaluation which intends to find out how facial inferences is related to the outcome that has a close connection with the face bearer’s mode of behaving. The authors of the article aim at investigating political officials on corruption based on their facial expression. The main raise of using facial based conclusion in this study is because facial inferences are able to guide people’s social behavior due to the fact that facial expression is rich in information. The study clearly shows that people can be able to separate corrupt politicians from clean ones by simply looking at portraits. The article consisted of researchers gathering four preregistered studies of 325 sample participants who filed through photos of elected officials in order to make trait judgements of probable
  • 2. corruptibility. Study 1 inspected state and federal officials, whereas Study 2 examined officials from lower levels of government. In Study 3, the researchers examined whether the results from the previous studies correlated with corruptibility reasoning. Furthermore, in Study 4 the researchers narrowed the study down to the specific features of officials that appear them to look corruptible. As stated, the experimental design in this study was conducted through four different parts; this is where the strength of the study can be based on, in which the researchers collected pictures of politicians which were presented to volunteers. The participants were asked to rate how each politician was corrupt, selfish, generous, trustworthy, and dishonest. The findings from the research raises many questions which would otherwise provide a basis for future research. An example of a question that I suspected to be unanswered is, “What is the underlying mechanism for the relation between possible corruption and politician’s records?” I think that the findings from the article raise the question as to why politicians who are corrupt are elected in office in the first place, seeming as people are able to tell that they are corrupt simply by having a look at them. The weaknesses of this study also include that there are other factors, rather than a face-first impression, that come into the picture and override initial face judgments. Overall, the study investigated quite an interesting matter. With that being said, my group has selected this topic to research based off of our natural curiosity on the subject. Rather, instead of looking at the face of an official as a whole, we are going to be focusing on studying the eye vs. mouth region of their faces. We chose to focus on the aforementioned face regions due to the fact that they are the biggest indicators of lying or deceiving. Therefore, participants paying closer attention to these facial regions will hopefully help us in answering our research question. Articles from within the target article Article #2 Cogsdill, E. J., Todorov, A. T., Spelke, E. S., & Banaji, M. R.
  • 3. (2014). Inferring Character from Faces: A Developmental Study. Psychological Science, 25, 1132–1139. This article discusses many similar things as our target article does, such as participants’ presuming a person’s character by looking simply looking at computer-generated faces, categorizing them to be low or high on perceived trustworthiness, competence, or dominance. This article can contribute to our project due to the correspondence of the study as well as its results. Article #3 Lin, C., Adolphs, R., & Alvarez, R. M. (2017). Cultural effects on the association between election outcomes and face- based trait inferences. PLOS ONE, 12(7), Article e0180837. doi:10.1371/journal.pone. 0180837 This article also heavily relates to the target article we examined, correlating how competent a politician looks with whether the politician gets elected. In addition, it goes further to explain cultural differences in candidate appearances. For example, the article dives into detail about how American politicians tend to show more excited smiles in their candidacy photos compared to Chinese politicians. All in all, these cultural distinctions contribute to how face-based trait assumptions that are made correlate with actual election outcomes.
  • 4. Article #4 Rule, N. O., Krendl, A. C., Ivcevic, Z., & Ambady, N. (2013). Accuracy and consensus in judgments of trustworthiness from faces: Behavioral and neural correlates. Journal of Personality and Social Psychology, 104, 409–426. This article dives into the accuracy of first impression judgements made by looking at faces. The results from this article will definitely help us answer our research question considering the authors conducted 5 different studies to authenticate their findings. Article #5 Todorov, A., Olivola, C. Y., Dotsch, R., & Mende-Siedlecki, P. (2015). Social attributions from faces: Determinants, con- sequences, accuracy, and functional significance. Annual Review of Psychology, 66, 519–545. This article makes multiple points on how people make social attributions from faces. To be specific, the article entails a summary box which includes the various ways that influence social attributions and how they are decided by looking at a face. Taking note of the 8 points listed and keeping them in mind while conducting our own research can help effectively help us. New articles
  • 5. Article #6 Andrew D. Engell, James V. Haxby, and Alexander Todorov. (2007) Implicit Trustworthiness Decisions: Automatic Coding of Face Properties in the Human Amygdala. Journal of Cognitive Neuroscience 2007 Vol. 19, 1508-1519. Among the articles I came across, this was one of the most interesting. This study involved participants deciding whether an unfamiliar face was trustworthy or not by using functional magnetic resonance imaging to display amygdala response rates. A study like this would definitely be beneficial for my group to read before beginning our research. Article #7 Suzuki, A., Tsukamoto, S., & Takahashi, Y. (2017). Faces Tell Everything in a Just and Biologically Determined World: Lay Theories Behind Face Reading. Social Psychological and Personality Science,10 (1), 62-72. doi:10.1177/1948550617734616. This article discusses multiple theories, specifically the “physiognomic belief”, the generic belief that numerous traits can simply be inferred from faces. Both countries, U.S. and Japan heavily demonstrate this belief. As stated in the article, “the physiognomic belief is positively associated with a biologically deterministic view of personality traits and a belief in a just world”. This research correlates directly with the study we will be conducting. Article #8 Kramer, R. S., Mileva, M., & Ritchie, K. L. (2018). Inter-rater agreement in trait judgements from faces. Plos One,13(8). doi:10.1371/journal.pone.0202655
  • 6. This article stood out from the rest due to the type of study it was. Kramer’s study dives into trait judgements from faces by incorporating inter-rater reliability. This is when there are multiple raters rating the same performance or behavior in order to check for agreement in ratings. Using this type of reliability only strengthens the study and solidifies its’ findings. Article #9 Sakuta, Y., Kanazawa, S., & Yamaguchi, M. K. (2018). Infants prefer a trustworthy person: An early sign of social cognition in infants. Plos One,13(9). doi:10.1371/journal.pone.0203541 This article has many diverse aspects, starting with the study itself. The participants of this study are infants, measuring their preferability for trustworthy faces. To clarify previous studies from adults, the researchers examined whether 6-8 month old infants preferred a trustworthy face to an untrustworthy one when both faces were high in dominance. The findings of this study suggest that the perception of trustworthiness based on facial images emerges early on in child development. Coronel & Morris Chapter 1, Problems 5-9 Coronel & Morris Chapter 2, Problems 13-15 Chapter 1 #5 Identify and discuss the serious data redundancy problems exhibited by the file structure shown in Figure P1.5 #6 Looking at the EMP_NAME and EMP_PHONE contents in Figure P1.5, what change(s) would you recommend? #7 Identify the various data sources in the file you examined in Problem 5. #8 Given your answer to Problem 7, what new files should you create to help eliminate the data redundancies found in the file
  • 7. shown in Figure P1.5? #9 Identify and discuss the serious data redundancy problems exhibited by the file structure shown in Figure P1.9 Chapter 2 #13 Describe the relationships (identify the business rules) depicted in the Crow’s Foot ERD shown in Figure P2.13 #14 create a Crow’s Foot ERD to include the following business rules for the ProdCo Company: a. Each sales representative writes many invoices b. Each invoice is written by one sales representative c. Each sales representative is assigned to one department d. Each department has many sales representatives e. Each customer can generate many invoices f. Each invoice is generated by one customer #15 write the business rules that are reflected in the ERD shown in Figure P2.15. (Note that the ERD reflects some simplifying assumptions. For example, each book is written by only one author. Also, remember that the ERD is always read from the “1” to the “M” side, regardless of the orientation of the ERD components. https://doi.org/10.1177/0956797618788882 Psychological Science 2018, Vol. 29(11) 1807 –1823 © The Author(s) 2018 Article reuse guidelines:
  • 8. sagepub.com/journals-permissions DOI: 10.1177/0956797618788882 www.psychologicalscience.org/PS ASSOCIATION FOR PSYCHOLOGICAL SCIENCEResearch Article Faces are rich in information: They provide clues about gender, race, age, and trait attributes, which are inferred spontaneously and ubiquitously (Engell, Haxby, & Todorov, 2007; Todorov, 2017). Moreover, such infer- ences often guide our social behavior—for instance, we decide whom to trust on the basis of how trustworthy a face looks (Rezlescu, Duchaine, Olivola, & Chater, 2012; Van’t Wout & Sanfey, 2008). Many trait judgments made by participants across generations and cultures show consensus (Cogsdill, Todorov, Spelke, & Banaji, 2014; Lin, Adolphs, & Alvarez, 2017; Rule et al., 2010). But are trait judgments from faces accurate? Previous research has shown that trait judgments from faces can be associated with important real-world social outcomes, such as dating and mating (Olivola et al., 2014; Valentine, Li, Penke, & Perrett, 2014), earn- ings and fundraising (Genevsky & Knutson, 2015; Hamermesh, 2011; Ravina, 2012), science communica- tion (Gheorghiu, Callan, & Skylark, 2017), sentencing decisions (Berry & Zebrowitz-McArthur, 1988; Blair, Judd, & Chapleau, 2004; Wilson & Rule, 2015; Zebrowitz & McDonald, 1991), and leader selection (Todorov, Mandisodza, Goren, & Hall, 2005; for reviews, see Antonakis & Eubanks, 2017; Todorov, Olivola, Dotsch, & Mende-Siedlecki, 2015). Yet this prior research on the association between trait judgments from faces and real- world outcomes leaves open two important questions.
  • 9. First, most associations have focused on prosocial out- comes (e.g., correlations between competence judg- ments and election success; Todorov et al., 2005). Second, most associations are plausibly driven not by the behavior of the targets whose face is being judged but by the interests of the perceivers who are making the judgments (e.g., correlations between interesting- looking scientists and the perceiver’s interest in their work). Here, we investigated an antisocial judgment that 788882PSSXXX10.1177/0956797618788882Lin et al.Facial Inferences and Corruption research-article2018 Corresponding Author: Chujun Lin, California Institute of Technology, Division of Humanities and Social Sciences, HSS 228-77, 1200 E. California Blvd., Pasadena, CA 91125 E-mail: [email protected] Inferring Whether Officials Are Corruptible From Looking at Their Faces Chujun Lin, Ralph Adolphs, and R. Michael Alvarez Division of Humanities and Social Sciences, California Institute of Technology Abstract While inferences of traits from unfamiliar faces prominently reveal stereotypes, some facial inferences also correlate with real-world outcomes. We investigated whether facial inferences are associated with an important real-world outcome closely linked to the face bearer’s behavior: political corruption. In four preregistered studies (N = 325), participants made trait judgments of unfamiliar government
  • 10. officials on the basis of their photos. Relative to peers with clean records, federal and state officials convicted of political corruption (Study 1) and local officials who violated campaign finance laws (Study 2) were perceived as more corruptible, dishonest, selfish, and aggressive but similarly competent, ambitious, and masculine (Study 3). Mediation analyses and experiments in which the photos were digitally manipulated showed that participants’ judgments of how corruptible an official looked were causally influenced by the face width of the stimuli (Study 4). The findings shed new light on the complex causal mechanisms linking facial appearances with social behavior. Keywords face perception, corruption, social attribution, stereotyping, political psychology, open data, open materials, preregistered Received 9/25/17; Revision accepted 6/3/18 1808 Lin et al. may offer a clearer insight into associations with the judged person’s own behavior: political corruption. Political corruption has been a major cause of regime change and an important subject of much study in political science and economics (Rose-Ackerman, 2013). The possibility that corruptibility inferences from faces might be associated with real-world measures of cor- ruption is raised by three areas of previous research. First, theories of self-fulfilling prophecy argue that the impressions and expectations a face creates (e.g., how corruptible an official looks) influence how other peo-
  • 11. ple interact with the face bearer (e.g., how likely others would be to bribe the official) and that those recurrent interactions in turn shape the face bearer’s behavior so as to confirm other people’s impressions and expecta- tions (Haselhuhn, Wong, & Ormiston, 2013; Jussim, 1986; Slepian & Ames, 2016). Second, analyses of sen- tencing decisions show that evaluations of guilt and recommendations of punishment are influenced by the defendant’s facial appearance (Berry & Zebrowitz- McArthur, 1988; Blair et al., 2004; Wilson & Rule, 2015; Zebrowitz & McDonald, 1991). These findings suggest that officials who look more corruptible might be more likely to be accused, prosecuted, and convicted. Third, some studies have argued that the face contains a kernel of truth about a person’s nature—such as personality and criminal inclinations (Penton-Voak, Pound, Little, & Perrett, 2006; Valla, Ceci, & Williams, 2011)—even though the diag- nostic validity and the causal mechanisms remain obscure. Given past research, we hypothesized that elected officials’ corruption records would be associated with traits, such as corruptibility, inferred from their facial appearances. We examined this association in three preregistered studies, where participants made trait inferences on the basis of the photos of unfamiliar government officials. To account for the possibility that this association might depend on the severity of corrup- tion and the level of office, we inspected both serious violations (i.e., cases considered political corruption) and minor violations (i.e., cases meriting a fine) and included officials at different levels of government (fed- eral, state, and local). In a fourth preregistered study, we explored which facial features might be causally mediating the impression of how corruptible an official was, using mediation analyses as well as experimental manipulations of the face stimuli. In this fourth study,
  • 12. we focused on metrics of facial structures—in particu- lar, facial width (relative to facial height) because it has been reported that men with wider faces are judged as less trustworthy (Haselhuhn et al., 2013; Stirrat & Perrett, 2010), more threatening (Geniole, Denson, Dixson, Carré, & McCormick, 2015), and less than fully human (Deska, Lloyd, & Hugenberg, 2018), although it remains unknown whether facial width-to-height ratio associates with actual behavior. We have reported all measures, all conditions, all data exclusions, and how sample sizes were determined in this article and on the Open Science Framework (https://osf.io/k4mds/). All materials, data, and analysis codes for the present research can be accessed at this link. Study 1 Our first study focused on federal and state officials and compared those who had clean records with those who were convicted of political corruption. Method Participants. This study was preregistered before data collection began (https://osf.io/mge8r/). A sample size of 100 participants was predetermined on the basis of two pilot studies—one carried out in the lab in May 2016 and the other via Amazon’s Mechanical Turk (MTurk) in October 2016. The lab study included 32 participants recruited from the general public of Southern California, and the MTurk study had 18 participants. For the hypoth- esis that elected officials’ corruption records would be associated with face-based inferences of corruptibility, the laboratory pilot study yielded an estimated effect size
  • 13. of 1.06, and the MTurk pilot study yielded an estimated effect size of 1.05, justifying a minimum sample size of 16 participants. Given these results and to ensure sufficient power even with dropout, we recruited 100 MTurk par- ticipants in November 2016. We selected participants who were native English speakers, located in the United States, and 18 years old or older. In addition, they had to have normal or corrected-to-normal vision, an educa- tional attainment of high school or above, a good MTurk participation history (a human-intelligence-task, or HIT, approval rate ≥ 95% and ≥ 1,000 HITs approved), and no prior participation in our pilot studies. Eighteen individuals were excluded in total, 2 for not being native English speakers, 6 for pressing the same response key for all trials in a block, and 10 for failing to input valid responses for more than 10% of the trials in a block (responses were considered not valid if missing or entered within 100 ms—the minimum time needed for visual exploration of the face; Olivola & Todorov, 2010). After exclusion, there were 82 par- ticipants in our final sample (42 female; age: M = 39 years, SD = 12; 84% White, 10% Black, 5% Asian). Stimuli. Stimuli were photos of 72 real elected officials. All were Caucasian males who have held federal or state legislative offices in the United States. Photos were offi- cial headshots obtained from government websites and personal campaign websites (63%), news articles (23%), and Wikipedia (14%). All photos were converted to gray-scale Facial Inferences and Corruption 1809 images on a plain gray background and cropped to a uni-
  • 14. form size. All faces were frontal, smiling, in clear focus, and centered in the middle of the image. Among the 72 officials, half were convicted of political corruption (corrupt officials), and the other half had clean records (noncorrupt officials). The cor- rupt officials were from two Wikipedia data sets (list of American state and local politicians convicted of crimes: https://en.wikipedia.org/wiki/List_of_American_state_ and_local_politicians_convicted_of_crimes; list of American federal politicians convicted of crimes: https://en.wikipedia.org/wiki/List_of_American_fed eral_politicians_convicted_of_crimes). To reduce sources of variability, we included only officials who were Caucasian, were male, held federal or state legisla- tive offices, and were convicted between 2001 and 2016 of political corruption conducted while in office (brib- ery, money laundering, embezzlement, mail fraud, wire fraud, tax fraud, conflict of interest, misusing funds, misusing office, or falsifying records). In addition, age information for these officials had to be publicly avail- able, as did frontal photographs of acceptable clarity in which the official was smiling. All photographs had been taken while officials were in office. Most photos of the corrupt officials had a known creation date, and we confirmed that the photos were taken before their conviction (72%); for the rest of the photos (28%), the creation date was unknown (analyses were also per- formed when excluding data for these stimuli; the pat- tern of results did not change). The noncorrupt officials were randomly matched from the list of incumbents who had clean records, were holding the same office in the same state, and were of the same gender, the same race, and similar age (±12 years) as the corrupt officials during the period of their misconduct. For instance, if the stimuli contained a Caucasian male cor-
  • 15. rupt official who was a member of the Arizona House of Representatives during his misconduct at the age of 55, then a noncorrupt official would be randomly selected from our available stimulus set from the list of Arizona House of Representatives incumbents who had a clean record and who was a Caucasian male between the ages of 43 and 67. Procedures. Participants were not informed of the pur- pose of the study or the sampling of the stimuli. In par- ticular, they were not given any information about the percentage of politicians in our stimulus set who might be corrupt in real life. They were told only that they would view a series of politician photos and that they should judge how corruptible, dishonest, selfish, trust- worthy, and generous these politicians looked to them (experiment instructions are available at https://osf.io/ k4mds/). Participants completed five blocks of experi- ments, with each block corresponding to judging one trait for all faces. The ordering of the faces within each block as well as the ordering of the blocks were randomized. Each block started with an instruction screen that specified the trait to be judged (e.g., corruptibility). Participants were instructed to make their decisions as quickly and precisely as possible. Six practice trials familiarized participants with the task. Participants viewed photos of officials one at a time in randomized order and made judgments. Each trial began with a fixation cross, followed by the photo (1 s) with a 5-point Likert scale below it. Scales were anchored with bipolar adjectives (Fig. 1). Participants could make a decision as soon as the photo appeared and within 4 s after the photo disappeared. The orientation of the scale was randomized across blocks, and scores were reverse-
  • 16. coded as needed. After completing all five blocks of ratings, partici- pants were asked whether they had recognized any of the officials and filled out a short survey questionnaire 0.5–1.5 s 1 s Maximum of 4 s 0.5 s Time Fig. 1. An example trial in the corruptibility-judgment block. Each trial began with a fixation cross. Then a photo of an official appeared for 1 s. The orientation of the scale was randomly flipped for each block and each participant. Participants made a decision by pressing one of the number keys from “1” to “5” on their keyboard. As soon as a valid key was pressed (or 4 s after the photo disappeared if no valid key was pressed), the trial ended, and there was a blank interstimulus interval. 1810 Lin et al. on demographic characteristics, political attitudes, and personality. Results Reliability of face-based trait inferences. Following our preregistered plan, we excluded from further analy- sis any responses faster than 100 ms and data for officials who were recognized. Among the 82 participants, 7 rec- ognized one official (in total, four officials were recog-
  • 17. nized). The percentages of participants who used the full scale to rate the faces ranged from 59% to 68% across the five traits, and over 90% of the participants used scores on both sides of the midpoint to rate the faces (see Fig. S1 in the Supplemental Material available online). First, we checked whether participants gave consis- tent judgments for a face across different traits. We expected consistent ratings for a face on traits with the same valence to be positively correlated and ratings on traits with opposite valences to be negatively corre- lated. Although this was not planned in our preregistra- tion, we computed repeated measures correlations (the R function rmcorr) to determine the common within- individuals correlations for ratings between each pair of traits, to handle the issue of nonindependence in repeated measures. Results (see Table S1 in the Supple- mental Material for coefficients and 95% confidence intervals, or CIs) showed that at an individual level, judgments of a face for traits with the same valence were positively correlated (repeated measures rs rang- ing from .24 to .31, ps < .001), and judgments of a face for traits with opposite valences were negatively cor- related (repeated measures rs ranging from –.30 to –.21, ps < .001). Following our preregistered plan, we also analyzed the consistency of these ratings at an aggre- gate level. Ratings for each face were first averaged over participants, and (tie-corrected) Spearman correlation coefficients were calculated for each pair of traits with those averaged ratings. Aggregate-level judgments for a face were highly consistent across traits because they averaged out the measurement noise inherent in the individual-level correlations (|r| ≥ .75; see Table S2 in the Supplemental Material). Next, intraclass correlation coefficients (ICCs) were
  • 18. computed for each trait separately to test whether infer- ences of a trait showed consensus across participants— ICCs were computed according to type ICC(2, k) on the basis of complete cases. A high ICC indicates that the total variance in ratings is mainly explained by rating variance across images instead of across participants. In line with prior literature (see the introduction), our results showed high consensus among participants for inferences of corruptibility, ICC = .81, F(48, 3888) = 6.4, 95% CI = [.73, .88]; dishonesty, ICC = .82, F(45, 3645) = 6.7, 95% CI = [.74, .89]; selfishness, ICC = .86, F(42, 3402) = 8.1, 95% CI = [.80, .91]; trustworthiness, ICC = .82, F(43, 3483) = 6.7, 95% CI = [.74, .89]; and generos- ity, ICC = .82, F(43, 3483) = 6.6, 95% CI = [.74, .89]. Association between corruption records and face- based trait inferences: preregistered analyses. Our primary interest in the current study was the extent to which trait inferences from a face were associated with actual corruption records. First, we followed the analysis methods planned in our preregistration and tested for these associations on the basis of inference judgments aggregated across participants and individually within subjects. For inferences of a negative trait, we deemed an official to be categorized accurately if he was convicted of corruption and received a high rating (> 3) or, con- versely, if he had a clean record and received a low rating (≤ 3); for inferences of a positive trait, we deemed an official to be categorized accurately if he was convicted of corruption and received a low rating (< 3) or, con- versely, if he had a clean record and received a high rat- ing (≥ 3). One-sample, one-tailed proportion tests against chance (50%) were performed on the aggregated-level
  • 19. accuracies across officials. One-sample one-tailed t tests against chance (50%) were performed on the individual-level accuracies across participants (we also calculated individual-level accuracies by categorizing midpoint 3 in the opposite way; see Table S3 in the Supplemental Material). Results (summarized in Table 1) showed that both aggregate-level and individual- level inferences of traits were associated with actual corruption records of the facial identities at a level better than chance (see Fig. S2 in the Supplemental Material for full distributions of individual-level accuracies). Association between corruption records and face- based trait inferences: extensions to preregistered analyses. Beyond our planned preregistered analyses, we conducted three additional robustness checks on the asso- ciation between trait inferences from faces and corruption records. First, we confirmed that the above-chance accu- racy we observed was not driven just by a small subset of faces: For each trait, we ranked the officials by the num- ber of participants who categorized them accurately; we then calculated the average individual-level accuracy for subsets of stimuli in which the officials were progres- sively excluded one by one from the official who was accurately categorized by most participants to the official who was accurately categorized by fewest participants. For all five traits, average individual-level accuracies decreased smoothly as the highest ranked officials were removed and stayed above chance even after the 12th Facial Inferences and Corruption 1811 highest ranked official was excluded from the stimulus
  • 20. set (see Table S4 in the Supplemental Material). Second, although participants were not informed of the purpose of the study or the percentage of corrupt politicians in our stimulus set (they were told only that these people were politicians), their beliefs (implicit or explicit) about the base rates of corrupt politicians in the real world or the percentage of corrupt politicians in our experiment might bias the ratings they gave. We corrected for such possibly idiosyncratic biases among our participants by calculating individual-level accura- cies using an alternative method. Ratings for each par- ticipant were centered on that participant’s mean across all of his or her ratings on a trait (see Fig. S3 in the Supplemental Material for the full distributions of mean ratings). For this analysis, inferences of a negative trait were deemed accurate if the official had been convicted of corruption and received a rating from a participant that was higher than the participant’s mean rating or, con- versely, if the official had a clean record and received a rating from a participant that was lower than the participant’s mean rating; inferences of a positive trait were deemed accurate if the official was convicted of corruption and received a rating from a participant that was lower than the participant’s mean rating or, con- versely, if the official had a clean record and received a rating from a participant that was higher than the participant’s mean rating. One-sample, one-tailed t tests against chance (50%) were performed on individual- mean-centered accuracies across participants. Corrobo- rating the results reported previously, individual-level trait inferences correlated with officials’ corruption records at a level better than chance, and the effect sizes were large—corruptibility inferences: M = 55.57%,
  • 21. SD = 7.75%, lower bound of 95% CI = 54.14%, t(81) = 6.50, p < .001, d = 0.72; dishonesty inferences: M = 55.12%, SD = 6.43%, lower bound of 95% CI = 53.94%, t(81) = 7.22, p < .001, d = 0.80; selfishness inferences: M = 54.95%, SD = 7.87%, lower bound of 95% CI = 53.50%, t(81) = 5.69, p < .001, d = 0.63; trustworthiness inferences: M = 55.59%, SD = 6.53%, lower bound of 95% CI = 54.39%, t(81) = 7.75, p < .001, d = 0.86; and gener- osity inferences: M = 55.31%, SD = 6.95%, lower bound of 95% CI = 54.03%, t(81) = 6.92, p < .001, d = 0.76. Third, to address the concern that dichotomizing rat- ings into accurate and inaccurate might lead to loss of measurement sensitivity and to handle the nonindepen- dence in ratings due to repeated measures designs, we performed general linear mixed-model (GLMM) analyses for inferences of each trait, respectively. Officials’ cor- ruption records (1 = conviction, 0 = clean) were regressed on individual-level ratings in logistic models, and par- ticipants were treated as random factors (N = 5,757; N was determined by the number of participants multi- plied by the number of faces, excluding omitted obser- vations; observations from a participant for a face would be omitted if ratings were not available for all five traits). In addition, photo characteristics (the official’s age and smile intensity; the presence of glasses, a beard, a mus- tache, and a bald head; image clarity; and image sources) were included as control variables in all models. All continuous variables were standardized. We observed significant effects of trait ratings: Officials who were rated as looking more corruptible, b = 0.23, SE = 0.03, 95% CI = [0.17, 0.29], z = 7.66, p < .001; dis- honest, b = 0.17, SE = 0.03, 95% CI = [0.11, 0.23], z = 5.75, p < .001; and selfish, b = 0.20, SE = 0.03, 95%
  • 22. CI = [0.14, 0.26], z = 6.77, p < .001, were more likely to have been convicted of corruption, whereas officials who were rated as looking more trustworthy, b = −0.19, SE = 0.03, 95% CI = [−0.25, −0.13], z = −6.41, p < .001, and generous, b = −0.20, SE = 0.03, 95% CI = [−0.26, −0.14], z = −6.59, p < .001, were less likely to have been convicted of corruption (for complete lists of coeffi- cients, see Table S5 in the Supplemental Material). Table 1. Results for Correctly Categorized Officials Based on Aggregate-Level Trait Inferences and Individual-Level Trait Inferences From Study 1 Trait Aggregate-level accuracy Average individual-level accuracya Percentage of correctly categorized officials (N = 72) Lower bound of 95% CI χ2(1) p Mean accuracy (N = 82) SD Lower bound of 95% CI t(81) Cohen’s d
  • 23. Corruptibility 69.44% 59.22% 10.13 < .001 55.73% 6.95% 54.46% 7.47 0.82 Dishonesty 70.83% 60.67% 11.68 < .001 54.82% 6.41% 53.64% 6.81 0.75 Selfishness 66.67% 56.36% 7.35 .003 55.10% 6.76% 53.86% 6.83 0.75 Trustworthiness 68.06% 57.79% 8.68 .002 55.03% 6.41% 53.85% 7.10 0.78 Generosity 63.89% 53.53% 5.01 .013 54.97% 5.99% 53.87% 7.51 0.83 Note: CI = confidence interval. aAll ps for this variable are less than .001. 1812 Lin et al. Association between corruption records and face- based trait inferences: further exploration of poten- tial mechanisms. Finally, we performed two additional analyses that were also beyond our preregistration. We performed GLMM analyses on two subsets of data to test two photo-selection–related mechanisms underlying the face–corruption-record association we found. To test the hypothesis that potential negative biases in the convicted officials’ photos that were from sources beyond the con- trol of the officials might be driving the association, we conducted GLMM analyses on a subset of data that included only officials whose photos were self-selected—that is, those from government websites and personal campaign websites (n = 45; 20 were convicted of corruption; in this subset, only 1 official had a beard, and only 2 officials were bald, and therefore these two predictors were removed from the model).
  • 24. The associations between trait inferences and records remained significant—corruptibility inferences: b = 0.24, SE = 0.04, 95% CI = [0.17, 0.32], z = 6.81, p < .001; dishonesty inferences: b = 0.19, SE = 0.04, 95% CI = [0.12, 0.26], z = 5.21, p < .001; selfishness inferences: b = 0.18, SE = 0.04, 95% CI = [0.11, 0.25], z = 5.07, p < .001; trustworthiness inferences: b = −0.20, SE = 0.04, 95% CI = [–0.27, –0.13], z = −5.63, p < .001; and gener- osity inferences: b = −0.17, SE = 0.04, 95% CI = [–0.24, –0.10], z = −4.66, p < .001. To test the hypothesis that potential negative biases in the convicted officials’ photos that were taken after conviction might be driving the face–corruption-record association, we conducted GLMM analyses on a subset of data that included only officials whose photo dates were known (and were prior to the date of conviction, for convicted officials; n = 62; 26 were convicted of corruption). The associations between trait inferences and records became weaker but remained significant— corruptibility inferences: b = 0.17, SE = 0.03, 95% CI = [0.10, 0.23], z = 4.93, p < .001; dishonesty inferences: b = 0.11, SE = 0.03, 95% CI = [0.04, 0.18], z = 3.29, p = .001; selfishness inferences: b = 0.16, SE = 0.03, 95% CI = [0.09, 0.22], z = 4.64, p < .001; trustworthiness inferences: b = −0.14, SE = 0.03, 95% CI = [–0.20, –0.07], z = −4.06, p < .001; and generosity inferences: b = −0.19, SE = 0.03, 95% CI = [–0.26, –0.13], z = −5.74, p < .001. This indicates that while potential biases in photo selec- tion can explain some of the relationship between trait ratings and officials’ records, they cannot entirely account for our main findings. Two additional analyses were preregistered but are not presented in this article; the codes to conduct those
  • 25. analyses can be found at https://osf.io/k4mds/. In our preregistration, we proposed an alternative approach to analyze individual-level ratings (logistic regression with adjusting standard errors for clustering). These analyses are not presented here because the GLMM analyses reported previously are more appropriate for handling repeated measures. We had also planned analyses of correlations between individual-level accu- racies and response times, but these were intended to answer a question that is beyond the scope of the cur- rent article. Study 2 Study 1 showed that compared with peers with clean records, federal and state officials who were convicted of political corruption were perceived as more corrupt- ible, dishonest, and selfish and less trustworthy and generous. To assess the generalizability of these find- ings, we next tested whether they would also hold for officials from lower levels of governments and for the comparison between officials with clean records and officials who violated campaign finance laws. Method Participants. This study was preregistered before data collection began (https://osf.io/tgzpz/). A pilot study with 24 MTurk workers conducted in February 2017 yielded an estimated effect size of 1.39, justifying a mini- mum sample size of 10 participants. To ensure sufficient power and to have a sample size comparable with that of Study 1, we predetermined the sample size to be 100 participants. The same inclusion and exclusion criteria as in Study 1 were applied (including exclusion of partici-
  • 26. pants from Study 1). We excluded 22 individuals, 3 for not being native English speakers, 2 for pressing the same response key for all trials in a block, and 17 for fail- ing to input valid responses for more than 10% of the trials in a block. After these exclusions, there were 78 MTurk workers who participated in this study in Febru- ary and March 2017 (33 female; age: M = 38 years, SD = 11; 83% White, 9% Black, 6% Asian). Stimuli. Stimuli were photos of 80 real elected officials. All officials were Caucasian males who held offices in California state and local governments. Photos were official headshots obtained from government websites and per- sonal campaign websites (86%), news articles, and Wiki- pedia (14%). All photos were converted to gray scale on a plain gray background and were cropped to a uniform size. All faces were frontal, smiling, in clear focus, and centered in the middle of the image. Among the 80 officials, half violated the California Political Reform Act (officials with violations), and the other half had clean records (officials without viola- tions). The officials with violations were from the data- base of the California Fair Political Practices Commission’s Facial Inferences and Corruption 1813 “Enforcement Cases” (http://www.fppc.ca.gov/about- fppc/hearings-meetings-workshops/current-agenda/ past-agendas.html). To reduce sources of variability, we included only officials who were Caucasian, were male, and had committed a violation related to election cam- paigns (laundered campaign contributions, accepted over-the-limit gifts and contributions, improperly used
  • 27. campaign funds, had conflicts of interest, inadequately or inaccurately reported on campaign statements, did not file campaign statements or filed them late, or were involved in illegal campaign coordination). In addition, we included only successful candidates of the election related to the violation, whose cases merited pursuit of a fine over $215, whose cases were closed between January 2015 and January 2017, whose age information was publicly available, and who had publicly available frontal photographs of acceptable clarity that featured them smiling. All photographs had been taken while in office. Most photos of the officials with violations had a known creation date, and we confirmed that the pho- tos were taken before the cases were closed (88%); for the rest of the photos (12%), the creation date was unknown (analyses were also performed when exclud- ing data for these stimuli). The officials without viola- tions were randomly generated from our available stimulus set from the list of incumbents who had clean records and were holding the same office in the state of California and were the same gender, the same race, and of similar age as the officials with violations. Procedure. Participants followed the same experimental procedure as in Study 1 but viewed a new set of stimuli, as described previously. Results Reliability of face-based trait inferences. Follow- ing our preregistered plan, we excluded responses faster than 100 ms and responses for officials who were recognized. Among the 78 participants, only 1 recog- nized one official. As in Study 1, ratings across faces given by each participant had sufficient variance: The majority of participants used the full scale to rate the
  • 28. faces (the percentages of participants ranged from 58% to 63% across the five traits), and more than 97% of the par- ticipants used scores on both sides of the midpoint to rate the faces (see Fig. S4 in the Supplemental Material). To test how consistently a participant judged a face across different traits, we computed repeated measures correlations (using the R function rmcorr) following the method in Study 1. A participant’s ratings of a face on traits with the same valence were positively correlated (repeated measures rs ranging from .26 to .35, ps < .001), and ratings on traits with opposite valences were negatively correlated (repeated measures rs ranging from –.38 to –.26, ps < .001; see Table S6 in the Supple- mental Material for coefficients and 95% CIs). As planned in our preregistration, we also computed (tie- corrected) Spearman correlation coefficients for each pair of traits using ratings averaged over participants for each face. Aggregate-level judgments of a face were once again highly consistent across traits (|r| ≥ .77; see Table S7 in the Supplemental Material). In line with Study 1 and prior literature, we observed high consensus among participants for face-based judg- ments of corruptibility, ICC = .81, F(64, 4928) = 6.3, 95% CI = [.75, .87]; dishonesty, ICC = .82, F(61, 4697) = 6.7, 95% CI = [.75, .87]); selfishness, ICC = .82, F(45, 3465) = 6.2, 95% CI = [.74, .89]; trustworthiness, ICC = .86, F(58, 4466) = 8.6, 95% CI = [.81, .91]; and generosity, ICC = .87, F(56, 4312) = 8.9, 95% CI = [.82, .91]. ICCs were computed according to type ICC(2, k) on the basis of complete cases. Association between records of violations and face- based trait inferences: preregistered analyses. Fol-
  • 29. lowing the methods in Study 1, we calculated the proportions of correctly categorized officials for each trait on the basis of aggregate-level inferences and individual-level infer- ences as planned in our preregistration. Table 2 summa- rizes one-sample one-tailed proportion-test statistics of aggregate-level accuracies and one-sample one-tailed t-test statistics of individual-level accuracies (see Fig. S5 in the Supplemental Material for full distributions of individual- level accuracies; see Table S8 in the Supplemental Material for average individual-level accuracies calculated with cat- egorizing midpoint 3 in an opposite way). The findings replicated those from Study 1. Association between corruption records and face- based trait inferences: extensions to preregistered analyses. As in Study 1, we conducted three analyses in addition to those we had preregistered to check the robustness of the association between trait inferences from officials’ faces and the records of violations of the facial identities. First, we verified that the above-chance accuracy observed earlier was not driven just by a small subset of faces. Following the same approach as Study 1, we recalculated individual-level accuracies for subsets of stimuli in which the stimulus was excluded one by one from the official who was accurately categorized by most participants to the official who was accurately catego- rized by the fewest participants. Average individual-level accuracies for each trait decreased smoothly as the high- est ranked officials were progressively excluded and stayed above chance even after the 14th highest ranked official was excluded from the stimulus set (see Table S9 in the Supplemental Material). 1814 Lin et al.
  • 30. Second, participants’ beliefs (implicit or explicit) about the base rates of corrupt politicians in the real world or the percentage of corrupt politicians in our study might have influenced their trait judgments from politicians’ faces. Consequently, we computed the individual-level accuracies using an alternative method that took into account the heterogeneous beliefs of base rates across participants. As in Study 1, a mean rating was computed for each participant by averaging the ratings he or she gave across all faces for a trait (see Fig. S6 in the Supplemental Material for the full distributions of mean ratings). This mean rating was used as a cutoff for dichotomizing whether the partici- pant’s rating correctly categorized an official. These individual-mean-centered accuracies across participants were then tested against chance (50%). We observed significantly above-chance accuracies and large effect sizes for corruptibility inferences, M = 55.06%, SD = 6.98%, lower 95% CI = 53.74%, t(77) = 6.40, p < .001, d = 0.72; dishonesty inferences, M = 56.06%, SD = 7.32%, lower 95% CI = 54.68%, t(77) = 7.31, p < .001, d = 0.83; selfishness inferences, M = 55.74%, SD = 7.98%, lower 95% CI = 54.24%, t(77) = 6.36, p < .001, d = 0.72; trust- worthiness inferences, M = 56.00%, SD = 7.05%, lower 95% CI = 54.67%, t(77) = 7.52, p < .001, d = 0.85; and generosity inferences, M = 55.61%, SD = 6.62%, lower 95% CI = 54.36%, t(77) = 7.48, p < .001, d = 0.85. Third, data were further analyzed in GLMM analyses to handle the nonindependence in ratings due to the repeated measures design and avoid any data dichoto- mization. Officials’ records of violations (1 = violation, 0 = clean) were regressed on individual-level ratings in logistic models, and participants were treated as ran- dom factors (N = 6,115; N was determined by the num-
  • 31. ber of participants multiplied by the number of faces excluding omitted observations; observations from a participant for a face would be omitted if ratings were not available for all five traits). In addition, photo characteristics (the official’s age and smile intensity; the presence of glasses, a beard, a mustache, and a bald head; image clarity; and image sources) were included as control variables in all models. All continuous vari- ables were standardized. Results revealed significant effects of trait ratings: Officials who were rated as look- ing more corruptible, b = 0.24, SE = 0.03, 95% CI = [0.18, 0.29], z = 8.19, p < .001; dishonest, b = 0.28, SE = 0.03, 95% CI = [0.23, 0.34], z = 9.77, p < .001; and selfish, b = 0.27, SE = 0.03, 95% CI = [0.21, 0.32], z = 9.31, p < .001, were more likely to have violated campaign finance laws, whereas officials who were rated as look- ing more trustworthy, b = −0.26, SE = 0.03, 95% CI = [–0.32, –0.20], z = −9.05, p < .001, and generous, b = −0.27, SE = 0.03, 95% CI = [–0.33, –0.22], z = −9.53, p < .001, were less likely to have violated campaign finance laws (for complete lists of coefficients, see Table S10 in the Supplemental Material). Association between corruption records and face- based trait inferences: further exploration of poten- tial mechanisms. Finally, to elucidate whether the ob - served associations between trait judgments from faces and records of violations of the facial identities might in part be attributable to unintended properties of photo sources, we performed GLMM analyses on two subsets of data, respectively. For one subset of data, we excluded officials whose photos were not self-selected—that is, we included only officials whose photos were from govern- ment websites and personal campaign websites (N = 69; 33 violated campaign finance laws). Trait inferences based
  • 32. on photos self-selected by the officials were significantly associated with the officials’ records of violations—cor- ruptibility inferences: b = 0.23, SE = 0.03, 95% CI = [0.17, 0.29], z = 7.48, p < .001; dishonesty inferences: b = 0.26, SE = 0.03, 95% CI = [0.20, 0.32], z = 8.68, p < .001; selfish- ness inferences: b = 0.25, SE = 0.03, 95% CI = [0.19, 0.31], z = 8.37, p < .001; trustworthiness inferences: b = −0.25, Table 2. Results for Correctly Categorized Officials Based on Aggregate-Level Trait Inferences and Individual-Level Trait Inferences From Study 2 Trait Aggregate-level accuracy Average individual-level accuracya Percentage of correctly categorized officials (N = 80) Lower bound of 95% CI χ2(1) p Mean accuracy (N = 78) SD Lower bound of 95% CI t(77) Cohen’s d
  • 33. Corruptibility 67.50% 57.79% 9.11 .001 54.72% 6.59% 53.48% 6.32 0.72 Dishonesty 70.00% 60.38% 12.01 < .001 56.15% 6.51% 54.92% 8.34 0.94 Selfishness 65.00% 55.23% 6.61 .005 55.78% 7.21% 54.42% 7.08 0.80 Trustworthiness 70.00% 60.38% 12.01 < .001 56.00% 6.31% 54.74% 7.98 0.90 Generosity 67.50% 57.79% 9.11 .001 55.80% 5.51% 54.76% 9.29 1.05 Note: CI = confidence interval. aAll ps for this variable are less than .001. Facial Inferences and Corruption 1815 SE = 0.03, 95% CI = [–0.31, –0.19], z = −8.31, p < .001; and generosity inferences: b = −0.25, SE = 0.03, 95% CI = [–0.31, –0.19], z = −8.15, p < .001. To test the hypothesis that potential negative biases in photos of officials with violations if the photos were taken after the violation was caught might be driving the face–corruption-record association, we performed GLMM analyses on a subset of data that included only officials for whom the dates on which their photo was taken was known (and were taken prior to the date when the violation was caught, for officials with viola- tions; n = 75; 35 violated campaign finance laws). The associations between trait inferences and records remained significant: corruptibility inferences, b = 0.25, SE = 0.03, 95% CI = [0.19, 0.31], z = 8.33, p < .001; dis- honesty inferences, b = 0.29, SE = 0.03, 95% CI = [0.24, 0.35], z = 9.78, p < .001; selfishness inferences, b = 0.29,
  • 34. SE = 0.03, 95% CI = [0.23, 0.34], z = 9.56, p < .001; trustworthiness inferences, b = −0.28, SE = 0.03, 95% CI = [–0.33, –0.22], z = −9.27, p < .001; and generosity inferences, b = −0.30, SE = 0.03, 95% CI = [–0.36, –0.24], z = −10.17, p < .001. The analysis of the correlation between individual- level accuracies and response times was also planned. Results are not detailed here because these analyses intended to answer a question that is beyond the scope of the current article. For readers interested in these results, all relevant data and analysis codes can be accessed at https://osf.io/k4mds/. Study 3 Study 2 replicated the face–record association found in Study 1 with an independent set of stimuli. However, these findings were based on traits that either were close in meaning to corruptibility (selfishness, dishon- esty) or have the opposite meaning from it (trustworthi- ness, generosity). This resulted in our findings deriving from a single underlying factor with no comparison to different traits. Study 3 therefore aimed to test that the effects found in Studies 1 and 2 could be attributed specifically to corruptibility judgments. Method Participants. This study was preregistered before data collection began (https://osf.io/7a7eu/). To ensure a sample size comparable with that used in Study 1, we recruited 100 participants via MTurk. The same inclusion and exclusion criteria as in Study 1 were applied; in addi- tion, participants were required to have no prior partici- pation in Study 1. We excluded 15 individuals, 2 for not
  • 35. being native English speakers, 2 for pressing the same response key for all trials in a block, and 11 for failing to input valid responses for more than 10% of the trials in a block. After exclusions, data were retained from 85 par- ticipants who were recruited from MTurk in February and March 2017 (42 female; age: M = 37 years, SD = 10; 88% White, 6% Black, 4% Asian). Stimuli and procedure. We used stimuli identical to those from Study 1 and a protocol similar to that of Study 1 except that participants evaluated the officials on a dif- ferent set of traits: corruptibility, aggressiveness, mascu- linity, competence, and ambitiousness. Results Reliability of face-based trait inferences. We excluded from further analysis any responses faster than 100 ms and responses for officials who were recognized. Among the 85 participants, 3 recognized at least one official (in total, two officials were ever recognized). We first checked the variation of individual-level rat- ings across faces for each trait. For all the four traits except masculinity, the majority of participants used the full scale to rate the faces, and over 92% of the participants used scores on both sides of the midpoint to rate the faces (see Fig. S7 in the Supplemental Mate- rial). Not surprisingly, given that all the officials were male, ratings for masculinity were skewed toward mas- culine; however, 80% of the participants still rated the faces on masculinity using scores on both sides of the midpoint. Participants showed high consensus on face-based
  • 36. trait judgments for corruptibility, ICC = .86, F(52, 4368) = 8.7, 95% CI = [.80, .91]; aggressiveness, ICC = .85, F(54, 4536) = 8.3, 95% CI = [.79, .90]; masculinity, ICC = .89, F(53, 4452) = 13.6, 95% CI = [.85, .93]; and competence, ICC = .84, F(58, 4872) = 8.4, 95% CI = [.78, .89]; and the consensus on ambitiousness judgments was fair, ICC = .69, F(53, 4452) = 3.9, 95% CI = [.57, .79]. ICCs were computed according to type ICC(2, k) based on com- plete cases. Association between corruption records and face- based trait inferences. Critically, we replicated the results found in Study 1 with this new set of participants: Officials who were convicted of political corruption looked more corruptible than their peers with clean records, aggregate- level accuracy = 72.22%, lower 95% CI = 62.12%, χ2(1) = 13.35, p < .001; average individual-level accuracy = 56.30%, SD = 7.22%, lower 95% CI = 55.00%, t(84) = 8.04, d = 0.87, p < .001. Additionally, participants in Study 1 and the pres- ent study viewed the same set of stimuli, and their judg- ments (averaged over participants within each study) of how corruptible a face looked were highly correlated, ρ = 0.88, 95% CI = [0.81, 0.92], p < .001. 1816 Lin et al. Interestingly, data from the present study revealed that officials who were perceived as more aggressive were also more likely to have been convicted of political cor- ruption, aggregate-level accuracy = 66.67%, lower 95% CI = 56.36%, χ2(1) = 7.35, p = .003; average individual- level accuracy = 55.09%, SD = 6.13%, lower 95% CI = 53.98%, t(84) = 7.66, d = 0.83, p < .001. However, the associations between corruption records and inferences
  • 37. of masculinity, ambitiousness, and competence were not statistically reliable (95% CIs included 50%, and ps were > .01 for aggregate-level accuracies). Correlation structure of trait inferences. Our pri- mary interest in the current study was whether the observed face–corruption-record associations resulted from inferences of specific traits or global valence evalu- ations of the face. We first analyzed the correlation struc- ture of the trait inferences. To allow for analyses across all nine traits (those from Study 1 and Study 3 combined), we first averaged inferences of traits across participants for each face, and then these aggregate-level data were merged across Study 1 and the present study. Figure 2 shows the Spearman correlation coefficients between each pair of traits. All correlations were in expected directions and generally strong, except for masculinity and ambitiousness. A principal component analysis with varimax rotation indicated that these trait inferences clustered on three distinctive factors: a corruptibility-related factor (corrupt- ibility, dishonesty, selfishness, aggressiveness, generosity, and trustworthiness), a competence-related factor (com- petence and ambitiousness), and a masculinity-related factor (masculinity), each accounting for 57%, 19%, and 15% of the variance in the data, respectively (see Table S11 in the Supplemental Material). A composite score was computed for each factor with the trait inferences that comprised it (Todorov et al., 2005; for the corrupt- ibility-related factor, positive and negative traits were aggregated with opposite signs). Importantly, logistic regression analyses with each of these three factors independently while controlling for other covariates demonstrated that only the corruptibility-related factor
  • 38. was associated with corruption records (Fig. 3). Study 4 Study 3 demonstrated that elected officials’ corruption records were associated with specific trait inferences (e.g., corruptibility). A final important question concerns the facial features that make some officials look more corruptible than others. Study 4 provided a preliminary exploration of this question by first estimating the rela- tionship between objective facial structures, inferences of traits, and officials’ records with causal mediation models (Study 4a; not preregistered). Second, the causal effects suggested by the mediation analysis were directly Fig. 2. Spearman correlation coefficients between each pair of traits across Study 1 and Study 3, calculated with aggregate-level trait ratings (N = 72). Inferences of corruptibility were averaged over the two studies. Facial Inferences and Corruption 1817 tested in an experiment that manipulated the face stim- uli (Study 4b; preregistered). Study 4a Method. Study 1 and Study 2 collected judgments of a common set of traits (corruptibility, dishonesty, selfish- ness, trustworthiness, and generosity) for two distinct sets of officials. The present study merged data from both studies. For trait judgments of an official given by a par- ticipant, we computed a composite score using his ratings
  • 39. across the five traits and referred to it as corruptibility- related trait inferences. Officials were those used in Study 1 and Study 2. Whether an official is corrupt was measured by his record. A record of conviction of political corruption or violation of campaign finance laws suggests that an official is corrupt, and a clean record suggests an offi- cial is not corrupt. Officials’ records are one metric of real-world corruption, but the potential measurement error of this metric is beyond the scope of the present study. Eight metrics representing the distances between facial landmarks specified by anthropometric definitions were measured (Farkas, 1994; Stirrat & Perrett, 2010). Stimuli were the photos of the elected officials used in Study 1 and Study 2. We adjusted for shifts in posture or tilts in head angle by making all measurements only on one side of the face—the side turned most toward the camera—and by generating a face-based reference frame—the horizontal axis of the face was defined by the line connecting the two pupils, and the vertical axis was defined by the line through landmark n (for nasion) that was perpendicular to the horizontal axis (Fig. 4). Summary statistics of these metrics are reported in the Supplemental Material (Table S12). Results. Studies 1 to 3 demonstrated that officials who had clean records were judged differently on corruptibil- ity than officials who were convicted of political corrup- tion and those who violated campaign finance laws. To test the hypothesis that the perceptual difference was mediated by certain facial structures, we analyzed a causal mediation model linking whether an official is cor-
  • 40. rupt, corruptibility-related trait inferences, and each facial structure with data from Study 1 and Study 2 (Fig. 5). The effect of whether an official is corrupt on the facial struc- ture (path a) and the effect of the facial structure on Factor Age at Time of Photo Glasses Bald Head Beard Mustache Smile Intensity Megapixels Image Sources: Wikipedia Image Sources: News Articles –5 0 5 Coefficient 10 Masculinity Factor Competence Factor Corruptibility Factor Fig. 3. Unstandardized logistic regression (N = 72) coefficients
  • 41. for factors and photo characteristics as regressors of the officials’ corruption records (1 = conviction, 0 = clean) in Study 3. Thick lines represent 90% confidence intervals, and thin lines represent 95% confidence intervals. Glasses is a dummy variable with 1 indicating the official wore glasses. Bald head is a dummy variable with 1 indicating the official was bald. Beard is a dummy variable with 1 indicating the official had a beard. Mustache is a dummy variable with 1 indicating the official had a mustache. Smile intensity was coded manually with three levels (1 = smile with no teeth exposed, 2 = smile with teeth but not gums exposed, 3 = smile with gums exposed). There were three sources of photos: government and campaign websites (benchmark), Wikipedia, and news articles. All variables were normalized into the range of [0, 1]. 1818 Lin et al. corruptibility-related trait inferences controlling for whether an official is corrupt (path b) constitute the indirect effect from whether an official is corrupt to corruptibility-related trait inferences (path ab). Path a was estimated with lin- ear regression models. Path b was estimated with linear mixed models in which subjects, images nested within record types, and the interactions between subjects and record types were treated as random factors. The indirect effect was estimated with RMediation in R. The direct effect (path c′ ) of whether an official is corrupt on cor- ruptibility-related trait inferences after controlling for the indirect effect was estimated in the same model as for path b. Photo characteristics (the official’s age and smile intensity; the presence of glasses, a beard, a mustache, and a bald head; image clarity; and image sources) were
  • 42. included as covariates in all models; for simplicity, these paths are not depicted in the figure. Two of the eight facial structures were identified to have significant indirect effects: facial width-to-height ratio (unstandardized coefficient for path ab = 0.06, SE = 0.03, 95% CI = [0.01, 0.12]), and face width/lower face height (unstandardized coefficient for path ab = 0.11, SE = 0.04, 95% CI = [0.04, 0.18]). These results revealed that compared with officials who had clean records, those who were convicted of political corrup- tion and violated campaign finance laws were perceived more negatively (more corruptible, dishonest, and selfish and less trustworthy and generous), and these negative impressions were partially attributable to higher facial width-to-height ratio and face width/lower-face height. Study 4b Study 4a suggests that compared with officials with slimmer faces, officials with wider faces were judged more negatively on corruptibility-related traits. This finding raises an important question: Given the same elected official, is how corruptible he looks influenced by how wide his face is in a photo? Study 4b directly tested this causal hypothesis by manipulating the facial width of the photos and contrasting the degree of cor- ruptibility inferred from the slim, original, and fat ver- sion photos of the same official. Method. Stimuli. This study was preregistered before data col- lection began (https://osf.io/58x6e/). Stimuli were 450 black-and-white headshots of real elected officials. There were three versions of the stimuli: original, fat, and slim.
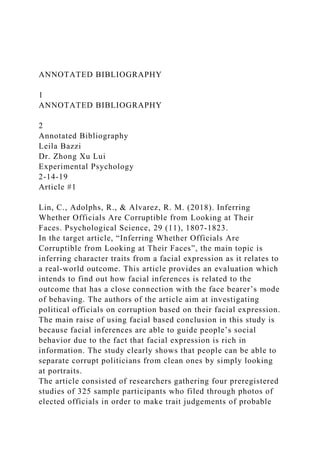
  • 43. Original stimuli consisted of 71 photos from Study 1 and 79 photos from Study 2 (1 photo from Study 1 and 1 photo from Study 2 were excluded from the present study because the manipulation of face width distorted these two faces). These 150 original stimuli were further manipulated with the Adobe Photoshop Face-Aware Liquify tool to increase face width by 7% and decrease face width by 7%, which resulted in two additional ver- sions of each facial identity (see Fig. 6 for an example; all stimuli used in the present study can be accessed at https://osf.io/k4mds/). Fat stimuli consisted of the 150 photos with increased face width, and slim stimuli consisted of the 150 photos with decreased face width. Fig. 4. Illustration of facial landmarks (white points) and the coor- dinate system (red lines). Facial width-to-height ratio was calculated as the bizygomatic width (the horizontal distance from landmark zy to the y-axis multiplied by 2) divided by the upper-face height (the vertical distance from the highest point of the upper lip to the highest point of the eyelids). Face width/lower-face height was calculated as the bizygomatic width divided by the lower-face height (the vertical distance between landmark ex and landmark gn). Lower face/face height was calculated as the lower-face height divided by the physi- ognomic face height (the vertical distance between landmark tr and landmark gn). Cheekbone prominence was calculated as the bizygo-
  • 44. matic width divided by the jawbone width (the horizontal distance from landmark go to the y-axis multiplied by 2). Internal eye- corner distance was calculated as the ratio of the internal eye-corner width (the horizontal distance from landmark en to the y-axis multiplied by 2) to the bizygomatic width. Nose height was calculated as the ratio of the nose length (the vertical distance from landmark n to landmark sn) to the lower face height. Mouth width was calculated as the ratio of the mouth corner distance (the horizontal distance from landmark ch to the y-axis multiplied by 2) to the jawbone width. Nose/mouth width was calculated as the ratio of the nose width (the horizontal distance from landmark al to the y-axis multiplied by 2) to the mouth corner distance. Facial Inferences and Corruption 1819 This percentage of face-width change was the maximum manipulation we could achieve subject to the constraints that all faces should look natural and the manipulation should be subtle enough to go unnoticed. Participants. To investigate our main hypothesis that the same official would be judged as more corruptible when his face was fatter relative to when it was slimmer,
  • 45. we conducted a pilot study on MTurk with 18 partici- pants, which yielded 2,700 observations. These obser- vations gave an estimated effect size of 0.09, justifying a minimum sample size of 16 participants and 2,375 observations. To ensure sufficient power even with data exclusion, we predetermined the sample size to be 100 participants. Participants were required to be located in the United States, to be 18 years old or older, and to have normal or corrected-to-normal vision, an educational attainment of high school or above, a HIT approval rate greater than or equal to 95%, and no prior participation in the pilot study. Additionally, two open-ended ques- tions and one closed-ended question in the survey at the end of the experiment (Table S13 in the Supplemental Material) gauged whether participants noticed that the width of the faces was manipulated; participants who mentioned face width to any of the open-ended ques- tions were excluded from data analysis. Only 1 participant recognized that the face width of the stimuli was manipulated; this individual was excluded from data analyses. Another 19 participants were excluded for failing to input valid responses for more than 10 trials. After exclusions, the final sample consisted of 80 participants (37 female; age: M = 38 years, SD = 10; 89% White, 5% Black, 5% Asian), who were recruited from MTurk in July 2017. Procedures. Participants were not informed about the purpose of the study (they were told only that this was a study about judging how corruptible politicians looked Facial Width-to-Height Ratio Corruptibility-Related Trait InferencesWhether an Official Is
  • 46. Corrupt Path a: 0.13* (0.05) Path b: 0.45*** (0.11) Path c′: 0.28*** (0.05) Path ab: 0.06* (0.03), 95% CI = [0.01, 0.12] Face Width/Lower Face Height Corruptibility-Related Trait InferencesWhether an Official Is Corrupt Path a: 0.11*** (0.03) Path b: 0.96*** (0.22) Path c′: 0.26*** (0.05) Path ab: 0.11** (0.04), 95% CI = [0.04, 0.18] a b Fig. 5. Results of causal mediation analyses showing the
  • 47. influence of whether an official is corrupt on corruptibility- related trait infer- ences, as mediated by facial structures (Study 4a). A mediation model was constructed for each of the eight facial metrics separately and was tested with data from Study 1 and Study 2. Two of the eight facial metrics, (a) face width-to-height ratio and (b) face width/lower-face height, showed significant indirect effects. Unstandardized coefficients are shown, and standard errors are given in parentheses. Coef- ficients for path a were estimated in linear regression models. Coefficients for path b and path c′ were estimated in linear mixed models. The indirect effects of path ab were estimated with RMediation in R. Photo characteristics were included as covariates in all models; for simplicity, these variables and the corresponding paths are not depicted in the figure. No indirect effect was found for the other six facial metrics. Asterisks indicate significant paths (*p < .05, **p < .005, ***p < .0005). CI = confidence interval. 1820 Lin et al. on the basis of their photos). They were instructed to make their decisions as quickly and precisely as pos- sible. Participants viewed and evaluated the 450 stimuli one at a time in 10 blocks; they had the option to take breaks between blocks. The order of the 450 stimuli was randomized under a constraint that different ver- sions of photos of the same facial identity did not appear within 10 consecutive images. Participants indicated how corruptible each face looked on a 9-point Likert scale
  • 48. anchored with bipolar adjectives (corruptible and incor- ruptible) and were encouraged to use the full range to rate the faces. The orientation of the scale was random- ized for each participant. Except for the change of the Likert scale, the present study followed the same experi- mental procedures as the previous studies. After rating all stimuli, participants were asked whether they had recog- nized any of the officials or noticed that the width of the faces were manipulated (see Table S13) and filled out a short survey questionnaire on demographic characteris- tics, political attitudes, and personality. Results. The survey responses revealed that when told that photos of the same politicians were shown more than once during the experiment and asked whether photos of the same politician were used, 61 of the 80 participants reported that they believed the repeated photos of the same politician were identical. The rest of the participants either indicated that they were not sure whether the photos of the same politician were different or identical (n = 3) or mentioned that the faces in these photos might have different facial expressions (n = 4), hair or facial hair (n = 4), smile intensity (n = 3), eyes (n = 1), glasses (n = 1), or head shapes (n = 1); the indi- vidual pictured might be wearing different clothing (n = 1); or some photos looked scarier (n = 1), might be mixed with parts from other pictures (n = 1), or might be taken from different angles (n = 1). Most of the participants (71.25%) used the full range to rate the faces as instructed, and all participants used both sides of the scale to rate the faces. Data were analyzed in linear mixed models, and subjects, images, and the interactions between subjects and versions were treated as random factors. As hypothesized,
  • 49. individual-level data showed that face width had a sig- nificant effect on inferences of corruptibility; specifi- cally, a participant perceived an official as more corruptible when his face was fat relative to when his face was slim, b = 0.06, SE = 0.02, 95% CI = [0.03, 0.09], p < .001, d = 0.22. This unconscious perceptual bias was symmetrically driven by increasing face width, b = 0.06, SE = 0.02, 95% CI = [0.02, 0.11], p = .008, d = 0.22, and decreasing face width, b = 0.06, SE = 0.03, 95% CI = [0.02, 0.11], p = .025, d = 0.22. We further ana- lyzed whether the perceptual bias to rate the fat version of a face as more corruptible than the slim version of that face varied as a function of the baseline corrupt- ibility rating of the original photo, as planned in our preregistration. The ratings for each official in each ver- sion of the photo were first averaged over participants, and then these aggregate-level ratings for different pho- tos of the same official were used to calculate perceptual biases. We did not observe significant correlation Fig. 6. Example of the same face in (a) slim, (b) original, and (c) fat versions. Facial Inferences and Corruption 1821 between perceptual bias (fat vs. slim versions of the photo) and the corruptibility inferences based on the original version of the photo, ρ = 0.01, SE = 0.03, 95% CI = [–0.06, 0.07], p = 0.789 (photo characteristics were included as control variables; see Fig. S8 in the Supple- mental Material). General Discussion
  • 50. Across three preregistered studies, we found evidence supporting the hypothesis that trait-specific inferences, such as corruptibility, made from photographs of offi- cials’ faces are associated with real-world measures of political corruption and violation. This association was replicated across officials at different levels of govern- ment. It was not driven by just a small subset of faces or fully explained by other photo characteristics, such as smile intensity. The association remained robust when analyses controlled for heterogeneous beliefs about corruption base rates and potential photo- selection biases. It is important to distinguish accuracy as defined by agreement with consensus judgments from accuracy related to actual real-world metrics (Funder, 1987). Similar to prominent studies of the association between competence judgments and election success (e.g., Todorov et al., 2005), our present work has pursued the latter interpretation of accuracy. The accuracy related to corruption records we found was comparable with that related to election success—for instance, Todorov et al. (2005) found that for 2004 U.S. Senate races, aggregate-level accuracy was 68.8%, and average individual-level accuracy was 53%. We emphasize that for our present work and a large literature on the asso- ciation between face-based trait judgments and real- world metrics, accuracies at an individual level were only slightly above chance (but significantly so), and participants were very often wrong. However, the con- siderably larger effect sizes for aggregated judgments have important implications for real-world collective deci- sions such as elections and corruption investigations. In Study 4, we found that an official was perceived as more corruptible when his face was manipulated to
  • 51. be slightly wider and less corruptible when his face was manipulated to be slightly slimmer, even though participants did not detect such manipulation of the facial identity. Our finding dovetails with the large lit- erature on perceptual biases related to face width-to- height ratio (e.g., Deska et al., 2018) and the literature on weight stereotypes, which shows that overweight individuals are judged as lazy, greedy, selfish, and less trustworthy (Greenleaf, Chambliss, Rhea, Martin, & Morrow, 2006; Larkin & Pines, 1979). Yet widening or narrowing the face potentially introduces other changes to the geometry of the face. It will be important for future studies to investigate which of these correlated structural changes are in fact detected by the brain and drive the change in social judgments that perceivers make. The detailed causal mechanisms that ultimately underlie the association between a record of corruption and face-based judgments of corruptibility we found are likely to be complex and bidirectional (Swann, 1984). In particular, people who look corruptible might be more likely to be approached by others with the intent to corrupt them, which in turn results in the mutual behaviors required for corruption to occur (Kruglanski, 1989); further experimental studies would be required to tease apart their relative contributions. Given these considerations, we emphasize that our findings should be interpreted with caution. Do they show that corruptible individuals have a different facial structure, as suggested by physiognomy? There are strong reasons to be skeptical. First, the record of an official is unlikely to be an errorless measure of how corruptible he actually is. Second, the photographs
  • 52. posted on government and campaign websites might provide a biased representation of an official’s face—for example, some photos have clearly been retouched for skin texture and lighting. Third, there might well be other unknown confounding effects. For example, per- haps officials who committed a corrupt act might have looked more guilty when they posed for photos (even prior to being convicted), which in turn could have provided subtle visual cues for trait judgments. Fourth, both face judgments and social behaviors strongly depend on context (Todorov, 2017). For instance, in the context of business corruption, business executives’ corruption records were not associated with how trust- worthy they looked (Rule, Krendl, Ivcevic, & Ambady, 2013). These findings and the considerations mentioned previously suggest that the self-fulfilling prophecy (e.g., Haselhuhn et al., 2013; Slepian & Ames, 2016) together with biases in judicial decisions (e.g., Wilson & Rule, 2015; Zebrowitz & McDonald, 1991) may be more plau- sible explanations than physiognomy for the face– corruption-record association we found. Future studies should examine multiple photographs of the same official taken in different contexts (e.g., posed and candid photos) and at different time points (e.g., from the time he ran for office, after misconducts, and after prosecutions). There are important limitations to the generalizability of our studies (Simons, Shoda, & Lindsay, 2017). They leave open whether such trait judgments operate in the real world, where faces are not photographs and whether similar associations would hold for other cultures or for antisocial behaviors among people in general. It is also possible that corruptibility judgments are better
  • 53. 1822 Lin et al. correlated with other social behaviors that we did not measure, which in turn provide an indirect link to recorded corruption—indeed, it is conceivable that pros- ecutors’ decisions might be one such social behavior. We conclude with a future direction suggested by this work. The ultimate explanation for the findings we report must reside in evolutionarily based or experience- based neural mechanisms in the brains of both the subjects making the social judgments and the officials engaging in the corrupt behaviors. For instance, there are already claims that individual differences in traits can be predicted from patterns of brain activity (Dubois, Galdi, Paul, & Adolphs, 2018; Finn et al., 2015), and there is a large literature showing that social inferences engage specific neural networks in the brains of per- ceivers (Spunt & Adolphs, 2017). Future studies using neuroimaging could help further uncover the causal mechanisms behind our findings. Action Editor D. Stephen Lindsay served as action editor for this article. Author Contributions All authors developed the study concept and designed the study. Testing and data collection were performed by C. Lin, who also analyzed and interpreted the data under the super- vision of R. Adolphs and R. M. Alvarez. All authors drafted the manuscript. All the authors approved the final manuscript for submission. Acknowledgments
  • 54. We thank Colin F. Camerer, Antonio Rangel, Anita Tusche, and Shuo Wang for helpful conversations. Declaration of Conflicting Interests The author(s) declared that there were no conflicts of interest with respect to the authorship or the publication of this article. Funding This research was supported in part by a Conte Center grant from the National Institute of Mental Health (P50MH094258). Supplemental Material Additional supporting information can be found at http:// journals.sagepub.com/doi/suppl/10.1177/0956797618788882 Open Practices All data and materials have been made publicly available via the Open Science Framework (OSF) and can be accessed at https://osf.io/chpfn/. The design and analysis plans for the experiments were preregistered at the OSF (Study 1: https:// osf.io/mge8r/, Study 2: https://osf.io/tgzpz/, Study 3: https://osf .io/7a7eu/, Study 4: https://osf.io/58x6e/). The complete Open Practices Disclosure for this article can be found at http:// journals.sagepub.com/doi/suppl/10.1177/0956797618788882. This article has received badges for Open Data, Open Materials, and Preregistration. More information about the Open Practices badges can be found at http://www.psychologicalscience.org/ publications/badges.
  • 55. References Antonakis, J., & Eubanks, D. L. (2017). Looking leadership in the face. Current Directions in Psychological Science, 26, 270–275. Berry, D. S., & Zebrowitz-McArthur, L. (1988). What’s in a face? Facial maturity and the attribution of legal respon- sibility. Personality and Social Psychology Bulletin, 14, 23–33. Blair, I. V., Judd, C. M., & Chapleau, K. M. (2004). The influ- ence of Afrocentric facial features in criminal sentencing. Psychological Science, 15, 674–679. Cogsdill, E. J., Todorov, A. T., Spelke, E. S., & Banaji, M. R. (2014). Inferring character from faces: A developmental study. Psychological Science, 25, 1132–1139. Deska, J. C., Lloyd, E. P., & Hugenberg, K. (2018). Facing humanness: Facial width-to-height ratio predicts ascrip- tions of humanity. Journal of Personality and Social Psychology, 114, 75–94. Dubois, J. C., Galdi, P., Paul, L. K., & Adolphs, R. (2018). A distributed brain network predicts general intelligence from resting-state human neuroimaging data. bioRxiv, Article 257865. doi:10.1101/257865 Engell, A. D., Haxby, J. V., & Todorov, A. (2007). Implicit trustworthiness decisions: Automatic coding of face properties in the human amygdala. Journal of Cognitive Neuroscience, 19, 1508–1519. Farkas, L. G. (Ed.). (1994). Anthropometry of the head and
  • 56. face. New York, NY: Raven Press. Finn, E. S., Shen, X., Scheinost, D., Rosenberg, M. D., Huang, J., Chun, M. M., . . . Constable, R. T. (2015). Functional connectome fingerprinting: Identifying individuals using patterns of brain connectivity. Nature Neuroscience, 18, 1664–1671. Funder, D. C. (1987). Errors and mistakes: Evaluating the accuracy of social judgment. Psychological Bulletin, 101, 75–90. Genevsky, A., & Knutson, B. (2015). Neural affective mecha- nisms predict market-level microlending. Psychological Science, 26, 1411–1422. Geniole, S. N., Denson, T. F., Dixson, B. J., Carré, J. M., & McCormick, C. M. (2015). Evidence from meta-analyses of the facial width-to-height ratio as an evolved cue of threat. PLOS ONE, 10(7), Article e0132726. doi:10.1371/ journal.pone.0132726 Gheorghiu, A. I., Callan, M. J., & Skylark, W. J. (2017). Facial appearance affects science communication. Proceedings of the National Academy of Sciences, USA, 114, 5970– 5975. Facial Inferences and Corruption 1823 Greenleaf, C., Chambliss, H., Rhea, D. J., Martin, S. B., & Morrow, J. R. (2006). Weight stereotypes and behavioral intentions toward thin and fat peers among White and Hispanic adolescents. Journal of Adolescent Health, 39, 546–552.
  • 57. Hamermesh, D. S. (2011). Beauty pays: Why attractive people are more successful. Princeton, NJ: Princeton University Press. Haselhuhn, M. P., Wong, E. M., & Ormiston, M. E. (2013). Self-fulfilling prophecies as a link between men’s facial width-to-height ratio and behavior. PLOS ONE, 8(8), Article e72259. doi:10.1371/journal.pone.0072259 Jussim, L. (1986). Self-fulfilling prophecies: A theoretical and integrative review. Psychological Review, 93, 429–445. Kruglanski, A. W. (1989). The psychology of being “right”: The problem of accuracy in social perception and cogni- tion. Psychological Bulletin, 106, 395–409. Larkin, J. C., & Pines, H. A. (1979). No fat persons need apply: Experimental studies of the overweight stereotype and hiring preference. Sociology of Work and Occupations, 6, 312–327. Lin, C., Adolphs, R., & Alvarez, R. M. (2017). Cultural effects on the association between election outcomes and face- based trait inferences. PLOS ONE, 12(7), Article e0180837. doi:10.1371/journal.pone.0180837 Olivola, C. Y., Eastwick, P. W., Finkel, E. J., Hortacsu, A., Ariely, D., & Todorov, A. (2014). A picture is worth a thou- sand inferences: First impressions and mate selection in Internet matchmaking and speed-dating. Pittsburgh, PA: Tepper School of Business, Carnegie Mellon University. Olivola, C. Y., & Todorov, A. (2010). Elected in 100 milli- seconds: Appearance-based trait inferences and voting. Journal of Nonverbal Behavior, 34, 83–110.
  • 58. Penton-Voak, I. S., Pound, N., Little, A. C., & Perrett, D. I. (2006). Personality judgments from natural and composite facial images: More evidence for a “kernel of truth” in social perception. Social Cognition, 24, 607–640. Ravina, E. (2012). Love & loans: The effect of beauty and per- sonal characteristics in credit markets. SSRN. doi:10.2139/ ssrn.1107307 Rezlescu, C., Duchaine, B., Olivola, C. Y., & Chater, N. (2012). Unfakeable facial configurations affect strategic choices in trust games with or without information about past behavior. PLOS ONE, 7(3), Article e34293. doi:10.1371/ journal.pone.0034293 Rose-Ackerman, S. (2013). Corruption: A study in political economy. San Diego, CA: Academic Press. Rule, N. O., Ambady, N., Adams, R. B., Jr., Ozono, H., Nakashima, S., Yoshikawa, S., & Watabe, M. (2010). Polling the face: Prediction and consensus across cultures. Journal of Personality and Social Psychology, 98, 1–15. Rule, N. O., Krendl, A. C., Ivcevic, Z., & Ambady, N. (2013). Accuracy and consensus in judgments of trustworthiness from faces: Behavioral and neural correlates. Journal of Personality and Social Psychology, 104, 409–426. Simons, D. J., Shoda, Y., & Lindsay, D. S. (2017). Constraints on generality (COG): A proposed addition to all empirical papers. Perspectives on Psychological Science, 12, 1123–1128. Slepian, M. L., & Ames, D. R. (2016). Internalized impres-
  • 59. sions: The link between apparent facial trustworthiness and deceptive behavior is mediated by targets’ expecta- tions of how they will be judged. Psychological Science, 27, 282–288. Spunt, R. P., & Adolphs, R. (2017). The neuroscience of understanding the emotions of others. Neuroscience Letters. Advance online publication. doi:10.1016/j.neu let.2017.06.018 Stirrat, M., & Perrett, D. I. (2010). Valid facial cues to coop- eration and trust: Male facial width and trustworthiness. Psychological Science, 21, 349–354. Swann, W. B. (1984). Quest for accuracy in person percep- tion: A matter of pragmatics. Psychological Review, 91, 457–477. Todorov, A. (2017). Face value: The irresistible influence of first impressions. Princeton, NJ: Princeton University Press. Todorov, A., Mandisodza, A. N., Goren, A., & Hall, C. C. (2005). Inferences of competence from faces predict elec- tion outcomes. Science, 308, 1623–1626. Todorov, A., Olivola, C. Y., Dotsch, R., & Mende-Siedlecki, P. (2015). Social attributions from faces: Determinants, con- sequences, accuracy, and functional significance. Annual Review of Psychology, 66, 519–545. Valentine, K. A., Li, N. P., Penke, L., & Perrett, D. I. (2014). Judging a man by the width of his face: The role of facial ratios and dominance in mate choice at speed-dating events. Psychological Science, 25, 806–811. Valla, J. M., Ceci, S. J., & Williams, W. M. (2011). The accu-
  • 60. racy of inferences about criminality based on facial appearance. Journal of Social, Evolutionary, and Cultural Psychology, 5(1), 66–91. Van’t Wout, M., & Sanfey, A. G. (2008). Friend or foe: The effect of implicit trustworthiness judgments in social deci- sion-making. Cognition, 108, 796–803. Wilson, J. P., & Rule, N. O. (2015). Facial trustworthi- ness predicts extreme criminal-sentencing outcomes. Psychological Science, 26, 1325–1331. Zebrowitz, L. A., & McDonald, S. M. (1991). The impact of liti- gants’ baby-facedness and attractiveness on adjudications in small claims courts. Law and Human Behavior, 15, 603–623.