The Path to Product Excellence: Avoiding Common Pitfalls and Enhancing Commun...
ETFs review - August 2012
1. 1
ETFs Review August 10, 2012
Exchange Traded Funds (ETFs) Review – August 2012
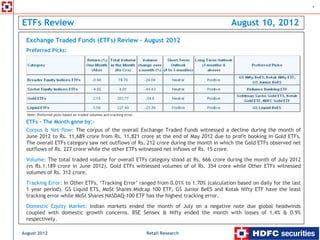
Preferred Picks:
Note: Preferred picks based on traded volumes and tracking error.
ETFs – The Month gone by:-
Corpus & Net flow: The corpus of the overall Exchange Traded Funds witnessed a decline during the month of
June 2012 to Rs. 11,689 crore from Rs. 11,821 crore at the end of May 2012 due to profit booking in Gold ETFs.
The overall ETFs category saw net outflows of Rs. 212 crore during the month in which the Gold ETFs observed net
outflows of Rs. 227 crore while the other ETFs witnessed net inflows of Rs. 15 crore.
Volume: The total traded volume for overall ETFs category stood at Rs. 666 crore during the month of July 2012
(vs Rs.1,189 crore in June 2012). Gold ETFs witnessed volumes of of Rs. 354 crore while Other ETFs witnessed
volumes of Rs. 312 crore.
Tracking Error: In Other ETFs, ‘Tracking Error’ ranged from 0.01% to 1.70% (calculation based on daily for the last
1 year period). GS Liquid ETS, MoSt Shares Midcap 100 ETF, GS Junior BeES and Kotak Nifty ETF have the least
tracking error while MoSt Shares NASDAQ-100 ETF has the highest tracking error.
Domestic Equity Market: Indian markets ended the month of July on a negative note due global headwinds
coupled with domestic growth concerns. BSE Sensex & Nifty ended the month with losses of 1.4% & 0.9%
respectively.
August 2012 Retail Research
2. 2
ETFs Review contd…
Global Equity Market: The world markets ended the month of July 2012 on a mixed note. China continued to
underperform, being reported as a top loser (down 5.5%) for second straight month. US & Hong Kong ended the
month marginally higher by 1% (Dow Jones) & 1.8% respectively.
Gold Market: Gold ETFs posted an average return of 2.15% in absolute term during the month of July 2012 despite
the prices of gold in USD term ended the month flat. The weakness in the Indian rupee against the U.S. dollar
aided gold to maintain its sheen in domestic market.
Fixed Income market: Improved liquidity conditions in the system resulted in the moderation in the rates of short
term instruments.
I. Trend in the AUM (as of June 2012):
The corpus of the overall ETFs witnessed a decline during the month of June 2012 to Rs. 11,689 crore from Rs.
11,821 crore, as seen in the month earlier. The decline in the AUM was mainly attributable to the profit booking
at Gold ETF side which is evident from the outflows of Rs. 227 crore seen in the gold ETFs during the month.
The other ETFs category which include Equity ETFs, Liquid ETFs and International ETFs witnessed an increase in
the month of June 2012 to Rs. 1,603 crore from Rs. 1,509 crore (as of May month) mainly due to positive equity
markets. Better performance of banking and infra stocks in the month was also one of the reasons for the increase
in the AUM of the category.
Changes in the corpus of ETFs over various time frames:
August 2012 Retail Research
3. 3
ETFs Review contd…
Corpus of the Gold ETFs saw appreciation more than 4 times in last two year period on the back of huge investor
interest as a safe heaven while the price of domestic gold witnessed rise of 66% (absolute terms) over the period.
Growth of ETF Corpus over periods:
12000 3500
10000 Gold ETF Other ETFs 3000
8000 2500
6000 2000
4000 1500
2000 1000
0 500
Dec-09
Feb-10
Dec-10
Feb-11
Dec-11
Feb-12
Jun-09
Oct-09
Jun-10
Oct-10
Jun-11
Oct-11
Jun-12
Aug-09
Apr-10
Aug-10
Apr-11
Aug-11
Apr-12
Note: Other ETFs include Equity ETFs, Liquid ETFs and International ETFs. Source: AMFI monthly Data.
II. Trend in the Fund Flows (as of June 2012):
Gold ETF witnessed an all time high monthly net outflow of Rs 227 crore in the month of June as the investors
booked the profit. The depreciation in the rupee value compared to the USD resulted in increase in local gold
prices to above Rs 30,000 per 10g, notwithstanding the price of the gold softened in the global markets.
The outflow trend from gold ETFs is likely to continue for next few months as the prices of the gold remain
volatile given the global economic crisis.
Other ETFs, covering equity and liquid ETFs, saw fund inflows for the second straight month given the positive
trend in the equity markets coupled with increased risk aversion among investors.
August 2012 Retail Research
4. 4
ETFs Review contd…
The charts below portray the fund flows into Gold ETFs and Other ETFs categories (as per AMFI monthly data) over
the last three year periods. Gold ETFs saw net inflows for most of the months reflecting the investors’ increased
interest. How ever, the outflows in the last 2 months show the opportunistic selling that hit the gold ETFs. In the
case of other ETFs there is no consistency in flows as inflows in one month is followed by outflows in the next and
so on.
Net flows in Gold ETFs over periods:
1200
1000
800
600
400
200
0
-200
-400
Mar-09
May-09
Jun-09
Jul-09
Oct-09
Nov-09
Dec-09
Jan-10
Feb-10
Mar-10
May-10
Jun-10
Jul-10
Oct-10
Nov-10
Dec-10
Jan-11
Feb-11
Mar-11
May-11
Jun-11
Jul-11
Oct-11
Nov-11
Dec-11
Jan-12
Feb-12
Mar-12
May-12
Jun-12
Sep-09
Sep-10
Sep-11
Apr-09
Aug-09
Apr-10
Aug-10
Apr-11
Aug-11
Apr-12
Net flows in other ETFs over periods:
600
400
200
0
-200
-400
-600
-800
Mar-09
May-09
Jun-09
Jul-09
Oct-09
Nov-09
Dec-09
Jan-10
Feb-10
Mar-10
May-10
Jun-10
Jul-10
Oct-10
Nov-10
Dec-10
Jan-11
Feb-11
Mar-11
May-11
Jun-11
Jul-11
Oct-11
Nov-11
Dec-11
Jan-12
Feb-12
Mar-12
May-12
Jun-12
Sep-09
Sep-10
Sep-11
Apr-09
Aug-09
Apr-10
Aug-10
Apr-11
Aug-11
Apr-12
August 2012 Retail Research
5. 5
ETFs Review contd…
III. Trend in the Folios (as of June 2012):
Gold ETFs witnessed a decline in the number of folios by 10,817 in the month of June to 4.9 lakh, the first decline
after February 2012, due to huge redemption by the way of profit booking. The equity funds also saw reduction in
the number of folios over the periods as the category witnessed losing out the folios close to 17 lakh in the last
one year period. That was mainly due to the scheme mergers and folio de-duplication exercise carried out by
R&Ts in the recent periods apart from redemptions. Contrary to this, number of folios of ‘Other ETFs’ have been
increasing over periods due to attraction towards the diversified, broader market indices in the wake of risk
aversion.
Changes in investors’ Gold ETF folios:
600,000
500,000
400,000
300,000
200,000
100,000
0
Oct-10
Nov-10
Dec-10
Jan-11
Feb-11
Mar-11
Jun-11
Jul-11
Oct-11
Nov-11
Dec-11
Jan-12
Feb-12
Mar-12
May-12
Jun-12
Sep-10
Sep-11
Apr-11
Aug-11
Apr-12
August 2012 Retail Research
6. 6
ETFs Review contd…
The below chart reveals the fact that the number of folios of ‘Other ETFs’ have increased despite the number of
folios of equity funds falling over periods due to investors’ risk aversion attitude.
Changes in the number of folios in ‘Other ETFs Vs. Equity Funds:
180,000 Other ETFs (LHS) Equity Folio (RHS) 40,000,000
160,000 39,500,000
140,000 39,000,000
120,000 38,500,000
100,000 38,000,000
80,000 37,500,000
60,000 37,000,000
40,000 36,500,000
20,000 36,000,000
0 35,500,000
Oct-10
Nov-10
Dec-10
Jan-11
Feb-11
Mar-11
May-11
Jun-11
Jul-11
Oct-11
Nov-11
Dec-11
Jan-12
Feb-12
Mar-12
May-12
Jun-12
Sep-10
Sep-11
Apr-11
Aug-11
Apr-12
IV. Trend in the traded volume (as of July 2012):
The total traded volume of the overall ETF category during July 2012 stood at Rs. 666 crore, which was 44% less
than that of the previous month of June 2012 (Rs. 1,189 crore). The volume data includes all ETFs, taken from
NSE except 2 Sensex ETFs.
The reduction in the turnover was seen more in ‘Gold ETFs’ and ‘sector indices ETFs’ compared to the previous
month. Goldman Sachs Gold ETF and Goldman Sachs Liquid ETF are the top traded ETFs in the overall category
during the last month where they witnessed turnover of Rs.229 crore and Rs. 227 crore respectively.
Among the ETFs, the ‘Gold ETFs’ contributed 53% of the total trading volumes during the month, followed by the
‘Liquid ETFs’ and ‘Broader Indices ETFs’ which contributed 34% and 12% respectively.
August 2012 Retail Research
7. 7
ETFs Review contd…
Segment break up of total turnover (Rs. 666 crore) in the ETF category during July 2012:
Gold ETFs (353.77 Crs)
Liquid ETFs (227.49 Crs)
Others (0.15 Crs)
Broader Indices ETFs (79.76 Crs)
Sector Indices ETFs (4.01 Crs)
Broader Indices ETFs: The total traded volume for the month of July 2012 of broader Indices ETFs was Rs. 79.76
crore. Goldman Sachs Nifty ETF, IIFL Nifty ETF and Goldman Sachs Nifty Junior ETF are the top 3 ETFs from the
category accounting for volumes of Rs. 9 crore, Rs. 1 crore and Rs. 0.67 crore respectively.
Sector Indices ETFs: Goldman Sachs Banking Index ETF is the ETF from the category that witnessed turnover of Rs.
3 crore during the month.
Gold ETFs: Among 14 Gold ETFs the top 3 gold ETF contributed 81% of the total trading volumes within the
category during the month. They are Goldman Sachs Gold ETF, Kotak Gold ETF and SBI Gold ETF. They accounted
for volumes of Rs. 229 crore, Rs. 30 crore and Rs. 27 crore respectively.
Liquid ETFs: Goldman Sachs Liquid ETF, the only ETF from the category witnessed trading Rs. 227 crore during last
month.
August 2012 Retail Research
8. 0
20
40
60
80
100
0
100
200
300
400
500
J ul-09 J ul-09
Aug-09
Sep-09
August 2012
N ov -09 N ov -09
D ec -09
M ar-10 F eb-10
M ar-10
M ay -10
ETFs Review
J ul-10 J un-10
Aug-10
Sep-10
N ov -10 O c t-10
D ec -10
J an-11
M ar-11 M ar-11
Apr-11
J ul-11 J un-11
J ul-11
Aug-11
N ov -11 O c t-11
D ec -11
J an-12
M ar-12
Daily turnover (Rs Crs) in Sector Indices ETFs:
M ar-12
Apr-12
Daily turnover (Rs Crs) in the Gold ETF category:
M ay -12
J ul-12 J ul-12
0
10
20
30
40
50
60
70
0
20
40
60
80
100
J ul-09 J ul-09
Retail Research
Sep-09 Sep-09
D ec -09 D ec -09
M ar-10 Mar-10
J un-10 J un-10
Sep-10 Sep-10
D ec -10 D ec -10
M ar-11 Mar-11
J un-11 J un-11
Daily turnover (Rs Crs) in the Liquid ETF:
Sep-11 Sep-11
D ec -11 D ec -11
M ar-12 Mar-12
Daily turnover (Rs Crs) in the Broader Indices ETFs:
J un-12 J un-12
contd…
8
9. 9
ETFs Review contd…
Discount (+) / Premium (-) of NAV to the Spot Price over the quarter:
August 2012 Retail Research
10. 10
ETFs Review contd…
Classification of ETF category: The overall ETFs category is mainly classified as ‘Gold ETFs’ and ‘Other ETFs’. The
‘Other ETFs’ is further sub-classified as Broader Equity Indices ETFs, Sector Equity Indices ETFs, Liquid ETFs and
Thematic Equity Indices ETFs. Broader Equity Indices ETFs includes Sensex ETFs, Nifty ETFs, Capitalization ETFs
and International ETFs. Sector Equity Indices ETFs includes Banking ETFs and PSU Banking ETFs. Thematic Equity
Indices ETFs contains Infra ETFs and Shariah ETFs.
Tracking Error: The primary objective of ETFs is to track closely and replicate the performance of the underlying
index. Tracking error helps out the investors to measure how closely the ETF tracks the underling index. For
investors’ point of view, the lower the tracking error, the better is the ETF.
V. Performance (as on July 31, 2012):
Relative performance of ETFs on various time frames:
Note: Trailing Returns up to 1 year are absolute and over 1 year are CAGR. Schemes chosen based on the larger traded volume in the respective categories.
August 2012 Retail Research
11. 11
ETFs Review contd…
a. Gold ETFs:
Gold ETFs category posted an average return of 2.15% in absolute term during the month of July 2012. (Gold Fund
of Funds are not included in this review). Gold in international markets ended slightly positive at the end of July
month, with prices managing to sustain above the psychological levels of US$1,600/ounce. The upside in prices
has been aided by the renewed safe haven appetite for gold amid poor economic landscape.
Slow US GDP growth, slowdown in consumer spending and unexciting employment numbers led investors to look at
bullion. Additionally, mixed remarks from Ben Bernanke and slow growth in China made investors wary of global
economic conditions.
The weakness in the Indian rupee against the U.S. dollar aided gold to maintain its sheen in local market. The
charts below depict the fact that the depreciation in rupee value pushed gold prices locally above Rs 30,000 per
10g, notwithstanding the prices of the gold moderated in the global markets. The former shows the correlation
between USD/INR and gold price in rupee term.
Correlation between USD/INR and Gold India:
60
USD/INR (LHS) Gold India (RHS) 29000
55
24000
50
19000
45
40 14000
Oct-09
Dec-09
Feb-10
Jun-10
Oct-10
Dec-10
Feb-11
Jun-11
Oct-11
Dec-11
Feb-12
Jun-12
Aug-09
Apr-10
Aug-10
Apr-11
Aug-11
Apr-12
Aug-12
August 2012 Retail Research
12. 12
ETFs Review contd…
Interactive Gold price chart:
From the above chart it is clear that the international and domestic prices of gold were in tandem till about Sept
2011, post which there is a divergence due to a sharp depreciation in Rupee value vis-à-vis the USD.
Prices of the gold may continue remain range-bound in the near term and would look for strong monetary push to
break out from this range towards the end of this year. The progress of monsoon would have a bearing on Indian
Gold demand as it could set the tone for demand during the next festive season. Gold prices in rupee terms have
seen appreciation this year on account of falling rupee. There could be the possibility of fall in the prices of the
gold once the rupee starts to stabilize or appreciate.
August 2012 Retail Research
13. 13
ETFs Review contd…
b. Broader Equity Indices ETFs:
The Broader Equity Indices ETFs registered negative return of 0.48% for the month ended 31st July 2012. The
Indian equity markets ended the month of July on a negative note. The BSE Sensex & Nifty ended the month with
losses of 1.4% & 0.9% respectively. CNX Midcap Index posted -2.04%. The markets started off the month on a
positive note as foreign funds remained buyers of Indian stocks. Further, expectations of measures from the
Government for revival of the slowing economy aided gains on the domestic bourses. However, the markets
witnessed correction as investors reduced bets on future rate cuts from the RBI after hawkish comments from RBI
governor D Subbarao on inflation. Further, the debt problems in Spain and Greece also spoiled the sentiments on
domestic bourses. The world markets ended the month of July 2012 on a mixed note. China continued to
underperform, being reported as a top loser (down 5.5%) for second straight month. Singapore, Germany &
Indonesia were the top three gainers, which rose 5.5%, 5.5% & 4.7% respectively in the month. Brazil reported
decent gains of 3.2%, while US & Hong Kong ended the month marginally higher by 1% (Dow Jones) & 1.8%
respectively.
Movement of broader Equity Indices over one year period:
120 CNX Midcap Sensex NIFTY
115
110
105
100
95
90
85
80
75
70
Oct-11
Nov-11
Dec-11
Jan-12
Feb-12
Mar-12
May-12
Jun-12
Jul-12
Sep-11
Aug-11
Apr-12
Aug-12
August 2012 Retail Research
14. 14
ETFs Review contd…
c. Sector Equity Indices ETFs:
The sector Equity Indices ETFs, including Banking and PSU Banking ETFs, registered returns of +0.70% and -9.2%
respectively during the month of July 2012. The respective benchmarks CNX Bank and CNX PSU Banks registered
+0.42% and -9.25% respectively.
In its policy review held on July 31, the RBI left interest rates unchanged citing inflationary pressures, but cut the
statutory liquidity ratio by a percentage point to 23% to increase the flow of credit to industry, a move that could
put pressure on government to cut fiscal deficit since borrowing costs will rise. Private sector banks will benefit
from the cut in the statutory liquidity ratio.
The CNX Bank Index has outperformed the Nifty Index by 17% YTD, on the expectations of steady interest rate
cuts by the RBI and pickup in the overall economic growth. Indian banks are likely trade sideways in the short-
term on the back of multiple headwinds such as investment slowdown, Government’s high fiscal and current
account deficit, deteriorating INR against the USD, higher inflation and risk to Asset quality.
Movement of banking Equity Indices over one year period:
110 CNX PSU Banks S&P CNX Bank
105
100
95
90
85
80
75
70
Oct-11
Nov-11
Dec-11
Jan-12
Feb-12
Mar-12
May-12
Jun-12
Jul-12
Sep-11
Aug-11
Apr-12
Aug-12
August 2012 Retail Research
15. 15
ETFs Review contd…
d. Liquid ETF:
GS Liquid BeES, the only Debt ETF in the Indian mutual fund industry, tracks Crisil Liquid Fund Index as
benchmark. The investment objective of GS Liquid BeES is to enhance returns and minimize price risk by investing
in a basket of call money, short-term government securities and money market instruments of short maturities
while maintaining safety and liquidity.
The scheme registered 3.71% of absolute returns and 7.77% of CAGR returns for the last six month and one year
periods respectively. The scheme underperformed other liquid schemes in terms of performance due to its lower
maturity profile. The latest portfolio of the scheme showed that around 97% of net assets kept in call and CBLO
instruments. The scheme has maintained as average maturity as 4.85 days while the category of liquid funds has
maturity of 59 days.
Performance of GS Liquid BeES on various periods:
Given the current scenario of improving liquidity condition in the system coupled with the RBI’s stance of cutting
1% in SLR, interest rates at the short end could fall by 50 to 70 bps. Schemes investing in debt securities with the
maturity between 1 year to 3 years are likely to outperform short and long duration funds as they could benefit
out of falling interest rates in the 0-1000 days bracket.
August 2012 Retail Research
16. 16
ETFs Review contd…
.
Analyst: Dhuraivel Gunasekaran. (Data sources: SEBI, AMFI, BSE, NSE, AMC Sites, NAVIndia and Ace MF)
HDFC Securities Limited, I Think Techno Campus, Bulding –B, ”Alpha”, Office Floor 8, Near Kanjurmarg Station,
Opp. Crompton Greaves, Kanjurmarg (East), Mumbai 400 042 Phone (022) 30753400 Fax: (022) 30753435
Disclaimer: Mutual Fund investments are subject to risk. Past performance is no guarantee for future performance. This document has been
prepared by HDFC Securities Limited and is meant for sole use by the recipient and not for circulation. This document is not to be reported or
copied or made available to others. It should not be considered to be taken as an offer to sell or a solicitation to buy any security. The
information contained herein is from sources believed reliable. We do not represent that it is accurate or complete and it should not be relied
upon as such. We may have from time to time positions or options on, and buy and sell securities referred to herein. We may from time to time
solicit from, or perform investment banking, or other services for, any company mentioned in this document. This report is intended for non-
Institutional Clients.
August 2012 Retail Research