SlideShare uma empresa Scribd logo
1 de 39
Baixar para ler offline
Thunder Road
report

The New New Great Game
Geography, Energy, the Dollar and Gold

Tweaking Mackinder’s “Heartland Theory”
Oil & Gas: forgotten sector, strategic (and absolute?) value
Janet Yellen and Bang-Bang Control

Strategy
December 2013
The New New Great Game
Geography, Energy, the Dollar and Gold


Page

Thought for the report		

The footsteps of giants 					

4

The New New Great Game	

Mackinder’s “Heartland Theory”				

5


Tweaking the Heartland Theory				

9


Geographic						

9


Monetary 						

11


Three Other Factors in the NNGG			

11


Current Developments in the NNGG			

13


Oil & Gas stocks					

16


The Dollar and Gold					

18

A Fed-centric Market - who is John Galt? 			

27

The Yellen-effect 						

34

Janet Yellen and Bang-Bang 	
Control				
					

Research: Paul Mylchreest		
+44 7190 7242	
pmylchreest@monumentsecurities.com
This is a marketing communication. It has not been prepared under the Independent Investment research regulatory
requirements and accordingly there is no prohibition on dealing ahead of the dissemination of this research material.
Front cover source: Color Revolutions and Geopolitics
The New New Great Game
Geography, Energy, the Dollar and Gold
Sir Halford Mackinder’s 1904 speach in which he outlined his “Heartland Theory” was a founding moment
for geo-politics. He argued that control of the Eurasian landmass (Europe, Asia and the Middle East), which
contained the bulk of the world’s population and natural resources, was the major geo-political prize.
As time passed, energy (first crude oil then natural gas), became increasingly integral to this concept and its
strategic significance cannot be overstated.
Remarkably, Mackinder’s theory has remained equally valid, if not more so, in the modern era - although
key “pivot areas” for exercising control have evolved. In addition to Central Asia and Trans-Caucasus in
Mackinder’s day, the oil producing nations of the Middle East took on increasing importance in the “New Great
Game”.
The geo-political confrontation between the US on one hand and China (in increasingly close cooperation
with Russia) on the other, is evolving rapidly. We see a “New New Great Game” (NNGG) emerging and have
“tweaked” the Heartland Theory to include.
•	 An additional geographic “pivot”, the South and East China Seas, due to their importance in terms of world
trade, oil and gas reserves and numerous territorial claims.
•	 A monetary “pivot”, the dollar-based system of world trade and its reserve status. China is taking the lead
role in pushing ahead with its strategy of dismantling the dollar’s supremacy.
Geo-political tension in each of the pivot areas is escalating. For example Central Asia and Trans-Caucasus
(Ukraine), Middle East (Iran) and South and East China Seas (Senkaku Islands). The rising powers, China
and Russia, are adopting more aggressive geo-political tactics towards US/EU/NATO/Japanese interests. The
more “dovish” US policy towards Iran, following the recent nuclear deal, is threatening to destabilise the
decades-long status quo in diplomatic relations with Israel and Saudi Arabia.
Just about every aspect of the escalating geo-political tension has an energy element, either directly or
indirectly. Viewed from a “Mackinderian” perspective, the strategic value of the energy sector is immense. It
begs the question whether, after five years of underperformance, the equity market is under-pricing energy
assets, including those deeply out-of-favour integrated oil and gas stocks? Probably, in our view.
We believe that the significance of the monetary pivot in the NNGG is under-estimated as China accelerates
preparations to undermine the dollar’s role in world trade. The other aspect of China’s strategy is its
diversification into “hard assets” and, as far as we can tell, China is attempting to “corner” the market for
physical gold. Its strategic significance is lost on most Western investors. We present some insights into
today’s gold market which might shock Western investors - similarities with the run-up to the major lows in
the gold price more than a decade ago - and China’s understanding of modern gold market mechanics.
The threats to the existing US-centric order are substantial and the geo-political sands are shifting. The
US will respond and has the largest economy and military (with vast ocean-going naval advantage), most
powerful investment banks and deepest financial markets and significant (albeit declining) political/diplomatic
influence. In terms of boxing metaphors, we wonder whether the Ali versus Foreman fight in Kinshasa in 1974
(knockout in the eighth) or the Leonard versus Hagler fight at Caesar’s Palace in 1987 (points victory where
the argument as to who actually won continues) will be the parallel.

December 2013

3
Thought for the report: the footsteps of giants
From an anonymous source prior to the major lows in the gold price more than a decade ago.
“Someone once said, ‘no one wants gold, that’s why the US$ price keeps falling.’ Many thinking
ones laugh at such foolish chatter. They know that the price of gold is dropping precisely because
‘too many people are buying it’! Think now, if you are a person of ‘great worth’ is it not better for
you to acquire gold over years, at better prices? If you are one of ‘small worth’, can you not follow
in the footsteps of giants? The real money is selling ALL FORMS of paper gold and buying physical!
Why? Because any form of paper gold is losing value much, much faster than metal. Some paper
will disappear all together in a fire of epic proportions! The massive trading continues at LBMA,
but something is now missing...We have reached production costs...The great mistake by the BIS
was in underestimating the Asians. Some big traders said they would buy it all below $365+/- and
they did. That’s what forced LBMA to go on a spree of paper selling! Now, it’s a mess.”
Interesting?
The gold price is approaching production cost again.
We have the physical versus paper demarcation again (most commentators are clueless on this - the paper
market is still determining the screen price, but it will probably die once and for all this time around – the
question is at what level?).
The Asians are being underestimated again when the price is declining (although not by the BIS - China is
buying physical gold in unprecedented volumes – at least 70-75% of world mining production this year).

Gold: China's cumulative net imports through Hong Kong (tonnes)
2100
1900
1700

1300
1100
900
700
500
300
100

But accelerating developments in the monetary sphere is only one element of...

December 2013

4

2013

2012

2011

2010

2009

2008

2007

-100

Source: Hong Kong Census & Statistics Dept.

1500
The “New New Great Game”
Mackinder’s “Heartland Theory”
The traditional “Great Game” obviously dates back to the geo-political rivalry between Great Britain and
Russia for supremacy in the central Asian region during the nineteenth and early part of the last century.
In his famous speech, “The Geographical Pivot of History”, to the Royal Geographical Society in 1904, Sir
Halford Mackinder outlined his “Heartland Theory. ” According to Wikipedia.
“This is often considered a, if not the, founding moment of geo-politics...”
Briefly, this posited that the major geo-political prize is Eurasia (the “World Island”), i.e. the European, Asian
and Middle Eastern land mass, which contained the bulk of the world’s population and its natural resources.
Mackinder argued that control of the “pivot area“ of central Asia was the key to controlling Eurasia.
This is taken from his paper published in the April 1904 edition of the “The Geographical Journal.”

Source: The Geographical Journal

He also emphasised the important difference between sea power and land power. From Zurich-based ISN’s
2009 “Geopolitics and US Middle Eastern Policy: Mackinder and Brzezinski.”
“Mackinder’s theory was a counter-argument to notions that maritime supremacy was sufficient
for a power such as Great Britain to safeguard its hegemony. He claimed that, with the emergence
of new transportation routes [e.g. Trans-Siberian railway] and technology, a power that could
control the centre (and the abundant resources) of the Eurasian landmass...would ultimately be
able to attack the colonies of a sea power everywhere on the continent. “

December 2013

5
The Trans-Siberian Railway.

Source: NPR

In the wake of World War One, Mackinder argued the case for preventing a convergence of interests between
Russia and new “pivot” states of Eastern Europe (Austria, Hungary, Czechoslovakia and Poland). This led to
his famous dictum.
“Who rules East Europe commands the Heartland;
Who rules the Heartland commands the World Island;
Who rules the World Island commands the World.”
It’s important to emphasise that the pivot area does evolve/fluctuate with changes in geo-political reality.
Indeed, Mackinder included the Baltic states in one of his revisions.
As the world industrialised and became increasingly dependent on crude oil (and later, natural gas), energy
resources became ever more integral to the Great Game. With such a large proportion of the world’s oil and
gas reserves found on the Eurasian land mass, this was easily accommodated within Mackinder’s theory.
The period just before World War One, with the British Navy’s switch from coal to oil and the adoption of
the automobile, set the stage for this. Indeed, in 1913, the British government acquired a 51% controlling
interest in the Anglo-Persian Oil Company, the forerunner of BP.
Remarkably, the validity of Mackinder’s theory has stood the test of time, even though most people are
unfamiliar with it. The following quote is from the Reagan Administration’s “National Security Strategy of the
United States” published in January 1988.
“The first historical dimension of our strategy is relatively simple, clear-cut, and immensely
sensible. It is the conviction that the United States’ most basic national security interests would
be endangered if a hostile state or group of states were to dominate the Eurasian land mass – that
area of the globe often referred to as the world’s heartland.”
Right now, it’s obvious that US national security interests are threatened by a combination of China and
Russia.

December 2013

6
This was the influential globalist (and former National Security Advisor), Zbigniew Brzezinski, writing in his
famous 1997 book, “The Grand Chessboard.”
“Ever since the continents started interacting politically some 500 years ago, Eurasia has been the
centre of world power… For America, the chief geopolitical prize is Eurasia – and America’s global
primacy is directly dependent on how long and how effectively its preponderance on the Eurasian
continent is sustained.”
In the “New Great Game”, (NGG) of the modern era, the major rivalry is between US/NATO on one side and
China, Russia, other members of the Shanghai Cooperation Organisation and the likes of Iran, on the other.

Source: Stratfor

The “pivot states” in the NGG are.
•	 The key nations in Central Asia and the Trans-Caucasus: especially those with substantial energy
resources and/or pipelines (e.g. Azerbaijan, Ukraine, Turkmenistan, Uzbekistan etc). Here is a chart
showing the major gas pipelines.

Source: IEA

December 2013

7
And the major oil pipelines:

Source: IEA

•	 The major OPEC nations of the Middle East: here we borrow part of US geo-strategist, Nicholas
Spykman’s, “Rimland” theory. Spykman, the “godfather of containment” was both a disciple and critic
of Mackinder. He believed that the “Rimland”, European coast, Arabian-Middle Eastern desert and Asiatic
Monsoon region was more important for controlling the Heartland.

Source: Britannica.com

This was Brzezinksi on the Central Asian Republics, or “Eurasian Balkans” as he terms them in his book. This
was in 1997, when China’s economic and military might was still a distant prospect.
“They are of importance from the standpoint of security and historical ambitions to at least three
of their most important and more powerful neighbours, namely Russia, Turkey and Iran, with
China also signalling an increasing political interest in the region. But the Eurasian Balkans are
infinitely more important as a potential economic prize; an enormous concentration of natural gas
and oil reserves is located in the region, in addition to important minerals including gold.”
December 2013

8
It’s a reminder of the strategic importance of energy and gold and puts the US-supported “Color revolutions”
into sharper focus - Ukraine (Orange, 2004), Georgia (Rose, 2003) and Kyrgyzstan (Tulip, 2005).

Tweaking the Heartland Theory
We agree with the modern interpretation of the NGG, but we see TWO additional elements which
make the current situation a “New New Great Game.”
1. Geographic
The South China Sea and the East China Sea (home of the Senkaku Islands) have growing strategic significance
due to their importance in terms of:
•	 World trade – the South China Sea, for example, is the world’s second busiest sea lane.
•	 Significant oil and gas reserves; and
•	 Numerous territorial claims over islands, waters and airspace.

Source: Wall Street Journal

In the context of Mackinder’s Heartland Theory, this is becoming a second Eurasian “pivot area” in our opinion,
even if it’s just off the coast. It is the logical result of the rise of Chinese and pan-Asian economic power.
An interesting anecdote in this regard concerned comments from the retiring commander of the US Pacific
Fleet, Admiral Patrick Walsh, in January 2012. Walsh, a proponent of Mackinder’s theory, recommended that
the US regional focus should be the South China Sea.
“In the Pacific Century, sea power resumes its traditional role in the sea-lines of communication...
You can identify where (South China Sea) the critical node is...It forces an assessment of whether
we are prepared for where this economic juggernaut (China) is going.”
Press reports noted that Walsh had discussed his application of Mackinder’s theory with Singapore’s Lee Kuan
Yew (the region’s “elder statesman”) and had written a classified paper for the Pentagon on his strategic
concept.

December 2013

9
It’s also important to emphasise the significance of the South China Sea in terms of trade in crude oil and
natural gas. From the US Energy Information Administration’s (EIA) website.
“Almost a third of global crude oil and over half of global LNG trade passes through the South
China Sea, making it one of the most important trade routes in the world...Approximately 14
million barrels of crude oil pass through the South China Sea and Gulf of Thailand per day, or
almost a third of global oil movement, according to data from Lloyd’s List Intelligence tankertracking service and GTIS Global Trade Atlas. Over 90 percent of the total flow comes from the
Strait of Malacca, while the rest comes from intra-Southeast Asia regional trade...”
This EIA chart shows the flows from 2011.

Source: EIA

The EIA again.
“EIA estimates that around 6 trillion cubic feet (Tcf) of liquefied natural gas (LNG), or over half
of global LNG trade, passed through the South China Sea in 2011, using data from PFC Energy
and Cedigaz...Following the Fukushima crisis, Japan increased its LNG imports. In the first half of
2012, the South China Sea area accounted for about 58 percent of global LNG trade, according to
data from PFC Energy.”

Source: EIA

December 2013

10
2. Monetary
In “Mackinderian” sense, we believe that the dollar-based currency system has become a “pivot area” on an
economic plane.
China is taking the lead role in dismantling the dollar’s supremacy in terms of world trade and reserve
currency status. The mirror image of this strategy, the internationalisation of the Yuan, is evolving in parallel.
Given the “petro-“ foundation of the US dollar’s post-Bretton Woods dominance, energy deals transacted in
local currencies and the pricing of exchange traded oil and gas contracts in currencies other than US dollars
have added significance.
In the monetary sphere, the other aspect of this monetary “pivot” is China’s diversification into “hard” assets.
At the cutting edge of this process is the aggressive accumulation of gold reserves at both the state and
private (encouraged by the state) levels.
The monetary element of the NNGG is being significantly under-estimated.
•	 The last time the baton was passed in terms of the world’s reserve currency, it was done in an ostensibly
benign fashion – from one ally to another – and in the wake of devastating global conflict. It wasn’t an
issue in Mackinder’s day, nor was it an issue during the Cold War; and
•	 Another reason might be that the majority of people tend to remain wedded to the belief in the status quo,
even as the ground shifts beneath their feet.

Three other factors in the NNGG
We would be remiss if we didn’t mention three other factors which are caught up in the mix of this NNGG.
The first is diplomatic and the threat to US/NATO from the deepening relationship between China and Russia.
Shanghai Cooperation Organisaton aside, the Chinese state-owned news agency Xinhua reported on 22
October 2013 that Sino-Russian relations stand at an “unprecedented height.” This was during a two-day
official visit to China by President Medvedev.
Remember the Reagan era’s security document warning about the danger if
“a hostile state or group of states were to dominate the Eurasian land mass.”
In this regard, the prospect of rapidly growing trade links, especially with regard to energy, is very significant.
In October 2013, Rosneft signed a deal to supply China with an additional 200,000 bpd of crude (worth
US$85bn over 10 years). This will take Rosneft’s planned trade with China to about 900,000 bpd. Gazprom
is in the final stages of negotiating the long-awaited contract to supply 38 bcm per year of gas to China by
pipeline. The two countries have targeted US$100bn of bilateral trade in 2015, doubling to US$200bn by
2020.
Secondly, the extent of NSA surveillance of foreign nations and their leaders has the potential to open up
another front, the internet, albeit for “soft” conflict. It is already having an impact in the BRICS nations visa-vis the US. For example, we are seeing Brazil’s push for a less US-centric internet and the recent decline
in Cisco’s China sales.

December 2013

11
Source: Simon Hunt

The third factor is religious - the growing friction between the Sunni and Shia branches of Islam in the Middle
East and North Africa.

Source: US State Dept.

Despite a complacent consensus, it strikes us that tensions in this “New New Great Game” (NNGG) – both
geographic and monetary - are escalating in a potentially alarming fashion.
This has potential significance for assets which are either central to, or might get caught up, in this theme.
Examples include.
•	 Oil and natural gas;
•	 US Treasuries;
•	 Gold;
•	 Defence stocks; and
•	 US and Asian networking stocks.

December 2013

12
Current developments in the NNGG
Looking at the current situation, let’s begin with the China Seas. In a July 2010 speech, Hilary Clinton
highlighted US interest in the freedom of navigation of the South China Sea and the peaceful settlement of
territorial disputes. This was seen as the start of US re-engagement in the region and is understood to have
angered the Chinese. It was followed by the well-publicised “strategic pivot”, or rebalancing, of foreign policy
and military strength towards the Asia-Pacific region by the Obama Administration. There’s that “pivot” word
again.
“We have long been writing about the leadership’s increasingly assertive foreign policy. China
considers the countries bordering on the China Seas as its sphere of influence, not that of the USA.
We have heard from people involved in inter-government discussions that China is making it very
clear that sides should be taken: choose either China or the USA.”


Simon Hunt (Simon Hunt Strategic Services), the best China analyst in our view

Coming right up-to-date, immediately after China had published the coordinates of its new East China Sea
Air Defence Identification Zone on 23 November 2012, US bombers (flying over the Senkaku Islands) and
Japanese airliners refused to properly identify themselves in accordance with Chinese demands.
US Defense Secretary, Chuck Hagel, not only accused the Chinese of destabilising the region, but reiterated
that the mutual defence treaty with Japan applied to the Senkaku Islands.
This prompted Ambrose Evans-Pritchard of the Daily Telegraph to comment:
“Asia is on the cusp of a full-blown arms race. The escalating clash between China and almost all
of its neighbours in the Pacific has reached a threshold. All other economic issues at this point are
becoming secondary. Beijing’s implicit threat to shoot down any aircraft that fails to adhere to its
new air control zone in the East China Sea is a watershed moment for the world.”
In the last few days, South Korea has extended its air defence identification zone, including the potential
inflammatory element of overlapping it with Chinese and Japanese zones.
Back in the more traditional territory of the Great Game, the Ukraine’s apparent shift towards Russia by
putting the EU deal on “ice” appears to be another geopolitical coup for Vladamir Putin. Ukraine’s President,
Viktor Yanukovych, buckled under economic “strong arming”, but might reconsider after US threats and riots.
Then there are the sensitive issues of Syria and Iran, which have seemingly damaged US relations with its
two principal and (very) longstanding allies in the region, Israel and Saudi Arabia.
A rift in US-Saudi relations opened up when the US backed down from a military strike on Syria. This was a
CBS article from 23 October 2013.
“Saudi Arabia is reportedly threatening to scale back its decades-old partnership with Washington
over the Obama Administration’s perceived weakness in dealing with Syrian leader Bashar alAssad, and its recent furtive overtures with the Saudis’ arch-enemy, Iran.”
Bashar al-Assad belongs to the Alawite Shia minority, with close links to Iran and Hezbollah, while Saudi
Arabia backed the mainly Sunni rebels. The Saudis are increasingly fearful of the “Shia crescent” consisting
of Iran, Iraq, Syria and Hezbollah.

December 2013

13
Source: Center for Strategic Studies

This was followed by Saudi Arabia’s rejection of a (prestigious) seat on the UN Security Council on 12
November 2013, widely viewed as expressing its frustration with the US/UN over Syria.
With regard to Iran, we were VERY surprised by the extent of US concessions in the Geneva interim agreement
regarding the nuclear programme. It’s hard to describe US policy towards Iran since George W. Bush’s “Axis
of Evil” speech in 2002 as anything less than hawkish.
“This is like Wile E. Coyote suddenly signing a peace deal with the Road Runner.”
							

Marin Katusa, Casey Research

There has been criticism of the deal from both sides of the political divide in Washington and Congress had
been preparing legislation for even stricter economic sanctions.
Why the apparent climb down by the US? And what happened to the normally “all-powerful” Israel lobby?
Netanyahu memorably described the deal as a “historic mistake” and pledged to stop Iran developing nuclear
weapons.
“Today the world has become a much more dangerous place because the most dangerous regime
in the world has taken a significant step toward attaining the most dangerous weapon in the
world… Israel is not bound by this agreement. The Iranian regime is committed to the destruction
of Israel and Israel has the right and the obligation to defend itself, by itself, against any threat.
As prime minister of Israel, I would like to make it clear: Israel will not allow Iran to develop a
military nuclear capability.”
There had to be something even more important in this deal for the US that was worth risking damage to its
relationships with Israel...and Saudi Arabia. The only conclusions we can reach are that either Israel or Saudi
Arabia have a freer hand to deal with Iran themselves, or the US had its arm twisted. What could be even
more important to US interests? The dollar comes to mind as we speculate below.

December 2013

14
Following the Geneva agreement, a senior advisor to the Saudi royal family went well beyond the cautious
official statement, accusing western nations of deceit in reaching the deal with Iran. The Daily Telegraph
reported on 25 November 2013.
“Nawaf Obaid told a think tank meeting in London that Saudi Arabia was determined to pursue its
own foreign and policy goals. Having in the past been reactive to events, the leading Sunni Muslim
nation was determined to be pro-active in future. Mr Obaid said that while Saudi Arabia knew that
the US was talking directly to Iran through a channel in the Gulf state of Oman, Washington had
not directly briefed its ally. ‘We were lied to, things were hidden from us,’ he said. ‘The problem
is not with the deal struck in Geneva but how it was done.”
The same newspaper reported the view of my friend the oil analyst (and former editor of Petroleum Review),
Chris Skrebowski.
“the great unknown is how Saudi Arabia will react to a move deemed treachery in Riyadh, already
exposed in a WikiLeaks diplomatic cable exhorting the US to ‘cut off the head of the snake’ in
Iran. Tehran’s diplomatic triumph may embolden Saudi Arabia’s aggrieved Shia minority to press
demands, perhaps even threatening the main Saudi oilfields in the Eastern province where they
dominate. ‘The Saudis are very angry. The great question is whether they can live with this deal,
or whether it is intolerable,’ he said. Mr Skrebowski said the Middle East is a tinder box, in the
grip of a Sunni-Shia civil war comparable in ideological ferocity to the clash between Catholics
and Protestants in early 17th Century Europe. Saudi Arabia has already shown how far it will go
to protect its interests, helping to overthrow Egypt’s Musilm Brotherhood.”
New convergences of national interests are forming.
“For the first time, Saudi Arabian interests and Israel are almost parallel. It’s incredible.”
								

Saudi Arabian Prince Alwaleed bin Talal

Prince Alwaleed also implied that a military option to neutralise Iran’s nuclear programme might be preferable
to the Geneva deal. Nor did he rule out Saudi Arabia adopting nuclear weapons, highlighting its close
relationship with Pakistan.
Meanwhile, Iran is moving quickly to strengthen relationships with its neighbours and Eurasian superpowers.
Here are several examples of Iranian diplomatic efforts since the Geneva agreement.
•	 Iran’s Majlis Speaker, Ali Larijani, met with Chinese President Xi Jinping in Beijing on 30 October 2013.
•	 Iraq’s Prime Minister made a 3-day visit to Iran on 4 December 2013. This followed visits by the Syrian
Prime Minister, Wael al-Halqi, the week before. Such meetings could heighten the fears of those who worry
about a “Shia arc.”
•	 Iran’s Foreign Minister, Mohammed-Javad Zarif, visited leaders of several members of the Gulf Cooperation
Council, including Oman, Kuwait, Qatar and Dubai.
•	 Russian Foreign Minister, Sergei Lavrov, visited Iran on 11 December 2013.
As we were writing this report, we came across an article “The Great Game accelerates...” by

Alasdair

Macleod (Finance and Economics website) from 9 December 2013. He had an interesting slant on what’s
taking place with regard to several of the same issues.

December 2013

15
“If we stand back to get an overall impression of how this jigsaw fits together, the guiding hand
of China can be imagined throughout...China’s interest in absorbing the Middle East into her
sphere of influence is obvious, given her current and future energy requirements; but she will
also want to tap into the enormous wealth in the region. Her link into it is through Iran, an SCO
Observer State, to which she provided covert support during the Ahmadinejad years. One can
only speculate about the degree of Chinese influence behind Iranian political developments, with
Iran now aligning herself with China’s view that trade matters more than belligerence with her
perceived enemies.”
So where do we stand? A few observations.
•	 Geo-political risk has risen substantially in ALL of the “pivot areas” of the NNGG, Middle East,
Central Asia/Transcaucasus and the South/East China Seas.
•	 The rising powers, China and Russia, are adopting more aggressive geo-political tactics towards,
US/EU/NATO/Japanese interests and Iran has greater political and economic flexibility.
Concurrently,

Japan is rediscovering its long-forgotten nationalistic and militaristic roots.

•	 In the Middle East, whatever is driving US policy is destabilising the status quo in diplomatic
relations which has been in place for decades. We could be in the early stages of a tectonic shift.
•	 Each development discussed is having an ADDITIVE EFFECT ON THE GEO-POLITICAL
CONFRONTATION BETWEEN THE US ON ONE SIDE AND CHINA/RUSSIA ON THE OTHER.
•	 Furthermore, just about every aspect of what’s happening has an ENERGY ASPECT TO IT,
EITHER DIRECTLY OR INDIRECTLY.

Oil & Gas stocks
In light of all this, it begs the question: is the equity market under-pricing energy assets, including those big,
ugly integrated oil and gas companies? Probably, in our view.
The consensus for long-term oil prices used in analysts’ forecasts is US$90-95/bbl, which we think will
ultimately be on the low side.
Short term, crude oil looks like it’s approaching a significant move. The question is which way?
Crude oil: Brent (US$/bbl)
130

125

120

Source: Bloomberg, Monument Securities.

115

110

105

100

95

90

85

16

Dec-13

Oct-13

Nov-13

Sep-13

Jul-13

Aug-13

Jun-13

Apr-13

May-13

Mar-13

Jan-13

Feb-13

Dec-12

Oct-12

Nov-12

Sep-12

Jul-13

Aug-12

Jun-13

Apr-13

May-13

Mar-13

Jan-13

Feb-13

Dec-12

Oct-12

Nov-12

Sep-12

Jul-13

Aug-12

Jun-13

Apr-13

May-13

Mar-13

Jan-13

December 2013

Feb-13

80
It’s difficult to say, although our suspicion is upwards. On the announcement of the Iran nuclear deal last
month, the initial US$3/bbl decline in the price was reversed almost immediately. Downside is probably
limited by high marginal costs in some unconventional sources and, looking at the trend in Saudi production,
some flexibility for cutbacks if they were necessary.
A cursory look at the price relatives of the US and UK integrated oils shows what dire investments they’ve
been in the last five years.
US and UK Big Cap. Oil & Gas stocks price relative
0.50

3.60

0.48

3.40

0.46

3.00

0.42

2.80

0.40
0.38

2.60

0.36
2.40
0.34
2.20

0.32

2.00

Jan-09
Feb-09
Mar09
Apr-09
May-09
Jun-09
Jul-09
Sep-09
Oct-09
Nov-09
Dec-09
Jan-10
Feb-10
Apr-10
May-10
Jun10
Jul-10
Aug-10
Sep-10
Oct-10
Dec-10
Jan-11
Feb-11
Mar-11
Apr-11
May-11
Jul-11
Aug-11
Sep-11
Oct-11
Nov-11
Dec-11
Jan-12
Mar-12
Apr-12
May-12
Jun-12
Jul-12
Aug-12
Sep-12
Nov-12
Dec-12
Jan-13
Feb-13
Mar-13
Apr-13
May-13
Jul-13
Aug-13
Sep-13
Oct-13
Nov-13

0.30

S&P 500 Integrated Oil & Gas price relative

Source: Bloomberg, Monument Securities.

3.20
0.44

FTSE Oil & Gas Producers price relative

Looking at my Bloomberg page on US equities, I have 53 S&P 500 sectors and subsectors in a column on
the left hand side. Being very simplistic, Bloomberg estimates the P/E for the S&P 500 Integrated Oil & Gas
sector at 12.2x – trailing 12 months as far as I can tell. The only sector/subsector with a lower PE is Banks on
12.1x! The UK Oil & Gas Producers subsector is only 8.8x, dragged down by the truly unloved heavyweights,
Royal Dutch Shell and BP.
So a valuation case might be developing and it was interesting that Warren Buffett bought more than US$3.0bn
worth of ExxonMobil recently.
In the UK/Europe, many of the large integrated oil stocks have been a source of funding for more successful
trades this year. If this is close to running its course, it would not take much for a sharp bounce.
One company which we are keeping a close eye on is Royal Dutch Shell (RDS). When it comes to unloved
stocks, it is right up there. In light of the ConocoPhillips spin of Phillips 66, one could argue that RDS has been
two (or three or four even!) of the worst managed FTSE 100 companies in recent years.
A company in desperate need of an activist shareholder?
We were chatting to one of London’s biggest PM’s (in AUM terms) several weeks ago. Not only does he not
hold the share, but the last time RDS executives had visited his company, he hadn’t felt that it was worth
attending the meeting. Things are really bad!
But we do have an incoming CEO, Ben van Beurden, who assumes his new role on 1 January 2014. This offers
the potential for change, although van Beurden is an “RDS-lifer” from its downstream business.

December 2013

17
Unless van Beurden has been living under a rock for the last 12 months, he can’t have failed to notice the
improvement in the investors’ perception of Rio Tinto since Sam Walsh took over. Walsh had been with Rio
for 22 years when he was appointed CEO in January this year and had been a key member of the company’s
senior management during the previous regime. This didn’t stop him grasping the need for a smaller and
more efficient capital investment programme.
Van Beurden has an opportunity.
The shares have been “dead money” for three years while the equity markets have roared ahead
Royal Dutch Shell A share price (p)
2500

2400

Source: Bloomberg, Monument Securities.

2300

2200

2100

2000

1900

Dec-13

Oct-13

Nov-13

Sep-13

Jul-13

Aug-13

Jun-13

Apr-13

May-13

Mar-13

Jan-13

Feb-13

Dec-12

Oct-12

Nov-12

Sep-12

Jul-12

Aug-12

Jun-12

Apr-12

May-12

Mar-12

Jan-12

Feb-12

Dec-11

Oct-11

Nov-11

Sep-11

Jul-11

Aug-11

Jun-11

Apr-11

May-11

Mar-11

Jan-11

Feb-11

1800

Meanwhile, oil and gas exposure fits our long-term investment strategy. Besides gold and silver, we believe
that portfolios should be progressively aligned with essential goods and services as we expect that these
expenditures will account for a growing share of the “economic pie” as consumers face increasing headwinds
(including inflation in due course). In thematic terms, our preferred sectors are:
•	 Food/agriculture
•	 Energy
•	 Personal & Household care
•	 Healthcare
•	 Mobile telephony & networking; and
•	 Defence (for governments).

The Dollar and Gold
Now let’s move into the monetary arena of the “New New Great Game”. Because of the longevity of the
current post-Bretton Woods system and its blatant structural flaws ( and ”exorbitant privilege” provided to
the US to quote De Gaulle), we believe that it is becoming AS IMPORTANT as the geo-strategic element.
Most people just haven’t realized yet.
Reflecting on Washington’s sudden “dovishness” towards Iran, we had some sympathy with this view from
Casey Research’s, Marin Katusa.

December 2013

18
“The Americans also got something great from the discussions: the continuation of the petrodollar.
With a détente around the corner, America can monitor Iran’s activities and quietly make sure
that the sale of this oil will be denominated in US dollars. The fact that Iran has constantly tried
to shift away from the US dollar for petroleum trades has always been a thorn in the side of the
US government. By ‘working closer’ with Iran, America will in fact be able to better keep tabs.”
Maybe. Let’s consider recent developments in the monetary element of the NNGG, because they are coming
thick and fast now.
A good place to begin is the March 2012 meeting of the BRICS nations, which saw them sign the “Master
Agreement on Extending Credit Facility in Local Currency. ” This made it their POLICY to increase trade in
local currency.
This process is beginning to speed up.
China is driving this process and now conducts 17% of its foreign trade in Yuan compared to almost zero in
2010. It has set up 23 (at the last count) currency swap agreements with major trading partners (including
the EU) and 60% of global GDP in all, to facilitate this process.
We also had the recent news that the Yuan is now the second most-used currency in trade finance, supplanting
the Euro. According to SWIFT, the Chinese currency had a market share of 8.66% in October 2013 compared
with 6.44% for the Euro.
This share looks set to grow rapidly. The FT reported on 2 December 2013 that companies can now clear
Yuan-denominated transactions in London.
“UK-based Standard Chartered and Agricultural Bank of China have signed an agreement to start
renminbi clearing services in the UK for the first time, in a deal announced to coincide with the
visit of David Cameron, prime minister, to Beijing. London is becoming the main city outside of
Asia for trading and transacting in the Chinese currency.”
A major pillar of the dollar’s dominance in world trade is pricing oil. China surpassed the US as the world’s
largest oil importer in September this year. So, a potentially significant development was the comment from
the Chairman of the Shanghai Futures Exchange that preparatory work for a crude oil futures contract priced
in Yuan is being accelerated. This was from a Reuters report on 21 November 2013.
“China is the only country in the world that is a major crude producer, consumer and a big
importer. It has all the necessary conditions to establish a successful crude oil futures contract,’
Yang Maijun, SHFE chairman, said at an industry conference.”
And Tyler Durden at Zero Hedge.
“In doing so China is effectively lobbing the first shot across the bow of the Petrodollar system, and
more importantly, the key support of the USD in the international arena. This would be in keeping
with China’s strategy to import about 100 tons of gross gold each and every month, in addition
to however much gold it produces internally, in what many have also seen as a preparation for
a gold-backed currency, which however would require a far broader acceptance of the renminbi
in the international arena and most importantly, its intermediation in a crude pricing loop. It is
precisely the latter that China is starting to focus on.”

December 2013

19
Oil and gold again.
Given all of the above, it’s fairly obvious that China is moving ahead with its plan to dismantle the dollar’s
dominance in world trade and internationalise the Yuan. However, it would hasten this process if the Chinese
make good on recent comments from the PBOC. This was a Bloomberg report on 21 November 2013.
“It’s no longer in China’s favor to accumulate foreign-exchange reserves,’ Yi Gang, a deputy
governor at the central bank, said in a speech organized by China Economists 50 Forum at
Tsinghua University yesterday. The monetary authority will ‘basically’ end normal intervention in
the currency market and broaden the yuan’s daily trading range, Governor Zhou Xiaochuan wrote
in an article in a guidebook explaining reforms outlined last week following a Communist Party
meeting. Neither Yi nor Zhou gave a timeframe for any changes.”
This would be a MASSIVE development.
Confrontation in the monetary sphere between the US and China has been building for many years Both
sides seem to be preparing for just such a scenario. In his book “Currency Wars”, James Rickards recounts
participating in the first Pentagon-sponsored “financial war game”, at the Applied Weapons Laboratory, outside
Washington in 2009. In an interview with Max Keiser he commented.
“There was a Russia team, a China team, a United States team and then we had Europe, Switzerland,
hedge funds...I was on the China team...My object, in order to help the United States, was to
attack the United States as hard as we could in order to teach our own intelligence community
what the threats were...I actually cooked up a little plot with a friend of mine who was on the
Russia team and China and Russia combined forces and combined their gold and announced a new
gold-backed currency using UK banks and Swiss depositories. And what they said was, from now
on, if you want Chinese exports or Russian natural resources, we will no longer accept dollars, you
must pay us in this new gold-backed currency.”
It seems that China is not sitting back either. For example, this was Zheng Gang, the CEO of Keen Risk
Solution Co. and consultant member of the Chinese Competitive Intelligence Association.
“Before actual combat over land, sea and air, an enemy nation that possesses offensive capabilities
in finance can disrupt China’s economic stability, thereby striking before a physical war, subduing
us without a fight. The strategic ‘Game’ to preserve the USD’s global status is now focus of
international political and economic activity; the US makes a new kind of non-military offensive
against developing and transforming countries derived from her ability to set favorable rules, an
ability she possesses through the dollar hegemony.”
One of the ultimate anti-dollar elements of the New New Great Game is China’s accumulation of gold at both
state and private level. Whatever way you cut the analysis, it seems that China’s annual gold consumption is
running at about 2,000 tonnes, possibly more.
This is a HUGE 70-75% of estimated 2013 world mine production.
The much discussed Chinese net imports through Hong Kong amount to just over 980 tonnes this year
through October. This is an increase of 160% versus the first 10 months of 2012. The October figure of 130
tonnes was the second largest ever.

December 2013

20
China: Gold net imports through Hong Kong (tonnes)
160

140

100

80

60

40

20

0
Jan

Feb

Mar

Apr

May

Jun

2012

Jul

Aug

Sep

Oct

Nov

Dec

Source: Hong Kong Census & Statistics Dept.

120

2013

So we should see more than 1,200 tonnes in 2013 as a whole. Then we have to add in domestic mine
production, hardly any of which leaves Chinese shores. This will be about 430 tonnes in 2013. It’s no surprise,
nor coincidence, that China has ramped up gold supply dramatically.

Source: SRSrocco.

So Hong Kong imports plus domestic mine production total about 1,600 tonnes. This is just one point of entry
for gold into China and note this comment from Koos Jansen from the “In Gold We Trust” website (which has
the best analysis of Chinese gold demand).
“There is also gold going into China through other ports that is not reported. I know this from the
biggest transport company that ships gold from Switzerland to China.”
Including imports through Shanghai and other points of entry and we are probably getting close to 2000
tonnes. The other way of looking at it is from physical deliveries on the Shanghai Gold Exchange (SGE). The
diligent Mr Jansen keeps close tabs on this - and produces great charts comparing SGE deliveries with world
mining output ex-China (see below). From his conversations with the SGE, Jansen discovered an unusual
aspect of what constitutes “delivery” on this exchange – it is metal that has been withdrawn from the vault
and none of these bars are permitted to come back in. As he says.

December 2013

21
“mine and import supply in China are required to be sold over the SGE. The result is that the gold
that leaves the SGE vaults reflects total supply, and thus demand.”
Through the first 47 weeks of 2013, SGE deliveries amounted to 1,928 tonnes.

Source: Koos Jansen.

So, using this methodology, the annualised rate is slightly more than 2,000 tonnes.
How much of the roughly 2,000 tonne annualised demand is going into official reserves versus private savings
is not clear. The Chinese government last reported its official gold reserves at 1,054 tonnes in April 2009. This
took the market by surprise as the previous figure had been 600 tonnes in 2003.
When the next update comes, it should be in the multiple thousands of tonnes.
We’ve been telling people for years that the gold market is far removed from what most people like to think
– investors quietly selling LGD 400 oz. bars to each other. Besides the paper to physical ratio (estimated by
the Reserve Bank of India at 93:1), all manner of trading shenanigans, the strategic significance of gold to
central banks and governments is barely describable.
On that note, the quotes about the gold market at the beginning of this report (“Thought for the report:
the footsteps of giants”) was sourced from the USAGold website, although it originally appeared on a Kitco
forum. Thanks to the former’s Michael Kosares, the “thoughts” (during 1997-2001) from his source(s) can be
accessed although you have to “search” for the “gold trail”. Not only did many of the insights prove prophetic
in terms of the subsequent evolution of the gold market, but they raised some truly jaw-dropping questions
about the world financial system. We stumbled over them in 2006 and were mesmerised.
Re-iterating one of the messages from the quote at the beginning of this report, the screen price of gold is
being driven by various forms of paper gold including:
•	 The XAU/USD FX cross in huge size with a tiny amount of gold collateral;
•	 Unallocated LBMA gold;
•	 Lease contracts to provide collateral;
•	 COMEX futures; and

December 2013

22
•	 OTC derivatives.
Let’s consider recent developments in the gold market and compare them with more quotes from the source(s)
cited above regarding the situation as we headed into the major price lows more than a decade ago.
Look at this chart which compares the monthly gold price with China’s cumulative imports of gold through
Hong Kong.
Gold price v. China cumulative gold imports from HK
1900

2000
1800

1700

1600

1200
1000

1300
800
600

1100

400
200

900

0

Gold price (Monthly, US$/oz.)

2013

2012

2011

2010

2009

-200

2008

700

Source: Hong Kong Census & Statistics Dept.

1400
1500

China cumulative gold imports from Hong Kong (tonnes)

So China, with US$3.66 trn of foreign exchange reserves, ramps up its physical gold purchases and the gold
price collapses at exactly the same time.
Isn’t this counter-intuitive and worthy of further analysis, especially in light this quote from the source?
“People wondered how the physical gold market could be ‘cornered’ when its currency price
wasn’t rising and no shortages were showing up...the BIS set up a plan where gold would be
slowly brought down to production price. To do this required (name deleted) to take the long side
of much leased forward gold deals even as they bid for physical under a falling market.”
In 2013, Chinese gold imports have surged, the gold price has obviously crashed and holdings of physical
gold in (Western world) ETFs have fallen very sharply.
Gold: total known ETF holdings (tonnes)
2800

2400

Source: Bloomberg, Monument Securities.

2000

1600

1200

800

400

December 2013

23

2013

2012

2011

2010

2009

2008

2007

2006

2005

2004

0
Then consider this quote.
“The Western governments needed to keep the price of gold down so it could flow where they
needed it to flow. The key to free up gold was simple. The Western public will not hold an asset
that is going nowhere, at least in currency terms (if one can only see value in paper currency
terms then one cannot see value at all).”
Western investors were completely wrong-footed when the price turned last time.
And finally.
“The battle now is between the CBs [central banks] trying to keep gold in the $300s and the
‘others’ buying it up...Some people know this, that is why they aren’t trading it, they are buying
it.”
It’s also clear that the Chinese fully understand the mechanics of the gold market and the determinants of
the price.
For example, the following is a translation of an article from Zhang Jie of the China Gold Association (basically
an arm of the State Council), “Gold Leasing Is A Tool For The Global Credit Game”, published on 15 April 2013.
This will probably shock many investors in the West. With thanks to Koos Jansen for the translation.
“Gold leasing is an important innovation in the gold settlement system. Through continuous gold
leasing the gold in the market can be circulated and produce derivatives, creating more and more
paper gold. This is very significant for the United States. Gold leasing is a major tool for the
Federal Reserve and other central banks in the West to secretly control and regulate the gold
market, creating gold credit derivatives…The purpose of gold leasing is not just to receive a rent,
but it also provides the ability to short-sell gold, which allows central banks to interfere in the
currency market…If one wants to control gold, it is a necessity to have the ability to short-sell the
same. A central bank that directly suppresses gold would be suspected as a market manipulator.
However, gold leasing by the central bank can take place unnoticed…For the Fed, it is crucial
that the dollar dominates the world and so the Fed will store gold reserves from countries all
over the world to control the gold settlement system. If there were another gold settlement
system, it would compete with the dollar’s trust. Natural gold credit would be a nightmare for
the continuous printed dollar. The dollar can only be the world currency as a result of the United
States controlling global gold settlement. However, if other countries want their gold back from
the Fed, the Fed will lose its gold settlement position.”
The physical gold market prevailed last time and it will prevail again.
Current tightness in physical supply is suggested by market indicators. For example, GOFO (gold forward
offered rate), which is the interest rate for borrowing dollars using gold as collateral, has moved back into
negative territory…just.
The market will pay gold holders to borrow dollars.

December 2013

24
Gold Forward Offered Rate (GOFO %)
0.50

0.40

Source: Bloomberg, Monument Securities.

0.30

0.20

0.10

0.00

-0.10

Dec-13

Nov-13

Oct-13

Sep-13

Aug-13

Jul-13

Jun-13

May-13

Apr-13

Mar-13

Feb-13

Jan-13

Dec-12

Nov-12

Oct-12

Sep-12

Jul-12
Aug-12

-0.20

The gold futures market remains in backwardation, i.e. there is a negative gold basis (spot versus nearmonth future). Traders are turning down a free profit (albeit a small one currently) rather than risk any
physical delivery problems in the futures market. See the blue line in negative territory in this chart from
Sandeep Jaitly’s excellent “Gold Basis Service.”

Source: Gold Basis Service / Sandeep Jaitly

Gold should, and almost always has traded in contango, the only other exception was a brief period following
the collapse of Lehman.
It’s our contention that the demarcation between paper and physical markets is becoming increasingly
apparent. As an indication of the strength of physical gold demand, especially coming from China, here is an
excerpt from an interview Koos Jansen conducted earlier this month with Alex Stanzyk of Anglo Far-East, a
precious metals investment and custodial company. The interview followed Stanczyk’s meeting (along with
“Currency Wars” author, Jim Rickards) with the managing director of a major Swiss refiner.

December 2013

25
“He (the managing director) indicated the price didn’t make sense because he has got so much
fabrication demand. They put on three shifts, they’re working 24 hours a day, and originally he
thought that would wind down at some point. Well, they’ve been doing it all year. Every time
he thinks it’s going to slow down, he gets more orders, more orders, more orders. They have
expanded the plant to where it almost doubles their capacity. 70 % of their kilobar fabrication is
going to China, at a pace of 10 tons a week. That’s from one refinery, now remember there are 4
of these big ones (refineries) in Switzerland.
…At this Swiss refinery there have been several times this year on which they were unable to
source gold, this shocked me. They’re bringing in good delivery bars, scrap and dore from the
mines, basically all they can get their hands on. This gentleman has been in the business for 37
years, he was there during the last bull market in the late seventies. I asked him when was the
last time this happened, that he was unable to source gold, he said never. And I clarified it, I
asked: let me make sure if I understand what you’re saying to me, in the last 37 years you’ve
worked in the gold industry this has never happened? He said: this has never happened.”
The consensus seems to be upbeat on 2014, tapering not withstanding. Indeed, we’ve seen reports about
“show time” for growth in developed economies.
Hmmm, we are less upbeat and when it comes to the “New New Great Game”, we may only just be getting
started.
Given all of the threats to the US dollar as we head into 2014, you start wondering whether the Fed’s
expressed desire to taper is also about trying to shore up the dollar (as well as addressing collateral shortages
in the repo market).
US Dollar Index
130

120

Source: Bloomberg, Monument Securities.

110

100

90

80

70

2013

2012

2011

2010

2009

2008

2007

2006

2005

2004

2003

2002

2001

2000

60

We’re also mindful that when the Fed began to float the idea of tapering back in May 2013, the BRICS
currencies (albeit excluding the managed Remnimbi) were hammered.
Let’s move on to Janet Yellen and monetary policy, via the equity market.

December 2013

26
Janet Yellen and Bang-Bang Control
A Fed-centric market - who is John Galt?
“Although he is not identified by name until the last third of the novel, he is the object of its
often-repeated question “Who is John Galt?” and of the quest to discover the answer... he (Galt)
believes in the power and glory of the human mind, and the right of the individual to use his/her
mind solely for him/herself. He serves as a highly individualist counterpoint to the collectivist
social and economic structure depicted in the novel, in which society is based on oppressive
bureaucratic functionaries” 						
						

Wikipedia on Ayn Rand’s prophetic novel, Atlas Shrugged

The “polar opposite” scenarios for the US equity market highlighted in the last report are still in play. The first
was the 1954 pattern.
Dow Jones Industrial Average: 1954 v. 2013
410

17250

16750

390

16250

15750
350

15250

14750

330

14250
310
13750
290

13250

1954

31/12/1954

17/12/1954

03/12/1954

19/11/1954

05/11/1954

22/10/1954

08/10/1954

24/09/1954

10/09/1954

27/08/1954

13/08/1954

30/07/1954

16/07/1954

02/07/1954

18/06/1954

04/06/1954

21/05/1954

07/05/1954

23/04/1954

09/04/1954

26/03/1954

12/03/1954

26/02/1954

12/02/1954

29/01/1954

15/01/1954

12750

01/01/1954

270

Source: Bloomberg, Monument Securities.

370

2013 (since 11 Dec 2012)

While 1954 was a good year for equities, it was only around the midpoint in a long bull market. The second
was the 1928-30 pattern.
Dow Jones Industrial Average: 1928-30 v. 2012-13
400

17000
16500

350

16000

300

15000
14500

250

14000
13500

200

13000
12500

Jan 1928 - Apr 1930

December 2013

27

May 2012 - Oct 2013

03/04/1930

03/03/1930

03/02/1930

03/01/1930

03/12/1929

03/11/1929

03/10/1929

03/09/1929

03/08/1929

03/07/1929

03/06/1929

03/05/1929

03/04/1929

03/03/1929

03/02/1929

03/01/1929

03/12/1928

03/11/1928

03/10/1928

03/09/1928

03/08/1928

03/07/1928

03/06/1928

03/05/1928

03/04/1928

03/03/1928

03/02/1928

12000

03/01/1928

150

Source: Bloomberg, Monument Securities.

15500
This time around, driving both of these scenarios thus far has been the QE-driven liquidity wave. It remains
our contention that there is a degree of DIRECT causation between QE and rising equity prices, i.e. from the
collateralisation of QE-created “excess deposits” (reserves) via shadow banking conduits, principally repos.
These excess deposits are not as “inert” as most people believe.
S&P 500 v. Deposits minus Loans ("deposit to loan gap" in banks from QE)

1800

2400

1600

2000

1400

1600

1200

1200

1000

800

800

400

600

0

Mar09
Apr-09
May-09
Jun-09
Jul-09
Aug-09
Oct-09
Nov-09
Dec-09
Jan-10
Feb-10
Mar-10
Apr-10
Jun10
Jul-10
Aug-10
Sep-10
Oct-10
Nov-10
Dec-10
Feb-11
Mar-11
Apr-11
May-11
Jun-11
Jul-11
Sep-11
Oct-11
Nov-11
Dec-11
Jan-12
Feb-12
Mar-12
May-12
Jun-12
Jul-12
Aug-12
Sep-12
Oct-12
Nov-12
Jan-13
Feb-13
Mar-13
Apr-13
May-13
Jun-13
Aug-13
Sep-13
Oct-13
Nov-13

2800

S&P 500

Source: Bloomberg, Monument Securities.

2000

Deposits - Loans: All Commercial Banks (US$bn)

Former hedge fund manager, W. Ben Hunt, writing in his Epsilon Theory newsletter, captured the essence of
today’s financial markets.
“Marx believed that the greatest theft that capitalism perpetrated on the working class was
psychological. The Industrial Revolution and the assembly line crushed a worker’s spirit by
eliminating the sense of pride...What traditional value investors like (Jeremy) Grantham are
experiencing today is alienation in the traditional Marxist sense. In today’s context it’s not the
separation of a worker from the meaning of his labor, but the separation of an investor from the
meaning of his investment...it’s just going to be a continuing exercise in frustration so long as we
live in a Fed-centric universe.”
Since 2011, we’ve had this nagging fear that a modern-day version of Ayn Rand’s “Atlas Shrugged” is unfolding
in gradual fashion. This was Saxo Bank’s CIO, Steen Jakobsen, touching on one of its themes recently.
“It is time to realize that the reason capitalism won the war against communism in the 1980s was
its strong market based economy, itself based on price discovery. Now the policymakers in their
wisdom are copying everything a planned economy entails: central planning and control, no price
discovery, one supplier of credit and money...”
New money (deposits) in the US economy is being created by the Fed’s QE programme instead of new lending.

December 2013

28
All Commercial Banks: Deposits v. Loans (US$bn)
10000

9000

7000

6000

5000

4000

3000

Deposits: All Commercial Banks

Apr-13

Sep-13

Nov-12

Jan-12

Jun-12

Aug-11

Oct-10

Mar-11

May-10

Jul-09

Dec-09

Feb-09

Apr-08

Sep-08

Nov-07

Jan-07

Jun-07

Aug-06

Oct-05

Mar-06

May-05

Jul-04

Dec-04

Feb-04

Apr-03

Sep-03

Nov-02

Jan-02

Jun-02

Aug-01

Oct-00

Mar-01

May-00

Jul-99

Dec-99

Feb-99

Apr-98

Sep-98

Nov-97

Jan-97

Jun-97

2000

Source: Bloomberg, Monument Securities.

8000

Loans & leases: All Commercial Banks

Most people don’t “get” this, so what will they think if the QE tap is turned off. We’ll need that mid-cycle pickup in GDP growth we discussed in the last report.
We are caught in some kind of weird Hegelian dialectic where capitalism (thesis) is increasingly pitted against,
and tainted by, the march of socialism (antithesis) while we await an outcome (synthesis). Capitalism has
been diluted to a shadow of its old self.
Financial bubbles are driven by excess credit - which we’ve obviously had in spades – although the consensus
remains in “bubble denial.” The extreme level and longevity of central bank intervention seems to have
“conditioned” perceptions.
This was Doug Noland of the Credit Bubble Bulletin.
“the Fed is today, along with fellow global central banks, propagating the greatest distortion in
the pricing and allocation of finance in history.”
Wikipedia on Atlas Shrugged again.
“The book’s opening line “Who is John Galt?” becomes an expression of helplessness and despair
at the current state of the novel’s fictionalized world.”
But we are where we are....in a truly novel situation
		

Novelty: 	

the quality of being new, original, or unusual

Let’s put this “novelty” in a long-term context.
The next slide is very “busy”, but it summarises key phases and approximate dates in the way that long
economic waves unfolded from 1788-2000. It provides a framework for how central bankers/planners are
trying to defy a centuries-old process – the ebb and flow of (former?) capitalist economies.

December 2013

29
Source: Monument Securities

The right side of the chart shows how periods of deflation/depression brought previous long economic waves
to a close for more than two centuries.
To stave off the normal depressionary conclusion to the current wave, Greenspan took Fed Funds down to
1%, which was unprecedented at the time. To stave off another depressionary conclusion to the current
wave – and to counteract the “financialisation” of the US economy - Bernanke has kept us on ZIRP for almost
5 years and thrown in TARP, TALF, QE1, QE2, Twist, and QE3. The latter are ALL asset buying programmes.
You can see why some eminent analysts (e.g. CLSA’s Russell Napier) are warning about a coming deflationary
shock. It was, and is, the natural course of events - absent the extreme post-crisis policy intervention we’ve
grown accustomed to.
Compared to what’s happened in previous cycles – one could easily argue that the entire system, both the
economy AND the financial markets - are in a central bank-created bubble. While we believe that equities
will win over bonds in the endgame and still look attractive on a relative basis, it slightly misses the point.
Implicit in the above chart is an explanation of how we’ve found ourselves in the unusual situation where the
transmission mechanism of monetary policy is largely broken in terms of the real economy in the last phase
of this cycle...
•	 Under-capitalised banks, still recovering from the crisis, are reluctant to lend;
•	 Over-indebted consumers are reluctant to borrow; and
•	 Historically subdued levels of capacity utilisation in developed economies mean that capital investment
undershoots expectations during the “recovery.”

December 2013

30
Source: St. Louis Fed

...but has never worked so well when it comes to some asset markets (liquidity has to go somewhere).
Asset prices and Fed policy are joined at the hip and the US economy has never been so dependent on
confidence in financial markets.
With so much debt, the WHOLE SYSTEM is unusually sensitive on the downside to a sudden rise in interest
rates. By tapering, the Fed risks losing control of the long end of the yield curve, but not tapering risks
collateral problems in the systemically critical repo market.
The Fed is in danger of cornering itself and its communication policy suggests that it realises this. Our
economist, Stephen Lewis, explained it succinctly.
“QE policy and interest rate policy are separate, they (FOMC) would have us believe. The problem
is that central bank asset purchases were originally presented, most notably by Mr Bernanke in
his (in)famous November 2002 speech, as the logical next step when short-term interest rates
had been pushed down to their zero lower bound. Rate cuts and QE were part of one and the
same spectrum of policies. Having understood this, the markets can hardly be blamed now if they
regard de-escalation of QE as a step towards a general monetary tightening”
This was Janet Yellen speaking in 2012.
“Research by Federal Reserve staff and others suggests that our balance sheet operations have
had substantial effects on longer-term Treasury yields...These results suggest that our portfolio
actions are currently keeping 10-year Treasury yields roughly 60 basis points lower than they
otherwise would be.”
We’ve noted before how Bernanke was critical of Fed policy during the Great Depression for stopping open
market operations (QE) in 1932, which led to a rise in real interest rates, which prolonged the Great Depression.
We’ve been watching real long-term yields rising this year.

December 2013

31
Barclays US Inflation linked 7-10 years real yield (%)
1.00

0.50

Source: Bloomberg, Monument Securities.

0.00

-0.50

-1.00

Dec-13

Nov-13

Oct-13

Sep-13

Aug-13

Jul-13

Jun-13

May-13

Apr-13

Mar-13

Feb-13

Jan-13

Dec-12

Nov-12

Oct-12

Sep-12

Aug-12

Jul-12

-1.50

Now, because it’s convenient, tapering is not tightening. John Hilsenrath, the Fed’s voice at the WSJ, (really)
wanted us to know that just after last week’s better-than-expected non-farm payrolls.
“MARKETS BELIEVE TAPERING ISN’T TIGHTENING: Markets are positioned more to the Fed’s
liking today than they were in September, when it put off reducing, or “tapering,” the monthly
bond purchases. Most notably, the Fed’s message is sinking in that a wind down of the program
won’t mean it’s in a hurry to raise short-term interest rates. Futures markets place a very low
probability on Fed rate increases before 2015, in contrast to September, when fed funds futures
markets indicated rate increases were expected by the end of 2014. The Fed has been trying to
drive home the idea that “tapering is not tightening” for months and is likely to feel comforted
that investors believe it as a pullback gets serious consideration.”
Can anybody say “optimal control?”
But the long end will be key...at least the Fed already owns about half the 10-year. And they really need a
mid-cycle pick-up in growth (rather than GDP figures exaggerated by inventory adjustments).
In a normal/rational world, with the Fed signalling that it is preparing to embark on tapering with equity
markets at all-time highs, this would be a sensible “wait and see” opportunity to reduce equity market
exposure.
But these are unusual times...
While identifying bubbles is not as difficult as the Fed would like us to believe, navigating them is a different
matter. The dilemma faced by investors was best articulated by Byron Wien speaking on CNBC.
“You don’t stay out of the market waiting for the moment of truth.”

December 2013

32
We’ve highlighted the Summation Index (a measure of breadth based on the McClellan Oscillator) as being
the only indicator that we’d found that’s had a good correlation with market direction in recent months. Even
that has broken down.
S&P 500 v. Summation Index
5500
1800
4500

3500

1600
2500

1500

1500

1400

500

S&P 500

Dec-13

Nov-13

Oct-13

Sep-13

Aug-13

Jul-13

Jun-13

May-13

Apr-13

Mar-13

Feb-13

Jan-13

Dec-12

Nov-12

Oct-12

Sep-12

-500

Aug-12

1300

Source: Bloomberg, Monument Securities.

1700

Summation Index

We might have reached the point where the most basic form of technical analysis is the best tool, i.e. exit on
a break in support...while trying not to get mown down in the rush?
Janet Yellen might be a “dove”, but she understands how QE is draining the available collateral from the
shadow banking system, principally the US$4.6 trn US repo market. Indeed, she is the only Fed Governor
who has specifically identified the risk.
“A major source of unaddressed risk emanates from the large volume of short-term securities
financing transactions – repos, reverse repos...”
LTCM, Bear Stearns, Lehman and MF Global all went under in the repo market. The mainstream media is
starting to get it.

Source: Wall Street Journal

December 2013

33
Hallelujah...although the WSJ article (“Fed Eyes Financial System’s Weakest Link”) didn’t highlight the link
between QE and collateral shortage.
We applaud Janet Yellen’s understanding of shadow banking, but have some reservations about what might
be the centrepiece of her monetary policy.

The Yellen-effect
We remember the last time there was an incoming Fed Chairman...
In January 2006, we highlighted key messages from eight speeches given by incoming Fed Chair, Ben
Bernanke. They dealt with combating the threat of deflation, especially when policy is constrained by the
zero bound, and turned out to be prophetic (to say the least).
In Yellen’s case, our suspicion is that her speech to the Boston Economic Club in June 2012, which dealt with
optimal control, is the one to focus on. After her recent Senate appearance, our economist, Stephen Lewis,
noted.
“While there is no reason to suppose Ms Yellen’s anxieties over unemployment are anything but
sincere, senators did not tackle her on the most distinctive feature of her approach to implementing
monetary policy, namely, her enthusiasm for ‘optimal control’ techniques.”
Our hunch seems much more likely following last month’s publication of a supportive paper “The Federal
Reserve’s Framework for Monetary Policy - Recent Changes and New Questions” which garnered much
attention recently. This report was published by three senior Fed economists and was presented at an IMF
conference in early November.
There were three references to Janet Yellen in the first four pages.
The theory of optimal control resides in advanced mathematics and its real world applications span engineering
from the simple to very advanced, e.g. the space programme. While it sounds good, it’s not very sophisticated
when applied to monetary policy. It’s merely the estimation of a path for the Fed Funds rate that minimises
the value of a “loss function”, inflation in this case, which is conditional (of course) on the Fed’s own baseline
forecast of economic conditions.
Both Yellen’s speech and the Fed paper focus on three main variables, the Fed Funds rate, inflation and
unemployment. Both compare an optimal control strategy against “simple” policy rules, including various
iterations of the Taylor rule, i.e. the inflation/interest rate trade off.
In cynical terms, it boils down to the following: with the Fed Funds already at zero, let’s commit to maintain
rates at zero well after traditional policy rules (e.g. the “Taylor rule”) would dictate a rise in rates as the
recovery gathers pace. Not exactly rocket science and more confirmation of the Fed’s overwhelming bias
towards inflation.
But...
When we get another growth slowdown in this final phase of the current long wave, the deflationary forces
are so powerful that the Fed might have to resort to “shock and awe” tactics on monetary stimulus to
generate inflation. That’s certainly the case in Japan. There is also the risk that, at some stage, a tipping point
is reached and all confidence in the currency is lost, resulting in far MORE inflation than desired.

December 2013

34
Back in her June 2012 speech, Yellen concluded that the Fed Funds rate required immediate tightening under
the Taylor rule to ensure price stability while returning the economy to a position close to full employment.
Under optimal control, Fed Funds could be kept at zero until late-2015.

Source: Federal Reserve

The Fed paper concluded that an optimal control policy with commitment, i.e. to keep rates at zero well into
the expansion, could lead to the first rise in rates being delayed as late as 2017 as shown below.

Source: IMF

December 2013

35
Just like clockwork in the models. The idea that you can control a system as complex as the US economy in
this manner...
Unsurprisingly, both Yellen and the Fed economists make several VERY convenient assumptions such as.
•	 The pledge to maintain short-term rates at zero for a long period will, of itself, lead to a rapid and
consistent reduction in unemployment to its natural rate. At no point does this process get stuck, or even
reverse course, despite the increasing longevity of the current economic expansion;
•	 The “cost” in terms of inflation overshooting the 2% target will be minimal. While the risk that inflation
could surprise on the upside is discounted, the risk that the policy could be overwhelmed by the powerful
deflationary forces (as per the above discussion) is not even considered;
•	 The definition of inflation chosen by the Fed is its favourite “core PCE”, i.e. excluding the stuff (food and
energy) most likely to rise in price in an inflationary environment;
•	 If the Fed does embark on tapering, there will be no adverse effect from reduced tapering on, for example,
long-term interest rates and/or lower asset prices, etc; and
•	 The central bank “enjoys complete credibility” (in the case of the IMF paper).

The big switch!
At this point, it seems likely that a Yellen Fed is going to try to offset the impact of tapering QE with some form
of optimal control with “enhanced” forward guidance versus the current thresholds of 6.5% unemployment
and 2.5% inflation.
The Fed paper incorporated simulations with forward guidance on economic thresholds, including a reduction
to 5.5% for unemployment which some commentators have suggested. According to the IMF paper’s
simulation, a 5.5% unemployment threshold (with 2.5% inflation) implies an initial rise in the Fed Funds rate
in Q4 2015 – not 2017 as speculated in the FT. It also suggests that the delay in the first Fed Funds increase
would only be two or three quarters later than with the current threshold of 6.5%.

Source: IMF

December 2013

36
Does a commitment to keeping the Fed Funds rate at zero for an additional two or three quarters
pale into insignificance compared with reducing QE by an annualised rate of more than US$ 1
trillion per annum.
We suspect so, although the Fed is likely to soften the initial blow by reductions in “baby steps” of say
US$10bn.
But tapering is not tightening and the models work beautifully.
The “father” of optimal control was a (Soviet) mathematician, Lev Pontryagin, revered as one of the greatest
of the twentieth century. He was also blind and depended on his mother to read maths books to him while
he was growing up.
In his study of optimal control theory, Pontryagin introduced the “maximum principle.” One might argue that
ZIRP plus QE of US$85bn per month is akin to the maximum principle in the history of US monetary policy.
Pontryagin also introduced the idea of “bang-bang control.” From Wikipedia.
“In control theory, a bang–bang controller (on–off controller)....is a feedback controller that
switches abruptly between two states...They are often used to control a plant that accepts a
binary input, for example, a furnace that is either completely on or completely off.”
Your hot water system operates under bang-bang control.
We remain doubtful that the US economy has reached the much discussed “escape velocity” on a sustainable
basis. Consequently, if the Fed managed to taper QE entirely before the next slowdown/recession, the latter
might trigger an abrupt return of VERY accommodative monetary policy in a true “bang-bang control” manner.
Perhaps more likely is that the Fed begins to taper, but a slowing economy forces it to reverse course later
in 2014.
Finally, Stephen Lewis on the “Fad of the Year.”
“The year 2013 will go down in history as the year when ‘forward guidance’ became the latest craze
in central bank policy circles. Casual observers might assume that central banks are continually
honing the instruments they use to implement their policies, and developing new ones. It might
seem reasonable to suppose that this is a story of steady improvement in the effectiveness of
central bank actions. That has not been the case, however. No major central bank nowadays
aims to control the money supply (however defined), though that is what they all did in the 1980s.
At the time, it was hailed as the long-concealed key to success that set modern central bank
practice apart from the less than optimal performance of the past. But that view did not prevail
for long. Later, ‘inflation targeting’ became the vogue but, following the 2007-09 financial crisis,
only the Bank of Japan, among the majors, commits to meeting a specific target for inflation as
its overriding policy-objective. Five years ago, ‘forward guidance’, whereby a central bank makes
a commitment regarding its policy-settings conditional on a timeline or on specified economic
circumstances, was merely an idea tossed around in a few university lecture-rooms....
“In his speech in New York earlier this week, Mr Carney argued that central banks had to respond
aggressively to counter the risks of the liquidity trap closing. ‘Forward guidance is integral to the
response,’ he declared. ‘It reduces uncertainty by providing reassurance that monetary policy

December 2013

37
will not be tightened prematurely before the recovery is entrenched to sustain higher rates.’ That
is the standard defence of ‘forward guidance’. Even so, not all central bankers are impressed
by the efficacy of this fashionable technique of monetary management. In a speech yesterday,
Dr Weale of the BoE’s MPC made what is a valid point. He declared, ‘I find it inconceivable that,
without forward guidance, I or any of my colleagues would already have voted to raise Bank Rate
and that the only thing that has stopped us is forward guidance. If forward guidance has done
no more than to codify what people had expected the Monetary Policy Committee to do anyway,
then its effects on the profile of expected future rates, and thus on output and inflation, should
be expected to be small.’ An even more outspoken critic of ‘forward guidance’ is Prof Fischer,
often styled the doyen of central bankers partly on the grounds of his having been Mr Bernanke’s
Ph.D thesis advisor. He may well feel that his pupil has gone astray because, in September, he
lambasted ‘forward guidance’. He argued that, since the future is unknown, the central bank has
no business giving assurances as to its future actions. Doing so is very likely to cause market
confusion.
“In the light of those comments, it is intriguing that Washington should be awash with rumours
that President Obama wishes to appoint Prof Fischer as Vice Chairman of the Federal Reserve...”

December 2013

38
Important Information –Monument Securities Limited – FCA No 149028 Independent Investment Research
Disclaimer
This information has been has been issued by Monument Securities Limited (MSL) in accordance with
MSL’s Investment Research Policy. This information is only intended to be distributed to existing Eligible
Counterparties and Professional Clients of MSL. Further, MSL’s investment research is intended for use
solely by Eligible Counterparties and Professional Clients, who possess a certain degree of knowledge and
experience in the subject of this information. Therefore the contents may refer to terms and subjects that
may be unsuitable for a retail client and this information should not under any circumstances be forwarded
to a retail client.
This content is for information purposes only and should not be construed as an offer, solicitation or
recommendation to buy or sell any investments or investment advice. MSL do not recommend or endorse
any particular investment, or course of action. This information has no regard for any investment
objectives or financial situation of any eligible counterparty or professional client. Any investment that
is mentioned may warrant further investigation or research, which will be solely at the discretion of the
eligible counterparty or professional client.
Information and opinions expressed herein are based on sources believed to be reliable, however we do
not represent that they are accurate or complete. Further any views or estimates are based on judgements
made as at the date of this information. All opinions and estimates are subject to change without notice.
MSL and/or connected persons may from time to time have positions in or effect transactions in any
investment or related investment mentioned herein and may provide financial services to the issuers or
such investments.
MSL has put in place systems and controls mechanisms supported by appropriate procedures to identify
and manage any conflicts of interest that may arise. A copy of our conflict of interest policy is available
on request. In relation to this content, we do not believe that any relationships, circumstances, interests
or potential conflicts of interest that would require disclosure under the FCA Conduct of Business rules
are likely to arise. In particular no major shareholdings or financial interests exist between MSL and any
relevant company. In the event that this situation changes then appropriate disclosures will be made.
All investments involve a degree of risk and may not be suitable for certain investors. All investors should
make their own investment decisions based on their circumstances, financial objectives and resources and
after seeking any appropriate professional advice.
This is a marketing communication. It has not been prepared under the Independent Investment
research regulatory requirements and accordingly there is no prohibition on dealing ahead of
the dissemination of this research material.
Monument Securities Limited is authorised and regulated by the Financial Services Authority FCA Number
149028 in the UK.

December 2013

39

Mais conteúdo relacionado

Semelhante a The new new great game

Geopolitics of myanmar
Geopolitics of myanmarGeopolitics of myanmar
Geopolitics of myanmaraungkokotoe
 
GEO-POLITICS OF GLOBAL WARMING AND EMERGENCE OF A NEW GEO-STRATEGIC CENTER IN...
GEO-POLITICS OF GLOBAL WARMING AND EMERGENCE OF A NEW GEO-STRATEGIC CENTER IN...GEO-POLITICS OF GLOBAL WARMING AND EMERGENCE OF A NEW GEO-STRATEGIC CENTER IN...
GEO-POLITICS OF GLOBAL WARMING AND EMERGENCE OF A NEW GEO-STRATEGIC CENTER IN...Keshav Prasad Bhattarai
 
geopolitics-221223100742-0a42dc91bxnx.pptx
geopolitics-221223100742-0a42dc91bxnx.pptxgeopolitics-221223100742-0a42dc91bxnx.pptx
geopolitics-221223100742-0a42dc91bxnx.pptxUlugbek7
 
ulugbek mirzokhidov mustaqil ishi geosiyosat.pptx
ulugbek mirzokhidov mustaqil ishi geosiyosat.pptxulugbek mirzokhidov mustaqil ishi geosiyosat.pptx
ulugbek mirzokhidov mustaqil ishi geosiyosat.pptxUlugbek7
 
Gold not the end game
Gold not the end gameGold not the end game
Gold not the end gameInves Trekk
 
Personal Finance Essay. Essays On Personal Finance
Personal Finance Essay. Essays On Personal FinancePersonal Finance Essay. Essays On Personal Finance
Personal Finance Essay. Essays On Personal FinanceGina Sage
 
WWII DBQ Overview
WWII DBQ OverviewWWII DBQ Overview
WWII DBQ OverviewGreg Sill
 
Honors geo. ch 25 p.p.
Honors geo. ch 25 p.p.Honors geo. ch 25 p.p.
Honors geo. ch 25 p.p.tobin15
 
gold standard. The system of monetary organization under which the ...
 gold standard. The system of monetary organization under which the ... gold standard. The system of monetary organization under which the ...
gold standard. The system of monetary organization under which the ...pleasure16
 
The Many Lives of the New WestAuthor(s) Joseph E. Taylor.docx
 The Many Lives of the New WestAuthor(s) Joseph E. Taylor.docx The Many Lives of the New WestAuthor(s) Joseph E. Taylor.docx
The Many Lives of the New WestAuthor(s) Joseph E. Taylor.docxaryan532920
 
The lexus and_the_olive_tree
The lexus and_the_olive_treeThe lexus and_the_olive_tree
The lexus and_the_olive_treeCang Pham Trung
 
Atomic Energy Essay.pdf
Atomic Energy Essay.pdfAtomic Energy Essay.pdf
Atomic Energy Essay.pdfApril Bergseth
 
Spring 2014 - 4 Catalysts for a Bull Run in Precious Metals
Spring 2014 - 4 Catalysts for a Bull Run in Precious MetalsSpring 2014 - 4 Catalysts for a Bull Run in Precious Metals
Spring 2014 - 4 Catalysts for a Bull Run in Precious MetalsMoney Metals Exchange
 
TOWARDS A GEOPOLITICAL UNDERSTANDING OF ISLAMICJERUSALEM DURING THE A YYOBID ...
TOWARDS A GEOPOLITICAL UNDERSTANDING OF ISLAMICJERUSALEM DURING THE A YYOBID ...TOWARDS A GEOPOLITICAL UNDERSTANDING OF ISLAMICJERUSALEM DURING THE A YYOBID ...
TOWARDS A GEOPOLITICAL UNDERSTANDING OF ISLAMICJERUSALEM DURING THE A YYOBID ...islamicjerusalem
 
Could Gold Make A Come Back
Could Gold Make A Come BackCould Gold Make A Come Back
Could Gold Make A Come BackAwais Ali
 

Semelhante a The new new great game (20)

Geopolitics of myanmar
Geopolitics of myanmarGeopolitics of myanmar
Geopolitics of myanmar
 
GEO-POLITICS OF GLOBAL WARMING AND EMERGENCE OF A NEW GEO-STRATEGIC CENTER IN...
GEO-POLITICS OF GLOBAL WARMING AND EMERGENCE OF A NEW GEO-STRATEGIC CENTER IN...GEO-POLITICS OF GLOBAL WARMING AND EMERGENCE OF A NEW GEO-STRATEGIC CENTER IN...
GEO-POLITICS OF GLOBAL WARMING AND EMERGENCE OF A NEW GEO-STRATEGIC CENTER IN...
 
Classical views of geopolitics
Classical views of geopoliticsClassical views of geopolitics
Classical views of geopolitics
 
geopolitics-221223100742-0a42dc91bxnx.pptx
geopolitics-221223100742-0a42dc91bxnx.pptxgeopolitics-221223100742-0a42dc91bxnx.pptx
geopolitics-221223100742-0a42dc91bxnx.pptx
 
ulugbek mirzokhidov mustaqil ishi geosiyosat.pptx
ulugbek mirzokhidov mustaqil ishi geosiyosat.pptxulugbek mirzokhidov mustaqil ishi geosiyosat.pptx
ulugbek mirzokhidov mustaqil ishi geosiyosat.pptx
 
geopolitics.ppt
geopolitics.pptgeopolitics.ppt
geopolitics.ppt
 
Gold not the end game
Gold not the end gameGold not the end game
Gold not the end game
 
Personal Finance Essay. Essays On Personal Finance
Personal Finance Essay. Essays On Personal FinancePersonal Finance Essay. Essays On Personal Finance
Personal Finance Essay. Essays On Personal Finance
 
Presentation1
Presentation1Presentation1
Presentation1
 
WWII DBQ Overview
WWII DBQ OverviewWWII DBQ Overview
WWII DBQ Overview
 
Honors geo. ch 25 p.p.
Honors geo. ch 25 p.p.Honors geo. ch 25 p.p.
Honors geo. ch 25 p.p.
 
gold standard. The system of monetary organization under which the ...
 gold standard. The system of monetary organization under which the ... gold standard. The system of monetary organization under which the ...
gold standard. The system of monetary organization under which the ...
 
The Many Lives of the New WestAuthor(s) Joseph E. Taylor.docx
 The Many Lives of the New WestAuthor(s) Joseph E. Taylor.docx The Many Lives of the New WestAuthor(s) Joseph E. Taylor.docx
The Many Lives of the New WestAuthor(s) Joseph E. Taylor.docx
 
The lexus and_the_olive_tree
The lexus and_the_olive_treeThe lexus and_the_olive_tree
The lexus and_the_olive_tree
 
Atomic Energy Essay.pdf
Atomic Energy Essay.pdfAtomic Energy Essay.pdf
Atomic Energy Essay.pdf
 
Spring 2014 - 4 Catalysts for a Bull Run in Precious Metals
Spring 2014 - 4 Catalysts for a Bull Run in Precious MetalsSpring 2014 - 4 Catalysts for a Bull Run in Precious Metals
Spring 2014 - 4 Catalysts for a Bull Run in Precious Metals
 
TOWARDS A GEOPOLITICAL UNDERSTANDING OF ISLAMICJERUSALEM DURING THE A YYOBID ...
TOWARDS A GEOPOLITICAL UNDERSTANDING OF ISLAMICJERUSALEM DURING THE A YYOBID ...TOWARDS A GEOPOLITICAL UNDERSTANDING OF ISLAMICJERUSALEM DURING THE A YYOBID ...
TOWARDS A GEOPOLITICAL UNDERSTANDING OF ISLAMICJERUSALEM DURING THE A YYOBID ...
 
528
528528
528
 
Geopolitics Key
Geopolitics KeyGeopolitics Key
Geopolitics Key
 
Could Gold Make A Come Back
Could Gold Make A Come BackCould Gold Make A Come Back
Could Gold Make A Come Back
 

Mais de deepanshuberry

Mais de deepanshuberry (12)

IIM L Finals
IIM L FinalsIIM L Finals
IIM L Finals
 
Moss Week 04 Full Set
Moss   Week 04   Full SetMoss   Week 04   Full Set
Moss Week 04 Full Set
 
M Quiz Prelims With Answers
M Quiz Prelims With AnswersM Quiz Prelims With Answers
M Quiz Prelims With Answers
 
M Quiz Finals College
M Quiz Finals CollegeM Quiz Finals College
M Quiz Finals College
 
Hyd Finals
Hyd FinalsHyd Finals
Hyd Finals
 
Hyd Prelims
Hyd PrelimsHyd Prelims
Hyd Prelims
 
Mosstermind Week 02 Full Set With Answers
Mosstermind   Week 02   Full Set   With AnswersMosstermind   Week 02   Full Set   With Answers
Mosstermind Week 02 Full Set With Answers
 
Mosstermind Week 1 Full Set With Answers
Mosstermind   Week 1  Full Set With AnswersMosstermind   Week 1  Full Set With Answers
Mosstermind Week 1 Full Set With Answers
 
Palli Pragyan .Finale
Palli Pragyan .FinalePalli Pragyan .Finale
Palli Pragyan .Finale
 
Hyd Finals
Hyd FinalsHyd Finals
Hyd Finals
 
Hyd Prelims
Hyd PrelimsHyd Prelims
Hyd Prelims
 
Tata crucible chennai Finals
Tata crucible chennai FinalsTata crucible chennai Finals
Tata crucible chennai Finals
 

Último

Fordham -How effective decision-making is within the IT department - Analysis...
Fordham -How effective decision-making is within the IT department - Analysis...Fordham -How effective decision-making is within the IT department - Analysis...
Fordham -How effective decision-making is within the IT department - Analysis...Peter Ward
 
Strategic Project Finance Essentials: A Project Manager’s Guide to Financial ...
Strategic Project Finance Essentials: A Project Manager’s Guide to Financial ...Strategic Project Finance Essentials: A Project Manager’s Guide to Financial ...
Strategic Project Finance Essentials: A Project Manager’s Guide to Financial ...Aggregage
 
WSMM Technology February.March Newsletter_vF.pdf
WSMM Technology February.March Newsletter_vF.pdfWSMM Technology February.March Newsletter_vF.pdf
WSMM Technology February.March Newsletter_vF.pdfJamesConcepcion7
 
Intermediate Accounting, Volume 2, 13th Canadian Edition by Donald E. Kieso t...
Intermediate Accounting, Volume 2, 13th Canadian Edition by Donald E. Kieso t...Intermediate Accounting, Volume 2, 13th Canadian Edition by Donald E. Kieso t...
Intermediate Accounting, Volume 2, 13th Canadian Edition by Donald E. Kieso t...ssuserf63bd7
 
Interoperability and ecosystems: Assembling the industrial metaverse
Interoperability and ecosystems:  Assembling the industrial metaverseInteroperability and ecosystems:  Assembling the industrial metaverse
Interoperability and ecosystems: Assembling the industrial metaverseSiemens
 
Technical Leaders - Working with the Management Team
Technical Leaders - Working with the Management TeamTechnical Leaders - Working with the Management Team
Technical Leaders - Working with the Management TeamArik Fletcher
 
14680-51-4.pdf Good quality CAS Good quality CAS
14680-51-4.pdf  Good  quality CAS Good  quality CAS14680-51-4.pdf  Good  quality CAS Good  quality CAS
14680-51-4.pdf Good quality CAS Good quality CAScathy664059
 
Darshan Hiranandani [News About Next CEO].pdf
Darshan Hiranandani [News About Next CEO].pdfDarshan Hiranandani [News About Next CEO].pdf
Darshan Hiranandani [News About Next CEO].pdfShashank Mehta
 
Guide Complete Set of Residential Architectural Drawings PDF
Guide Complete Set of Residential Architectural Drawings PDFGuide Complete Set of Residential Architectural Drawings PDF
Guide Complete Set of Residential Architectural Drawings PDFChandresh Chudasama
 
1911 Gold Corporate Presentation Apr 2024.pdf
1911 Gold Corporate Presentation Apr 2024.pdf1911 Gold Corporate Presentation Apr 2024.pdf
1911 Gold Corporate Presentation Apr 2024.pdfShaun Heinrichs
 
How Generative AI Is Transforming Your Business | Byond Growth Insights | Apr...
How Generative AI Is Transforming Your Business | Byond Growth Insights | Apr...How Generative AI Is Transforming Your Business | Byond Growth Insights | Apr...
How Generative AI Is Transforming Your Business | Byond Growth Insights | Apr...Hector Del Castillo, CPM, CPMM
 
Church Building Grants To Assist With New Construction, Additions, And Restor...
Church Building Grants To Assist With New Construction, Additions, And Restor...Church Building Grants To Assist With New Construction, Additions, And Restor...
Church Building Grants To Assist With New Construction, Additions, And Restor...Americas Got Grants
 
Unveiling the Soundscape Music for Psychedelic Experiences
Unveiling the Soundscape Music for Psychedelic ExperiencesUnveiling the Soundscape Music for Psychedelic Experiences
Unveiling the Soundscape Music for Psychedelic ExperiencesDoe Paoro
 
TriStar Gold Corporate Presentation - April 2024
TriStar Gold Corporate Presentation - April 2024TriStar Gold Corporate Presentation - April 2024
TriStar Gold Corporate Presentation - April 2024Adnet Communications
 
Types of Cyberattacks - ASG I.T. Consulting.pdf
Types of Cyberattacks - ASG I.T. Consulting.pdfTypes of Cyberattacks - ASG I.T. Consulting.pdf
Types of Cyberattacks - ASG I.T. Consulting.pdfASGITConsulting
 
Environmental Impact Of Rotary Screw Compressors
Environmental Impact Of Rotary Screw CompressorsEnvironmental Impact Of Rotary Screw Compressors
Environmental Impact Of Rotary Screw Compressorselgieurope
 
Introducing the Analogic framework for business planning applications
Introducing the Analogic framework for business planning applicationsIntroducing the Analogic framework for business planning applications
Introducing the Analogic framework for business planning applicationsKnowledgeSeed
 
20220816-EthicsGrade_Scorecard-JP_Morgan_Chase-Q2-63_57.pdf
20220816-EthicsGrade_Scorecard-JP_Morgan_Chase-Q2-63_57.pdf20220816-EthicsGrade_Scorecard-JP_Morgan_Chase-Q2-63_57.pdf
20220816-EthicsGrade_Scorecard-JP_Morgan_Chase-Q2-63_57.pdfChris Skinner
 
business environment micro environment macro environment.pptx
business environment micro environment macro environment.pptxbusiness environment micro environment macro environment.pptx
business environment micro environment macro environment.pptxShruti Mittal
 
20200128 Ethical by Design - Whitepaper.pdf
20200128 Ethical by Design - Whitepaper.pdf20200128 Ethical by Design - Whitepaper.pdf
20200128 Ethical by Design - Whitepaper.pdfChris Skinner
 

Último (20)

Fordham -How effective decision-making is within the IT department - Analysis...
Fordham -How effective decision-making is within the IT department - Analysis...Fordham -How effective decision-making is within the IT department - Analysis...
Fordham -How effective decision-making is within the IT department - Analysis...
 
Strategic Project Finance Essentials: A Project Manager’s Guide to Financial ...
Strategic Project Finance Essentials: A Project Manager’s Guide to Financial ...Strategic Project Finance Essentials: A Project Manager’s Guide to Financial ...
Strategic Project Finance Essentials: A Project Manager’s Guide to Financial ...
 
WSMM Technology February.March Newsletter_vF.pdf
WSMM Technology February.March Newsletter_vF.pdfWSMM Technology February.March Newsletter_vF.pdf
WSMM Technology February.March Newsletter_vF.pdf
 
Intermediate Accounting, Volume 2, 13th Canadian Edition by Donald E. Kieso t...
Intermediate Accounting, Volume 2, 13th Canadian Edition by Donald E. Kieso t...Intermediate Accounting, Volume 2, 13th Canadian Edition by Donald E. Kieso t...
Intermediate Accounting, Volume 2, 13th Canadian Edition by Donald E. Kieso t...
 
Interoperability and ecosystems: Assembling the industrial metaverse
Interoperability and ecosystems:  Assembling the industrial metaverseInteroperability and ecosystems:  Assembling the industrial metaverse
Interoperability and ecosystems: Assembling the industrial metaverse
 
Technical Leaders - Working with the Management Team
Technical Leaders - Working with the Management TeamTechnical Leaders - Working with the Management Team
Technical Leaders - Working with the Management Team
 
14680-51-4.pdf Good quality CAS Good quality CAS
14680-51-4.pdf  Good  quality CAS Good  quality CAS14680-51-4.pdf  Good  quality CAS Good  quality CAS
14680-51-4.pdf Good quality CAS Good quality CAS
 
Darshan Hiranandani [News About Next CEO].pdf
Darshan Hiranandani [News About Next CEO].pdfDarshan Hiranandani [News About Next CEO].pdf
Darshan Hiranandani [News About Next CEO].pdf
 
Guide Complete Set of Residential Architectural Drawings PDF
Guide Complete Set of Residential Architectural Drawings PDFGuide Complete Set of Residential Architectural Drawings PDF
Guide Complete Set of Residential Architectural Drawings PDF
 
1911 Gold Corporate Presentation Apr 2024.pdf
1911 Gold Corporate Presentation Apr 2024.pdf1911 Gold Corporate Presentation Apr 2024.pdf
1911 Gold Corporate Presentation Apr 2024.pdf
 
How Generative AI Is Transforming Your Business | Byond Growth Insights | Apr...
How Generative AI Is Transforming Your Business | Byond Growth Insights | Apr...How Generative AI Is Transforming Your Business | Byond Growth Insights | Apr...
How Generative AI Is Transforming Your Business | Byond Growth Insights | Apr...
 
Church Building Grants To Assist With New Construction, Additions, And Restor...
Church Building Grants To Assist With New Construction, Additions, And Restor...Church Building Grants To Assist With New Construction, Additions, And Restor...
Church Building Grants To Assist With New Construction, Additions, And Restor...
 
Unveiling the Soundscape Music for Psychedelic Experiences
Unveiling the Soundscape Music for Psychedelic ExperiencesUnveiling the Soundscape Music for Psychedelic Experiences
Unveiling the Soundscape Music for Psychedelic Experiences
 
TriStar Gold Corporate Presentation - April 2024
TriStar Gold Corporate Presentation - April 2024TriStar Gold Corporate Presentation - April 2024
TriStar Gold Corporate Presentation - April 2024
 
Types of Cyberattacks - ASG I.T. Consulting.pdf
Types of Cyberattacks - ASG I.T. Consulting.pdfTypes of Cyberattacks - ASG I.T. Consulting.pdf
Types of Cyberattacks - ASG I.T. Consulting.pdf
 
Environmental Impact Of Rotary Screw Compressors
Environmental Impact Of Rotary Screw CompressorsEnvironmental Impact Of Rotary Screw Compressors
Environmental Impact Of Rotary Screw Compressors
 
Introducing the Analogic framework for business planning applications
Introducing the Analogic framework for business planning applicationsIntroducing the Analogic framework for business planning applications
Introducing the Analogic framework for business planning applications
 
20220816-EthicsGrade_Scorecard-JP_Morgan_Chase-Q2-63_57.pdf
20220816-EthicsGrade_Scorecard-JP_Morgan_Chase-Q2-63_57.pdf20220816-EthicsGrade_Scorecard-JP_Morgan_Chase-Q2-63_57.pdf
20220816-EthicsGrade_Scorecard-JP_Morgan_Chase-Q2-63_57.pdf
 
business environment micro environment macro environment.pptx
business environment micro environment macro environment.pptxbusiness environment micro environment macro environment.pptx
business environment micro environment macro environment.pptx
 
20200128 Ethical by Design - Whitepaper.pdf
20200128 Ethical by Design - Whitepaper.pdf20200128 Ethical by Design - Whitepaper.pdf
20200128 Ethical by Design - Whitepaper.pdf
 

The new new great game

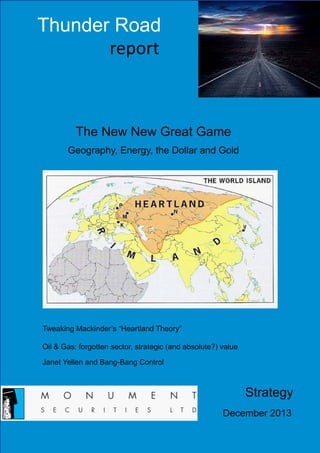
  • 1. Thunder Road report The New New Great Game Geography, Energy, the Dollar and Gold Tweaking Mackinder’s “Heartland Theory” Oil & Gas: forgotten sector, strategic (and absolute?) value Janet Yellen and Bang-Bang Control Strategy December 2013
  • 2. The New New Great Game Geography, Energy, the Dollar and Gold Page Thought for the report The footsteps of giants 4 The New New Great Game Mackinder’s “Heartland Theory” 5 Tweaking the Heartland Theory 9 Geographic 9 Monetary 11 Three Other Factors in the NNGG 11 Current Developments in the NNGG 13 Oil & Gas stocks 16 The Dollar and Gold 18 A Fed-centric Market - who is John Galt? 27 The Yellen-effect 34 Janet Yellen and Bang-Bang Control Research: Paul Mylchreest +44 7190 7242 pmylchreest@monumentsecurities.com This is a marketing communication. It has not been prepared under the Independent Investment research regulatory requirements and accordingly there is no prohibition on dealing ahead of the dissemination of this research material. Front cover source: Color Revolutions and Geopolitics
  • 3. The New New Great Game Geography, Energy, the Dollar and Gold Sir Halford Mackinder’s 1904 speach in which he outlined his “Heartland Theory” was a founding moment for geo-politics. He argued that control of the Eurasian landmass (Europe, Asia and the Middle East), which contained the bulk of the world’s population and natural resources, was the major geo-political prize. As time passed, energy (first crude oil then natural gas), became increasingly integral to this concept and its strategic significance cannot be overstated. Remarkably, Mackinder’s theory has remained equally valid, if not more so, in the modern era - although key “pivot areas” for exercising control have evolved. In addition to Central Asia and Trans-Caucasus in Mackinder’s day, the oil producing nations of the Middle East took on increasing importance in the “New Great Game”. The geo-political confrontation between the US on one hand and China (in increasingly close cooperation with Russia) on the other, is evolving rapidly. We see a “New New Great Game” (NNGG) emerging and have “tweaked” the Heartland Theory to include. • An additional geographic “pivot”, the South and East China Seas, due to their importance in terms of world trade, oil and gas reserves and numerous territorial claims. • A monetary “pivot”, the dollar-based system of world trade and its reserve status. China is taking the lead role in pushing ahead with its strategy of dismantling the dollar’s supremacy. Geo-political tension in each of the pivot areas is escalating. For example Central Asia and Trans-Caucasus (Ukraine), Middle East (Iran) and South and East China Seas (Senkaku Islands). The rising powers, China and Russia, are adopting more aggressive geo-political tactics towards US/EU/NATO/Japanese interests. The more “dovish” US policy towards Iran, following the recent nuclear deal, is threatening to destabilise the decades-long status quo in diplomatic relations with Israel and Saudi Arabia. Just about every aspect of the escalating geo-political tension has an energy element, either directly or indirectly. Viewed from a “Mackinderian” perspective, the strategic value of the energy sector is immense. It begs the question whether, after five years of underperformance, the equity market is under-pricing energy assets, including those deeply out-of-favour integrated oil and gas stocks? Probably, in our view. We believe that the significance of the monetary pivot in the NNGG is under-estimated as China accelerates preparations to undermine the dollar’s role in world trade. The other aspect of China’s strategy is its diversification into “hard assets” and, as far as we can tell, China is attempting to “corner” the market for physical gold. Its strategic significance is lost on most Western investors. We present some insights into today’s gold market which might shock Western investors - similarities with the run-up to the major lows in the gold price more than a decade ago - and China’s understanding of modern gold market mechanics. The threats to the existing US-centric order are substantial and the geo-political sands are shifting. The US will respond and has the largest economy and military (with vast ocean-going naval advantage), most powerful investment banks and deepest financial markets and significant (albeit declining) political/diplomatic influence. In terms of boxing metaphors, we wonder whether the Ali versus Foreman fight in Kinshasa in 1974 (knockout in the eighth) or the Leonard versus Hagler fight at Caesar’s Palace in 1987 (points victory where the argument as to who actually won continues) will be the parallel. December 2013 3
  • 4. Thought for the report: the footsteps of giants From an anonymous source prior to the major lows in the gold price more than a decade ago. “Someone once said, ‘no one wants gold, that’s why the US$ price keeps falling.’ Many thinking ones laugh at such foolish chatter. They know that the price of gold is dropping precisely because ‘too many people are buying it’! Think now, if you are a person of ‘great worth’ is it not better for you to acquire gold over years, at better prices? If you are one of ‘small worth’, can you not follow in the footsteps of giants? The real money is selling ALL FORMS of paper gold and buying physical! Why? Because any form of paper gold is losing value much, much faster than metal. Some paper will disappear all together in a fire of epic proportions! The massive trading continues at LBMA, but something is now missing...We have reached production costs...The great mistake by the BIS was in underestimating the Asians. Some big traders said they would buy it all below $365+/- and they did. That’s what forced LBMA to go on a spree of paper selling! Now, it’s a mess.” Interesting? The gold price is approaching production cost again. We have the physical versus paper demarcation again (most commentators are clueless on this - the paper market is still determining the screen price, but it will probably die once and for all this time around – the question is at what level?). The Asians are being underestimated again when the price is declining (although not by the BIS - China is buying physical gold in unprecedented volumes – at least 70-75% of world mining production this year). Gold: China's cumulative net imports through Hong Kong (tonnes) 2100 1900 1700 1300 1100 900 700 500 300 100 But accelerating developments in the monetary sphere is only one element of... December 2013 4 2013 2012 2011 2010 2009 2008 2007 -100 Source: Hong Kong Census & Statistics Dept. 1500
  • 5. The “New New Great Game” Mackinder’s “Heartland Theory” The traditional “Great Game” obviously dates back to the geo-political rivalry between Great Britain and Russia for supremacy in the central Asian region during the nineteenth and early part of the last century. In his famous speech, “The Geographical Pivot of History”, to the Royal Geographical Society in 1904, Sir Halford Mackinder outlined his “Heartland Theory. ” According to Wikipedia. “This is often considered a, if not the, founding moment of geo-politics...” Briefly, this posited that the major geo-political prize is Eurasia (the “World Island”), i.e. the European, Asian and Middle Eastern land mass, which contained the bulk of the world’s population and its natural resources. Mackinder argued that control of the “pivot area“ of central Asia was the key to controlling Eurasia. This is taken from his paper published in the April 1904 edition of the “The Geographical Journal.” Source: The Geographical Journal He also emphasised the important difference between sea power and land power. From Zurich-based ISN’s 2009 “Geopolitics and US Middle Eastern Policy: Mackinder and Brzezinski.” “Mackinder’s theory was a counter-argument to notions that maritime supremacy was sufficient for a power such as Great Britain to safeguard its hegemony. He claimed that, with the emergence of new transportation routes [e.g. Trans-Siberian railway] and technology, a power that could control the centre (and the abundant resources) of the Eurasian landmass...would ultimately be able to attack the colonies of a sea power everywhere on the continent. “ December 2013 5
  • 6. The Trans-Siberian Railway. Source: NPR In the wake of World War One, Mackinder argued the case for preventing a convergence of interests between Russia and new “pivot” states of Eastern Europe (Austria, Hungary, Czechoslovakia and Poland). This led to his famous dictum. “Who rules East Europe commands the Heartland; Who rules the Heartland commands the World Island; Who rules the World Island commands the World.” It’s important to emphasise that the pivot area does evolve/fluctuate with changes in geo-political reality. Indeed, Mackinder included the Baltic states in one of his revisions. As the world industrialised and became increasingly dependent on crude oil (and later, natural gas), energy resources became ever more integral to the Great Game. With such a large proportion of the world’s oil and gas reserves found on the Eurasian land mass, this was easily accommodated within Mackinder’s theory. The period just before World War One, with the British Navy’s switch from coal to oil and the adoption of the automobile, set the stage for this. Indeed, in 1913, the British government acquired a 51% controlling interest in the Anglo-Persian Oil Company, the forerunner of BP. Remarkably, the validity of Mackinder’s theory has stood the test of time, even though most people are unfamiliar with it. The following quote is from the Reagan Administration’s “National Security Strategy of the United States” published in January 1988. “The first historical dimension of our strategy is relatively simple, clear-cut, and immensely sensible. It is the conviction that the United States’ most basic national security interests would be endangered if a hostile state or group of states were to dominate the Eurasian land mass – that area of the globe often referred to as the world’s heartland.” Right now, it’s obvious that US national security interests are threatened by a combination of China and Russia. December 2013 6
  • 7. This was the influential globalist (and former National Security Advisor), Zbigniew Brzezinski, writing in his famous 1997 book, “The Grand Chessboard.” “Ever since the continents started interacting politically some 500 years ago, Eurasia has been the centre of world power… For America, the chief geopolitical prize is Eurasia – and America’s global primacy is directly dependent on how long and how effectively its preponderance on the Eurasian continent is sustained.” In the “New Great Game”, (NGG) of the modern era, the major rivalry is between US/NATO on one side and China, Russia, other members of the Shanghai Cooperation Organisation and the likes of Iran, on the other. Source: Stratfor The “pivot states” in the NGG are. • The key nations in Central Asia and the Trans-Caucasus: especially those with substantial energy resources and/or pipelines (e.g. Azerbaijan, Ukraine, Turkmenistan, Uzbekistan etc). Here is a chart showing the major gas pipelines. Source: IEA December 2013 7
  • 8. And the major oil pipelines: Source: IEA • The major OPEC nations of the Middle East: here we borrow part of US geo-strategist, Nicholas Spykman’s, “Rimland” theory. Spykman, the “godfather of containment” was both a disciple and critic of Mackinder. He believed that the “Rimland”, European coast, Arabian-Middle Eastern desert and Asiatic Monsoon region was more important for controlling the Heartland. Source: Britannica.com This was Brzezinksi on the Central Asian Republics, or “Eurasian Balkans” as he terms them in his book. This was in 1997, when China’s economic and military might was still a distant prospect. “They are of importance from the standpoint of security and historical ambitions to at least three of their most important and more powerful neighbours, namely Russia, Turkey and Iran, with China also signalling an increasing political interest in the region. But the Eurasian Balkans are infinitely more important as a potential economic prize; an enormous concentration of natural gas and oil reserves is located in the region, in addition to important minerals including gold.” December 2013 8
  • 9. It’s a reminder of the strategic importance of energy and gold and puts the US-supported “Color revolutions” into sharper focus - Ukraine (Orange, 2004), Georgia (Rose, 2003) and Kyrgyzstan (Tulip, 2005). Tweaking the Heartland Theory We agree with the modern interpretation of the NGG, but we see TWO additional elements which make the current situation a “New New Great Game.” 1. Geographic The South China Sea and the East China Sea (home of the Senkaku Islands) have growing strategic significance due to their importance in terms of: • World trade – the South China Sea, for example, is the world’s second busiest sea lane. • Significant oil and gas reserves; and • Numerous territorial claims over islands, waters and airspace. Source: Wall Street Journal In the context of Mackinder’s Heartland Theory, this is becoming a second Eurasian “pivot area” in our opinion, even if it’s just off the coast. It is the logical result of the rise of Chinese and pan-Asian economic power. An interesting anecdote in this regard concerned comments from the retiring commander of the US Pacific Fleet, Admiral Patrick Walsh, in January 2012. Walsh, a proponent of Mackinder’s theory, recommended that the US regional focus should be the South China Sea. “In the Pacific Century, sea power resumes its traditional role in the sea-lines of communication... You can identify where (South China Sea) the critical node is...It forces an assessment of whether we are prepared for where this economic juggernaut (China) is going.” Press reports noted that Walsh had discussed his application of Mackinder’s theory with Singapore’s Lee Kuan Yew (the region’s “elder statesman”) and had written a classified paper for the Pentagon on his strategic concept. December 2013 9
  • 10. It’s also important to emphasise the significance of the South China Sea in terms of trade in crude oil and natural gas. From the US Energy Information Administration’s (EIA) website. “Almost a third of global crude oil and over half of global LNG trade passes through the South China Sea, making it one of the most important trade routes in the world...Approximately 14 million barrels of crude oil pass through the South China Sea and Gulf of Thailand per day, or almost a third of global oil movement, according to data from Lloyd’s List Intelligence tankertracking service and GTIS Global Trade Atlas. Over 90 percent of the total flow comes from the Strait of Malacca, while the rest comes from intra-Southeast Asia regional trade...” This EIA chart shows the flows from 2011. Source: EIA The EIA again. “EIA estimates that around 6 trillion cubic feet (Tcf) of liquefied natural gas (LNG), or over half of global LNG trade, passed through the South China Sea in 2011, using data from PFC Energy and Cedigaz...Following the Fukushima crisis, Japan increased its LNG imports. In the first half of 2012, the South China Sea area accounted for about 58 percent of global LNG trade, according to data from PFC Energy.” Source: EIA December 2013 10
  • 11. 2. Monetary In “Mackinderian” sense, we believe that the dollar-based currency system has become a “pivot area” on an economic plane. China is taking the lead role in dismantling the dollar’s supremacy in terms of world trade and reserve currency status. The mirror image of this strategy, the internationalisation of the Yuan, is evolving in parallel. Given the “petro-“ foundation of the US dollar’s post-Bretton Woods dominance, energy deals transacted in local currencies and the pricing of exchange traded oil and gas contracts in currencies other than US dollars have added significance. In the monetary sphere, the other aspect of this monetary “pivot” is China’s diversification into “hard” assets. At the cutting edge of this process is the aggressive accumulation of gold reserves at both the state and private (encouraged by the state) levels. The monetary element of the NNGG is being significantly under-estimated. • The last time the baton was passed in terms of the world’s reserve currency, it was done in an ostensibly benign fashion – from one ally to another – and in the wake of devastating global conflict. It wasn’t an issue in Mackinder’s day, nor was it an issue during the Cold War; and • Another reason might be that the majority of people tend to remain wedded to the belief in the status quo, even as the ground shifts beneath their feet. Three other factors in the NNGG We would be remiss if we didn’t mention three other factors which are caught up in the mix of this NNGG. The first is diplomatic and the threat to US/NATO from the deepening relationship between China and Russia. Shanghai Cooperation Organisaton aside, the Chinese state-owned news agency Xinhua reported on 22 October 2013 that Sino-Russian relations stand at an “unprecedented height.” This was during a two-day official visit to China by President Medvedev. Remember the Reagan era’s security document warning about the danger if “a hostile state or group of states were to dominate the Eurasian land mass.” In this regard, the prospect of rapidly growing trade links, especially with regard to energy, is very significant. In October 2013, Rosneft signed a deal to supply China with an additional 200,000 bpd of crude (worth US$85bn over 10 years). This will take Rosneft’s planned trade with China to about 900,000 bpd. Gazprom is in the final stages of negotiating the long-awaited contract to supply 38 bcm per year of gas to China by pipeline. The two countries have targeted US$100bn of bilateral trade in 2015, doubling to US$200bn by 2020. Secondly, the extent of NSA surveillance of foreign nations and their leaders has the potential to open up another front, the internet, albeit for “soft” conflict. It is already having an impact in the BRICS nations visa-vis the US. For example, we are seeing Brazil’s push for a less US-centric internet and the recent decline in Cisco’s China sales. December 2013 11
  • 12. Source: Simon Hunt The third factor is religious - the growing friction between the Sunni and Shia branches of Islam in the Middle East and North Africa. Source: US State Dept. Despite a complacent consensus, it strikes us that tensions in this “New New Great Game” (NNGG) – both geographic and monetary - are escalating in a potentially alarming fashion. This has potential significance for assets which are either central to, or might get caught up, in this theme. Examples include. • Oil and natural gas; • US Treasuries; • Gold; • Defence stocks; and • US and Asian networking stocks. December 2013 12
  • 13. Current developments in the NNGG Looking at the current situation, let’s begin with the China Seas. In a July 2010 speech, Hilary Clinton highlighted US interest in the freedom of navigation of the South China Sea and the peaceful settlement of territorial disputes. This was seen as the start of US re-engagement in the region and is understood to have angered the Chinese. It was followed by the well-publicised “strategic pivot”, or rebalancing, of foreign policy and military strength towards the Asia-Pacific region by the Obama Administration. There’s that “pivot” word again. “We have long been writing about the leadership’s increasingly assertive foreign policy. China considers the countries bordering on the China Seas as its sphere of influence, not that of the USA. We have heard from people involved in inter-government discussions that China is making it very clear that sides should be taken: choose either China or the USA.” Simon Hunt (Simon Hunt Strategic Services), the best China analyst in our view Coming right up-to-date, immediately after China had published the coordinates of its new East China Sea Air Defence Identification Zone on 23 November 2012, US bombers (flying over the Senkaku Islands) and Japanese airliners refused to properly identify themselves in accordance with Chinese demands. US Defense Secretary, Chuck Hagel, not only accused the Chinese of destabilising the region, but reiterated that the mutual defence treaty with Japan applied to the Senkaku Islands. This prompted Ambrose Evans-Pritchard of the Daily Telegraph to comment: “Asia is on the cusp of a full-blown arms race. The escalating clash between China and almost all of its neighbours in the Pacific has reached a threshold. All other economic issues at this point are becoming secondary. Beijing’s implicit threat to shoot down any aircraft that fails to adhere to its new air control zone in the East China Sea is a watershed moment for the world.” In the last few days, South Korea has extended its air defence identification zone, including the potential inflammatory element of overlapping it with Chinese and Japanese zones. Back in the more traditional territory of the Great Game, the Ukraine’s apparent shift towards Russia by putting the EU deal on “ice” appears to be another geopolitical coup for Vladamir Putin. Ukraine’s President, Viktor Yanukovych, buckled under economic “strong arming”, but might reconsider after US threats and riots. Then there are the sensitive issues of Syria and Iran, which have seemingly damaged US relations with its two principal and (very) longstanding allies in the region, Israel and Saudi Arabia. A rift in US-Saudi relations opened up when the US backed down from a military strike on Syria. This was a CBS article from 23 October 2013. “Saudi Arabia is reportedly threatening to scale back its decades-old partnership with Washington over the Obama Administration’s perceived weakness in dealing with Syrian leader Bashar alAssad, and its recent furtive overtures with the Saudis’ arch-enemy, Iran.” Bashar al-Assad belongs to the Alawite Shia minority, with close links to Iran and Hezbollah, while Saudi Arabia backed the mainly Sunni rebels. The Saudis are increasingly fearful of the “Shia crescent” consisting of Iran, Iraq, Syria and Hezbollah. December 2013 13
  • 14. Source: Center for Strategic Studies This was followed by Saudi Arabia’s rejection of a (prestigious) seat on the UN Security Council on 12 November 2013, widely viewed as expressing its frustration with the US/UN over Syria. With regard to Iran, we were VERY surprised by the extent of US concessions in the Geneva interim agreement regarding the nuclear programme. It’s hard to describe US policy towards Iran since George W. Bush’s “Axis of Evil” speech in 2002 as anything less than hawkish. “This is like Wile E. Coyote suddenly signing a peace deal with the Road Runner.” Marin Katusa, Casey Research There has been criticism of the deal from both sides of the political divide in Washington and Congress had been preparing legislation for even stricter economic sanctions. Why the apparent climb down by the US? And what happened to the normally “all-powerful” Israel lobby? Netanyahu memorably described the deal as a “historic mistake” and pledged to stop Iran developing nuclear weapons. “Today the world has become a much more dangerous place because the most dangerous regime in the world has taken a significant step toward attaining the most dangerous weapon in the world… Israel is not bound by this agreement. The Iranian regime is committed to the destruction of Israel and Israel has the right and the obligation to defend itself, by itself, against any threat. As prime minister of Israel, I would like to make it clear: Israel will not allow Iran to develop a military nuclear capability.” There had to be something even more important in this deal for the US that was worth risking damage to its relationships with Israel...and Saudi Arabia. The only conclusions we can reach are that either Israel or Saudi Arabia have a freer hand to deal with Iran themselves, or the US had its arm twisted. What could be even more important to US interests? The dollar comes to mind as we speculate below. December 2013 14
  • 15. Following the Geneva agreement, a senior advisor to the Saudi royal family went well beyond the cautious official statement, accusing western nations of deceit in reaching the deal with Iran. The Daily Telegraph reported on 25 November 2013. “Nawaf Obaid told a think tank meeting in London that Saudi Arabia was determined to pursue its own foreign and policy goals. Having in the past been reactive to events, the leading Sunni Muslim nation was determined to be pro-active in future. Mr Obaid said that while Saudi Arabia knew that the US was talking directly to Iran through a channel in the Gulf state of Oman, Washington had not directly briefed its ally. ‘We were lied to, things were hidden from us,’ he said. ‘The problem is not with the deal struck in Geneva but how it was done.” The same newspaper reported the view of my friend the oil analyst (and former editor of Petroleum Review), Chris Skrebowski. “the great unknown is how Saudi Arabia will react to a move deemed treachery in Riyadh, already exposed in a WikiLeaks diplomatic cable exhorting the US to ‘cut off the head of the snake’ in Iran. Tehran’s diplomatic triumph may embolden Saudi Arabia’s aggrieved Shia minority to press demands, perhaps even threatening the main Saudi oilfields in the Eastern province where they dominate. ‘The Saudis are very angry. The great question is whether they can live with this deal, or whether it is intolerable,’ he said. Mr Skrebowski said the Middle East is a tinder box, in the grip of a Sunni-Shia civil war comparable in ideological ferocity to the clash between Catholics and Protestants in early 17th Century Europe. Saudi Arabia has already shown how far it will go to protect its interests, helping to overthrow Egypt’s Musilm Brotherhood.” New convergences of national interests are forming. “For the first time, Saudi Arabian interests and Israel are almost parallel. It’s incredible.” Saudi Arabian Prince Alwaleed bin Talal Prince Alwaleed also implied that a military option to neutralise Iran’s nuclear programme might be preferable to the Geneva deal. Nor did he rule out Saudi Arabia adopting nuclear weapons, highlighting its close relationship with Pakistan. Meanwhile, Iran is moving quickly to strengthen relationships with its neighbours and Eurasian superpowers. Here are several examples of Iranian diplomatic efforts since the Geneva agreement. • Iran’s Majlis Speaker, Ali Larijani, met with Chinese President Xi Jinping in Beijing on 30 October 2013. • Iraq’s Prime Minister made a 3-day visit to Iran on 4 December 2013. This followed visits by the Syrian Prime Minister, Wael al-Halqi, the week before. Such meetings could heighten the fears of those who worry about a “Shia arc.” • Iran’s Foreign Minister, Mohammed-Javad Zarif, visited leaders of several members of the Gulf Cooperation Council, including Oman, Kuwait, Qatar and Dubai. • Russian Foreign Minister, Sergei Lavrov, visited Iran on 11 December 2013. As we were writing this report, we came across an article “The Great Game accelerates...” by Alasdair Macleod (Finance and Economics website) from 9 December 2013. He had an interesting slant on what’s taking place with regard to several of the same issues. December 2013 15
  • 16. “If we stand back to get an overall impression of how this jigsaw fits together, the guiding hand of China can be imagined throughout...China’s interest in absorbing the Middle East into her sphere of influence is obvious, given her current and future energy requirements; but she will also want to tap into the enormous wealth in the region. Her link into it is through Iran, an SCO Observer State, to which she provided covert support during the Ahmadinejad years. One can only speculate about the degree of Chinese influence behind Iranian political developments, with Iran now aligning herself with China’s view that trade matters more than belligerence with her perceived enemies.” So where do we stand? A few observations. • Geo-political risk has risen substantially in ALL of the “pivot areas” of the NNGG, Middle East, Central Asia/Transcaucasus and the South/East China Seas. • The rising powers, China and Russia, are adopting more aggressive geo-political tactics towards, US/EU/NATO/Japanese interests and Iran has greater political and economic flexibility. Concurrently, Japan is rediscovering its long-forgotten nationalistic and militaristic roots. • In the Middle East, whatever is driving US policy is destabilising the status quo in diplomatic relations which has been in place for decades. We could be in the early stages of a tectonic shift. • Each development discussed is having an ADDITIVE EFFECT ON THE GEO-POLITICAL CONFRONTATION BETWEEN THE US ON ONE SIDE AND CHINA/RUSSIA ON THE OTHER. • Furthermore, just about every aspect of what’s happening has an ENERGY ASPECT TO IT, EITHER DIRECTLY OR INDIRECTLY. Oil & Gas stocks In light of all this, it begs the question: is the equity market under-pricing energy assets, including those big, ugly integrated oil and gas companies? Probably, in our view. The consensus for long-term oil prices used in analysts’ forecasts is US$90-95/bbl, which we think will ultimately be on the low side. Short term, crude oil looks like it’s approaching a significant move. The question is which way? Crude oil: Brent (US$/bbl) 130 125 120 Source: Bloomberg, Monument Securities. 115 110 105 100 95 90 85 16 Dec-13 Oct-13 Nov-13 Sep-13 Jul-13 Aug-13 Jun-13 Apr-13 May-13 Mar-13 Jan-13 Feb-13 Dec-12 Oct-12 Nov-12 Sep-12 Jul-13 Aug-12 Jun-13 Apr-13 May-13 Mar-13 Jan-13 Feb-13 Dec-12 Oct-12 Nov-12 Sep-12 Jul-13 Aug-12 Jun-13 Apr-13 May-13 Mar-13 Jan-13 December 2013 Feb-13 80
  • 17. It’s difficult to say, although our suspicion is upwards. On the announcement of the Iran nuclear deal last month, the initial US$3/bbl decline in the price was reversed almost immediately. Downside is probably limited by high marginal costs in some unconventional sources and, looking at the trend in Saudi production, some flexibility for cutbacks if they were necessary. A cursory look at the price relatives of the US and UK integrated oils shows what dire investments they’ve been in the last five years. US and UK Big Cap. Oil & Gas stocks price relative 0.50 3.60 0.48 3.40 0.46 3.00 0.42 2.80 0.40 0.38 2.60 0.36 2.40 0.34 2.20 0.32 2.00 Jan-09 Feb-09 Mar09 Apr-09 May-09 Jun-09 Jul-09 Sep-09 Oct-09 Nov-09 Dec-09 Jan-10 Feb-10 Apr-10 May-10 Jun10 Jul-10 Aug-10 Sep-10 Oct-10 Dec-10 Jan-11 Feb-11 Mar-11 Apr-11 May-11 Jul-11 Aug-11 Sep-11 Oct-11 Nov-11 Dec-11 Jan-12 Mar-12 Apr-12 May-12 Jun-12 Jul-12 Aug-12 Sep-12 Nov-12 Dec-12 Jan-13 Feb-13 Mar-13 Apr-13 May-13 Jul-13 Aug-13 Sep-13 Oct-13 Nov-13 0.30 S&P 500 Integrated Oil & Gas price relative Source: Bloomberg, Monument Securities. 3.20 0.44 FTSE Oil & Gas Producers price relative Looking at my Bloomberg page on US equities, I have 53 S&P 500 sectors and subsectors in a column on the left hand side. Being very simplistic, Bloomberg estimates the P/E for the S&P 500 Integrated Oil & Gas sector at 12.2x – trailing 12 months as far as I can tell. The only sector/subsector with a lower PE is Banks on 12.1x! The UK Oil & Gas Producers subsector is only 8.8x, dragged down by the truly unloved heavyweights, Royal Dutch Shell and BP. So a valuation case might be developing and it was interesting that Warren Buffett bought more than US$3.0bn worth of ExxonMobil recently. In the UK/Europe, many of the large integrated oil stocks have been a source of funding for more successful trades this year. If this is close to running its course, it would not take much for a sharp bounce. One company which we are keeping a close eye on is Royal Dutch Shell (RDS). When it comes to unloved stocks, it is right up there. In light of the ConocoPhillips spin of Phillips 66, one could argue that RDS has been two (or three or four even!) of the worst managed FTSE 100 companies in recent years. A company in desperate need of an activist shareholder? We were chatting to one of London’s biggest PM’s (in AUM terms) several weeks ago. Not only does he not hold the share, but the last time RDS executives had visited his company, he hadn’t felt that it was worth attending the meeting. Things are really bad! But we do have an incoming CEO, Ben van Beurden, who assumes his new role on 1 January 2014. This offers the potential for change, although van Beurden is an “RDS-lifer” from its downstream business. December 2013 17
  • 18. Unless van Beurden has been living under a rock for the last 12 months, he can’t have failed to notice the improvement in the investors’ perception of Rio Tinto since Sam Walsh took over. Walsh had been with Rio for 22 years when he was appointed CEO in January this year and had been a key member of the company’s senior management during the previous regime. This didn’t stop him grasping the need for a smaller and more efficient capital investment programme. Van Beurden has an opportunity. The shares have been “dead money” for three years while the equity markets have roared ahead Royal Dutch Shell A share price (p) 2500 2400 Source: Bloomberg, Monument Securities. 2300 2200 2100 2000 1900 Dec-13 Oct-13 Nov-13 Sep-13 Jul-13 Aug-13 Jun-13 Apr-13 May-13 Mar-13 Jan-13 Feb-13 Dec-12 Oct-12 Nov-12 Sep-12 Jul-12 Aug-12 Jun-12 Apr-12 May-12 Mar-12 Jan-12 Feb-12 Dec-11 Oct-11 Nov-11 Sep-11 Jul-11 Aug-11 Jun-11 Apr-11 May-11 Mar-11 Jan-11 Feb-11 1800 Meanwhile, oil and gas exposure fits our long-term investment strategy. Besides gold and silver, we believe that portfolios should be progressively aligned with essential goods and services as we expect that these expenditures will account for a growing share of the “economic pie” as consumers face increasing headwinds (including inflation in due course). In thematic terms, our preferred sectors are: • Food/agriculture • Energy • Personal & Household care • Healthcare • Mobile telephony & networking; and • Defence (for governments). The Dollar and Gold Now let’s move into the monetary arena of the “New New Great Game”. Because of the longevity of the current post-Bretton Woods system and its blatant structural flaws ( and ”exorbitant privilege” provided to the US to quote De Gaulle), we believe that it is becoming AS IMPORTANT as the geo-strategic element. Most people just haven’t realized yet. Reflecting on Washington’s sudden “dovishness” towards Iran, we had some sympathy with this view from Casey Research’s, Marin Katusa. December 2013 18
  • 19. “The Americans also got something great from the discussions: the continuation of the petrodollar. With a détente around the corner, America can monitor Iran’s activities and quietly make sure that the sale of this oil will be denominated in US dollars. The fact that Iran has constantly tried to shift away from the US dollar for petroleum trades has always been a thorn in the side of the US government. By ‘working closer’ with Iran, America will in fact be able to better keep tabs.” Maybe. Let’s consider recent developments in the monetary element of the NNGG, because they are coming thick and fast now. A good place to begin is the March 2012 meeting of the BRICS nations, which saw them sign the “Master Agreement on Extending Credit Facility in Local Currency. ” This made it their POLICY to increase trade in local currency. This process is beginning to speed up. China is driving this process and now conducts 17% of its foreign trade in Yuan compared to almost zero in 2010. It has set up 23 (at the last count) currency swap agreements with major trading partners (including the EU) and 60% of global GDP in all, to facilitate this process. We also had the recent news that the Yuan is now the second most-used currency in trade finance, supplanting the Euro. According to SWIFT, the Chinese currency had a market share of 8.66% in October 2013 compared with 6.44% for the Euro. This share looks set to grow rapidly. The FT reported on 2 December 2013 that companies can now clear Yuan-denominated transactions in London. “UK-based Standard Chartered and Agricultural Bank of China have signed an agreement to start renminbi clearing services in the UK for the first time, in a deal announced to coincide with the visit of David Cameron, prime minister, to Beijing. London is becoming the main city outside of Asia for trading and transacting in the Chinese currency.” A major pillar of the dollar’s dominance in world trade is pricing oil. China surpassed the US as the world’s largest oil importer in September this year. So, a potentially significant development was the comment from the Chairman of the Shanghai Futures Exchange that preparatory work for a crude oil futures contract priced in Yuan is being accelerated. This was from a Reuters report on 21 November 2013. “China is the only country in the world that is a major crude producer, consumer and a big importer. It has all the necessary conditions to establish a successful crude oil futures contract,’ Yang Maijun, SHFE chairman, said at an industry conference.” And Tyler Durden at Zero Hedge. “In doing so China is effectively lobbing the first shot across the bow of the Petrodollar system, and more importantly, the key support of the USD in the international arena. This would be in keeping with China’s strategy to import about 100 tons of gross gold each and every month, in addition to however much gold it produces internally, in what many have also seen as a preparation for a gold-backed currency, which however would require a far broader acceptance of the renminbi in the international arena and most importantly, its intermediation in a crude pricing loop. It is precisely the latter that China is starting to focus on.” December 2013 19
  • 20. Oil and gold again. Given all of the above, it’s fairly obvious that China is moving ahead with its plan to dismantle the dollar’s dominance in world trade and internationalise the Yuan. However, it would hasten this process if the Chinese make good on recent comments from the PBOC. This was a Bloomberg report on 21 November 2013. “It’s no longer in China’s favor to accumulate foreign-exchange reserves,’ Yi Gang, a deputy governor at the central bank, said in a speech organized by China Economists 50 Forum at Tsinghua University yesterday. The monetary authority will ‘basically’ end normal intervention in the currency market and broaden the yuan’s daily trading range, Governor Zhou Xiaochuan wrote in an article in a guidebook explaining reforms outlined last week following a Communist Party meeting. Neither Yi nor Zhou gave a timeframe for any changes.” This would be a MASSIVE development. Confrontation in the monetary sphere between the US and China has been building for many years Both sides seem to be preparing for just such a scenario. In his book “Currency Wars”, James Rickards recounts participating in the first Pentagon-sponsored “financial war game”, at the Applied Weapons Laboratory, outside Washington in 2009. In an interview with Max Keiser he commented. “There was a Russia team, a China team, a United States team and then we had Europe, Switzerland, hedge funds...I was on the China team...My object, in order to help the United States, was to attack the United States as hard as we could in order to teach our own intelligence community what the threats were...I actually cooked up a little plot with a friend of mine who was on the Russia team and China and Russia combined forces and combined their gold and announced a new gold-backed currency using UK banks and Swiss depositories. And what they said was, from now on, if you want Chinese exports or Russian natural resources, we will no longer accept dollars, you must pay us in this new gold-backed currency.” It seems that China is not sitting back either. For example, this was Zheng Gang, the CEO of Keen Risk Solution Co. and consultant member of the Chinese Competitive Intelligence Association. “Before actual combat over land, sea and air, an enemy nation that possesses offensive capabilities in finance can disrupt China’s economic stability, thereby striking before a physical war, subduing us without a fight. The strategic ‘Game’ to preserve the USD’s global status is now focus of international political and economic activity; the US makes a new kind of non-military offensive against developing and transforming countries derived from her ability to set favorable rules, an ability she possesses through the dollar hegemony.” One of the ultimate anti-dollar elements of the New New Great Game is China’s accumulation of gold at both state and private level. Whatever way you cut the analysis, it seems that China’s annual gold consumption is running at about 2,000 tonnes, possibly more. This is a HUGE 70-75% of estimated 2013 world mine production. The much discussed Chinese net imports through Hong Kong amount to just over 980 tonnes this year through October. This is an increase of 160% versus the first 10 months of 2012. The October figure of 130 tonnes was the second largest ever. December 2013 20
  • 21. China: Gold net imports through Hong Kong (tonnes) 160 140 100 80 60 40 20 0 Jan Feb Mar Apr May Jun 2012 Jul Aug Sep Oct Nov Dec Source: Hong Kong Census & Statistics Dept. 120 2013 So we should see more than 1,200 tonnes in 2013 as a whole. Then we have to add in domestic mine production, hardly any of which leaves Chinese shores. This will be about 430 tonnes in 2013. It’s no surprise, nor coincidence, that China has ramped up gold supply dramatically. Source: SRSrocco. So Hong Kong imports plus domestic mine production total about 1,600 tonnes. This is just one point of entry for gold into China and note this comment from Koos Jansen from the “In Gold We Trust” website (which has the best analysis of Chinese gold demand). “There is also gold going into China through other ports that is not reported. I know this from the biggest transport company that ships gold from Switzerland to China.” Including imports through Shanghai and other points of entry and we are probably getting close to 2000 tonnes. The other way of looking at it is from physical deliveries on the Shanghai Gold Exchange (SGE). The diligent Mr Jansen keeps close tabs on this - and produces great charts comparing SGE deliveries with world mining output ex-China (see below). From his conversations with the SGE, Jansen discovered an unusual aspect of what constitutes “delivery” on this exchange – it is metal that has been withdrawn from the vault and none of these bars are permitted to come back in. As he says. December 2013 21
  • 22. “mine and import supply in China are required to be sold over the SGE. The result is that the gold that leaves the SGE vaults reflects total supply, and thus demand.” Through the first 47 weeks of 2013, SGE deliveries amounted to 1,928 tonnes. Source: Koos Jansen. So, using this methodology, the annualised rate is slightly more than 2,000 tonnes. How much of the roughly 2,000 tonne annualised demand is going into official reserves versus private savings is not clear. The Chinese government last reported its official gold reserves at 1,054 tonnes in April 2009. This took the market by surprise as the previous figure had been 600 tonnes in 2003. When the next update comes, it should be in the multiple thousands of tonnes. We’ve been telling people for years that the gold market is far removed from what most people like to think – investors quietly selling LGD 400 oz. bars to each other. Besides the paper to physical ratio (estimated by the Reserve Bank of India at 93:1), all manner of trading shenanigans, the strategic significance of gold to central banks and governments is barely describable. On that note, the quotes about the gold market at the beginning of this report (“Thought for the report: the footsteps of giants”) was sourced from the USAGold website, although it originally appeared on a Kitco forum. Thanks to the former’s Michael Kosares, the “thoughts” (during 1997-2001) from his source(s) can be accessed although you have to “search” for the “gold trail”. Not only did many of the insights prove prophetic in terms of the subsequent evolution of the gold market, but they raised some truly jaw-dropping questions about the world financial system. We stumbled over them in 2006 and were mesmerised. Re-iterating one of the messages from the quote at the beginning of this report, the screen price of gold is being driven by various forms of paper gold including: • The XAU/USD FX cross in huge size with a tiny amount of gold collateral; • Unallocated LBMA gold; • Lease contracts to provide collateral; • COMEX futures; and December 2013 22
  • 23. • OTC derivatives. Let’s consider recent developments in the gold market and compare them with more quotes from the source(s) cited above regarding the situation as we headed into the major price lows more than a decade ago. Look at this chart which compares the monthly gold price with China’s cumulative imports of gold through Hong Kong. Gold price v. China cumulative gold imports from HK 1900 2000 1800 1700 1600 1200 1000 1300 800 600 1100 400 200 900 0 Gold price (Monthly, US$/oz.) 2013 2012 2011 2010 2009 -200 2008 700 Source: Hong Kong Census & Statistics Dept. 1400 1500 China cumulative gold imports from Hong Kong (tonnes) So China, with US$3.66 trn of foreign exchange reserves, ramps up its physical gold purchases and the gold price collapses at exactly the same time. Isn’t this counter-intuitive and worthy of further analysis, especially in light this quote from the source? “People wondered how the physical gold market could be ‘cornered’ when its currency price wasn’t rising and no shortages were showing up...the BIS set up a plan where gold would be slowly brought down to production price. To do this required (name deleted) to take the long side of much leased forward gold deals even as they bid for physical under a falling market.” In 2013, Chinese gold imports have surged, the gold price has obviously crashed and holdings of physical gold in (Western world) ETFs have fallen very sharply. Gold: total known ETF holdings (tonnes) 2800 2400 Source: Bloomberg, Monument Securities. 2000 1600 1200 800 400 December 2013 23 2013 2012 2011 2010 2009 2008 2007 2006 2005 2004 0
  • 24. Then consider this quote. “The Western governments needed to keep the price of gold down so it could flow where they needed it to flow. The key to free up gold was simple. The Western public will not hold an asset that is going nowhere, at least in currency terms (if one can only see value in paper currency terms then one cannot see value at all).” Western investors were completely wrong-footed when the price turned last time. And finally. “The battle now is between the CBs [central banks] trying to keep gold in the $300s and the ‘others’ buying it up...Some people know this, that is why they aren’t trading it, they are buying it.” It’s also clear that the Chinese fully understand the mechanics of the gold market and the determinants of the price. For example, the following is a translation of an article from Zhang Jie of the China Gold Association (basically an arm of the State Council), “Gold Leasing Is A Tool For The Global Credit Game”, published on 15 April 2013. This will probably shock many investors in the West. With thanks to Koos Jansen for the translation. “Gold leasing is an important innovation in the gold settlement system. Through continuous gold leasing the gold in the market can be circulated and produce derivatives, creating more and more paper gold. This is very significant for the United States. Gold leasing is a major tool for the Federal Reserve and other central banks in the West to secretly control and regulate the gold market, creating gold credit derivatives…The purpose of gold leasing is not just to receive a rent, but it also provides the ability to short-sell gold, which allows central banks to interfere in the currency market…If one wants to control gold, it is a necessity to have the ability to short-sell the same. A central bank that directly suppresses gold would be suspected as a market manipulator. However, gold leasing by the central bank can take place unnoticed…For the Fed, it is crucial that the dollar dominates the world and so the Fed will store gold reserves from countries all over the world to control the gold settlement system. If there were another gold settlement system, it would compete with the dollar’s trust. Natural gold credit would be a nightmare for the continuous printed dollar. The dollar can only be the world currency as a result of the United States controlling global gold settlement. However, if other countries want their gold back from the Fed, the Fed will lose its gold settlement position.” The physical gold market prevailed last time and it will prevail again. Current tightness in physical supply is suggested by market indicators. For example, GOFO (gold forward offered rate), which is the interest rate for borrowing dollars using gold as collateral, has moved back into negative territory…just. The market will pay gold holders to borrow dollars. December 2013 24
  • 25. Gold Forward Offered Rate (GOFO %) 0.50 0.40 Source: Bloomberg, Monument Securities. 0.30 0.20 0.10 0.00 -0.10 Dec-13 Nov-13 Oct-13 Sep-13 Aug-13 Jul-13 Jun-13 May-13 Apr-13 Mar-13 Feb-13 Jan-13 Dec-12 Nov-12 Oct-12 Sep-12 Jul-12 Aug-12 -0.20 The gold futures market remains in backwardation, i.e. there is a negative gold basis (spot versus nearmonth future). Traders are turning down a free profit (albeit a small one currently) rather than risk any physical delivery problems in the futures market. See the blue line in negative territory in this chart from Sandeep Jaitly’s excellent “Gold Basis Service.” Source: Gold Basis Service / Sandeep Jaitly Gold should, and almost always has traded in contango, the only other exception was a brief period following the collapse of Lehman. It’s our contention that the demarcation between paper and physical markets is becoming increasingly apparent. As an indication of the strength of physical gold demand, especially coming from China, here is an excerpt from an interview Koos Jansen conducted earlier this month with Alex Stanzyk of Anglo Far-East, a precious metals investment and custodial company. The interview followed Stanczyk’s meeting (along with “Currency Wars” author, Jim Rickards) with the managing director of a major Swiss refiner. December 2013 25
  • 26. “He (the managing director) indicated the price didn’t make sense because he has got so much fabrication demand. They put on three shifts, they’re working 24 hours a day, and originally he thought that would wind down at some point. Well, they’ve been doing it all year. Every time he thinks it’s going to slow down, he gets more orders, more orders, more orders. They have expanded the plant to where it almost doubles their capacity. 70 % of their kilobar fabrication is going to China, at a pace of 10 tons a week. That’s from one refinery, now remember there are 4 of these big ones (refineries) in Switzerland. …At this Swiss refinery there have been several times this year on which they were unable to source gold, this shocked me. They’re bringing in good delivery bars, scrap and dore from the mines, basically all they can get their hands on. This gentleman has been in the business for 37 years, he was there during the last bull market in the late seventies. I asked him when was the last time this happened, that he was unable to source gold, he said never. And I clarified it, I asked: let me make sure if I understand what you’re saying to me, in the last 37 years you’ve worked in the gold industry this has never happened? He said: this has never happened.” The consensus seems to be upbeat on 2014, tapering not withstanding. Indeed, we’ve seen reports about “show time” for growth in developed economies. Hmmm, we are less upbeat and when it comes to the “New New Great Game”, we may only just be getting started. Given all of the threats to the US dollar as we head into 2014, you start wondering whether the Fed’s expressed desire to taper is also about trying to shore up the dollar (as well as addressing collateral shortages in the repo market). US Dollar Index 130 120 Source: Bloomberg, Monument Securities. 110 100 90 80 70 2013 2012 2011 2010 2009 2008 2007 2006 2005 2004 2003 2002 2001 2000 60 We’re also mindful that when the Fed began to float the idea of tapering back in May 2013, the BRICS currencies (albeit excluding the managed Remnimbi) were hammered. Let’s move on to Janet Yellen and monetary policy, via the equity market. December 2013 26
  • 27. Janet Yellen and Bang-Bang Control A Fed-centric market - who is John Galt? “Although he is not identified by name until the last third of the novel, he is the object of its often-repeated question “Who is John Galt?” and of the quest to discover the answer... he (Galt) believes in the power and glory of the human mind, and the right of the individual to use his/her mind solely for him/herself. He serves as a highly individualist counterpoint to the collectivist social and economic structure depicted in the novel, in which society is based on oppressive bureaucratic functionaries” Wikipedia on Ayn Rand’s prophetic novel, Atlas Shrugged The “polar opposite” scenarios for the US equity market highlighted in the last report are still in play. The first was the 1954 pattern. Dow Jones Industrial Average: 1954 v. 2013 410 17250 16750 390 16250 15750 350 15250 14750 330 14250 310 13750 290 13250 1954 31/12/1954 17/12/1954 03/12/1954 19/11/1954 05/11/1954 22/10/1954 08/10/1954 24/09/1954 10/09/1954 27/08/1954 13/08/1954 30/07/1954 16/07/1954 02/07/1954 18/06/1954 04/06/1954 21/05/1954 07/05/1954 23/04/1954 09/04/1954 26/03/1954 12/03/1954 26/02/1954 12/02/1954 29/01/1954 15/01/1954 12750 01/01/1954 270 Source: Bloomberg, Monument Securities. 370 2013 (since 11 Dec 2012) While 1954 was a good year for equities, it was only around the midpoint in a long bull market. The second was the 1928-30 pattern. Dow Jones Industrial Average: 1928-30 v. 2012-13 400 17000 16500 350 16000 300 15000 14500 250 14000 13500 200 13000 12500 Jan 1928 - Apr 1930 December 2013 27 May 2012 - Oct 2013 03/04/1930 03/03/1930 03/02/1930 03/01/1930 03/12/1929 03/11/1929 03/10/1929 03/09/1929 03/08/1929 03/07/1929 03/06/1929 03/05/1929 03/04/1929 03/03/1929 03/02/1929 03/01/1929 03/12/1928 03/11/1928 03/10/1928 03/09/1928 03/08/1928 03/07/1928 03/06/1928 03/05/1928 03/04/1928 03/03/1928 03/02/1928 12000 03/01/1928 150 Source: Bloomberg, Monument Securities. 15500
  • 28. This time around, driving both of these scenarios thus far has been the QE-driven liquidity wave. It remains our contention that there is a degree of DIRECT causation between QE and rising equity prices, i.e. from the collateralisation of QE-created “excess deposits” (reserves) via shadow banking conduits, principally repos. These excess deposits are not as “inert” as most people believe. S&P 500 v. Deposits minus Loans ("deposit to loan gap" in banks from QE) 1800 2400 1600 2000 1400 1600 1200 1200 1000 800 800 400 600 0 Mar09 Apr-09 May-09 Jun-09 Jul-09 Aug-09 Oct-09 Nov-09 Dec-09 Jan-10 Feb-10 Mar-10 Apr-10 Jun10 Jul-10 Aug-10 Sep-10 Oct-10 Nov-10 Dec-10 Feb-11 Mar-11 Apr-11 May-11 Jun-11 Jul-11 Sep-11 Oct-11 Nov-11 Dec-11 Jan-12 Feb-12 Mar-12 May-12 Jun-12 Jul-12 Aug-12 Sep-12 Oct-12 Nov-12 Jan-13 Feb-13 Mar-13 Apr-13 May-13 Jun-13 Aug-13 Sep-13 Oct-13 Nov-13 2800 S&P 500 Source: Bloomberg, Monument Securities. 2000 Deposits - Loans: All Commercial Banks (US$bn) Former hedge fund manager, W. Ben Hunt, writing in his Epsilon Theory newsletter, captured the essence of today’s financial markets. “Marx believed that the greatest theft that capitalism perpetrated on the working class was psychological. The Industrial Revolution and the assembly line crushed a worker’s spirit by eliminating the sense of pride...What traditional value investors like (Jeremy) Grantham are experiencing today is alienation in the traditional Marxist sense. In today’s context it’s not the separation of a worker from the meaning of his labor, but the separation of an investor from the meaning of his investment...it’s just going to be a continuing exercise in frustration so long as we live in a Fed-centric universe.” Since 2011, we’ve had this nagging fear that a modern-day version of Ayn Rand’s “Atlas Shrugged” is unfolding in gradual fashion. This was Saxo Bank’s CIO, Steen Jakobsen, touching on one of its themes recently. “It is time to realize that the reason capitalism won the war against communism in the 1980s was its strong market based economy, itself based on price discovery. Now the policymakers in their wisdom are copying everything a planned economy entails: central planning and control, no price discovery, one supplier of credit and money...” New money (deposits) in the US economy is being created by the Fed’s QE programme instead of new lending. December 2013 28
  • 29. All Commercial Banks: Deposits v. Loans (US$bn) 10000 9000 7000 6000 5000 4000 3000 Deposits: All Commercial Banks Apr-13 Sep-13 Nov-12 Jan-12 Jun-12 Aug-11 Oct-10 Mar-11 May-10 Jul-09 Dec-09 Feb-09 Apr-08 Sep-08 Nov-07 Jan-07 Jun-07 Aug-06 Oct-05 Mar-06 May-05 Jul-04 Dec-04 Feb-04 Apr-03 Sep-03 Nov-02 Jan-02 Jun-02 Aug-01 Oct-00 Mar-01 May-00 Jul-99 Dec-99 Feb-99 Apr-98 Sep-98 Nov-97 Jan-97 Jun-97 2000 Source: Bloomberg, Monument Securities. 8000 Loans & leases: All Commercial Banks Most people don’t “get” this, so what will they think if the QE tap is turned off. We’ll need that mid-cycle pickup in GDP growth we discussed in the last report. We are caught in some kind of weird Hegelian dialectic where capitalism (thesis) is increasingly pitted against, and tainted by, the march of socialism (antithesis) while we await an outcome (synthesis). Capitalism has been diluted to a shadow of its old self. Financial bubbles are driven by excess credit - which we’ve obviously had in spades – although the consensus remains in “bubble denial.” The extreme level and longevity of central bank intervention seems to have “conditioned” perceptions. This was Doug Noland of the Credit Bubble Bulletin. “the Fed is today, along with fellow global central banks, propagating the greatest distortion in the pricing and allocation of finance in history.” Wikipedia on Atlas Shrugged again. “The book’s opening line “Who is John Galt?” becomes an expression of helplessness and despair at the current state of the novel’s fictionalized world.” But we are where we are....in a truly novel situation Novelty: the quality of being new, original, or unusual Let’s put this “novelty” in a long-term context. The next slide is very “busy”, but it summarises key phases and approximate dates in the way that long economic waves unfolded from 1788-2000. It provides a framework for how central bankers/planners are trying to defy a centuries-old process – the ebb and flow of (former?) capitalist economies. December 2013 29
  • 30. Source: Monument Securities The right side of the chart shows how periods of deflation/depression brought previous long economic waves to a close for more than two centuries. To stave off the normal depressionary conclusion to the current wave, Greenspan took Fed Funds down to 1%, which was unprecedented at the time. To stave off another depressionary conclusion to the current wave – and to counteract the “financialisation” of the US economy - Bernanke has kept us on ZIRP for almost 5 years and thrown in TARP, TALF, QE1, QE2, Twist, and QE3. The latter are ALL asset buying programmes. You can see why some eminent analysts (e.g. CLSA’s Russell Napier) are warning about a coming deflationary shock. It was, and is, the natural course of events - absent the extreme post-crisis policy intervention we’ve grown accustomed to. Compared to what’s happened in previous cycles – one could easily argue that the entire system, both the economy AND the financial markets - are in a central bank-created bubble. While we believe that equities will win over bonds in the endgame and still look attractive on a relative basis, it slightly misses the point. Implicit in the above chart is an explanation of how we’ve found ourselves in the unusual situation where the transmission mechanism of monetary policy is largely broken in terms of the real economy in the last phase of this cycle... • Under-capitalised banks, still recovering from the crisis, are reluctant to lend; • Over-indebted consumers are reluctant to borrow; and • Historically subdued levels of capacity utilisation in developed economies mean that capital investment undershoots expectations during the “recovery.” December 2013 30
  • 31. Source: St. Louis Fed ...but has never worked so well when it comes to some asset markets (liquidity has to go somewhere). Asset prices and Fed policy are joined at the hip and the US economy has never been so dependent on confidence in financial markets. With so much debt, the WHOLE SYSTEM is unusually sensitive on the downside to a sudden rise in interest rates. By tapering, the Fed risks losing control of the long end of the yield curve, but not tapering risks collateral problems in the systemically critical repo market. The Fed is in danger of cornering itself and its communication policy suggests that it realises this. Our economist, Stephen Lewis, explained it succinctly. “QE policy and interest rate policy are separate, they (FOMC) would have us believe. The problem is that central bank asset purchases were originally presented, most notably by Mr Bernanke in his (in)famous November 2002 speech, as the logical next step when short-term interest rates had been pushed down to their zero lower bound. Rate cuts and QE were part of one and the same spectrum of policies. Having understood this, the markets can hardly be blamed now if they regard de-escalation of QE as a step towards a general monetary tightening” This was Janet Yellen speaking in 2012. “Research by Federal Reserve staff and others suggests that our balance sheet operations have had substantial effects on longer-term Treasury yields...These results suggest that our portfolio actions are currently keeping 10-year Treasury yields roughly 60 basis points lower than they otherwise would be.” We’ve noted before how Bernanke was critical of Fed policy during the Great Depression for stopping open market operations (QE) in 1932, which led to a rise in real interest rates, which prolonged the Great Depression. We’ve been watching real long-term yields rising this year. December 2013 31
  • 32. Barclays US Inflation linked 7-10 years real yield (%) 1.00 0.50 Source: Bloomberg, Monument Securities. 0.00 -0.50 -1.00 Dec-13 Nov-13 Oct-13 Sep-13 Aug-13 Jul-13 Jun-13 May-13 Apr-13 Mar-13 Feb-13 Jan-13 Dec-12 Nov-12 Oct-12 Sep-12 Aug-12 Jul-12 -1.50 Now, because it’s convenient, tapering is not tightening. John Hilsenrath, the Fed’s voice at the WSJ, (really) wanted us to know that just after last week’s better-than-expected non-farm payrolls. “MARKETS BELIEVE TAPERING ISN’T TIGHTENING: Markets are positioned more to the Fed’s liking today than they were in September, when it put off reducing, or “tapering,” the monthly bond purchases. Most notably, the Fed’s message is sinking in that a wind down of the program won’t mean it’s in a hurry to raise short-term interest rates. Futures markets place a very low probability on Fed rate increases before 2015, in contrast to September, when fed funds futures markets indicated rate increases were expected by the end of 2014. The Fed has been trying to drive home the idea that “tapering is not tightening” for months and is likely to feel comforted that investors believe it as a pullback gets serious consideration.” Can anybody say “optimal control?” But the long end will be key...at least the Fed already owns about half the 10-year. And they really need a mid-cycle pick-up in growth (rather than GDP figures exaggerated by inventory adjustments). In a normal/rational world, with the Fed signalling that it is preparing to embark on tapering with equity markets at all-time highs, this would be a sensible “wait and see” opportunity to reduce equity market exposure. But these are unusual times... While identifying bubbles is not as difficult as the Fed would like us to believe, navigating them is a different matter. The dilemma faced by investors was best articulated by Byron Wien speaking on CNBC. “You don’t stay out of the market waiting for the moment of truth.” December 2013 32
  • 33. We’ve highlighted the Summation Index (a measure of breadth based on the McClellan Oscillator) as being the only indicator that we’d found that’s had a good correlation with market direction in recent months. Even that has broken down. S&P 500 v. Summation Index 5500 1800 4500 3500 1600 2500 1500 1500 1400 500 S&P 500 Dec-13 Nov-13 Oct-13 Sep-13 Aug-13 Jul-13 Jun-13 May-13 Apr-13 Mar-13 Feb-13 Jan-13 Dec-12 Nov-12 Oct-12 Sep-12 -500 Aug-12 1300 Source: Bloomberg, Monument Securities. 1700 Summation Index We might have reached the point where the most basic form of technical analysis is the best tool, i.e. exit on a break in support...while trying not to get mown down in the rush? Janet Yellen might be a “dove”, but she understands how QE is draining the available collateral from the shadow banking system, principally the US$4.6 trn US repo market. Indeed, she is the only Fed Governor who has specifically identified the risk. “A major source of unaddressed risk emanates from the large volume of short-term securities financing transactions – repos, reverse repos...” LTCM, Bear Stearns, Lehman and MF Global all went under in the repo market. The mainstream media is starting to get it. Source: Wall Street Journal December 2013 33
  • 34. Hallelujah...although the WSJ article (“Fed Eyes Financial System’s Weakest Link”) didn’t highlight the link between QE and collateral shortage. We applaud Janet Yellen’s understanding of shadow banking, but have some reservations about what might be the centrepiece of her monetary policy. The Yellen-effect We remember the last time there was an incoming Fed Chairman... In January 2006, we highlighted key messages from eight speeches given by incoming Fed Chair, Ben Bernanke. They dealt with combating the threat of deflation, especially when policy is constrained by the zero bound, and turned out to be prophetic (to say the least). In Yellen’s case, our suspicion is that her speech to the Boston Economic Club in June 2012, which dealt with optimal control, is the one to focus on. After her recent Senate appearance, our economist, Stephen Lewis, noted. “While there is no reason to suppose Ms Yellen’s anxieties over unemployment are anything but sincere, senators did not tackle her on the most distinctive feature of her approach to implementing monetary policy, namely, her enthusiasm for ‘optimal control’ techniques.” Our hunch seems much more likely following last month’s publication of a supportive paper “The Federal Reserve’s Framework for Monetary Policy - Recent Changes and New Questions” which garnered much attention recently. This report was published by three senior Fed economists and was presented at an IMF conference in early November. There were three references to Janet Yellen in the first four pages. The theory of optimal control resides in advanced mathematics and its real world applications span engineering from the simple to very advanced, e.g. the space programme. While it sounds good, it’s not very sophisticated when applied to monetary policy. It’s merely the estimation of a path for the Fed Funds rate that minimises the value of a “loss function”, inflation in this case, which is conditional (of course) on the Fed’s own baseline forecast of economic conditions. Both Yellen’s speech and the Fed paper focus on three main variables, the Fed Funds rate, inflation and unemployment. Both compare an optimal control strategy against “simple” policy rules, including various iterations of the Taylor rule, i.e. the inflation/interest rate trade off. In cynical terms, it boils down to the following: with the Fed Funds already at zero, let’s commit to maintain rates at zero well after traditional policy rules (e.g. the “Taylor rule”) would dictate a rise in rates as the recovery gathers pace. Not exactly rocket science and more confirmation of the Fed’s overwhelming bias towards inflation. But... When we get another growth slowdown in this final phase of the current long wave, the deflationary forces are so powerful that the Fed might have to resort to “shock and awe” tactics on monetary stimulus to generate inflation. That’s certainly the case in Japan. There is also the risk that, at some stage, a tipping point is reached and all confidence in the currency is lost, resulting in far MORE inflation than desired. December 2013 34
  • 35. Back in her June 2012 speech, Yellen concluded that the Fed Funds rate required immediate tightening under the Taylor rule to ensure price stability while returning the economy to a position close to full employment. Under optimal control, Fed Funds could be kept at zero until late-2015. Source: Federal Reserve The Fed paper concluded that an optimal control policy with commitment, i.e. to keep rates at zero well into the expansion, could lead to the first rise in rates being delayed as late as 2017 as shown below. Source: IMF December 2013 35
  • 36. Just like clockwork in the models. The idea that you can control a system as complex as the US economy in this manner... Unsurprisingly, both Yellen and the Fed economists make several VERY convenient assumptions such as. • The pledge to maintain short-term rates at zero for a long period will, of itself, lead to a rapid and consistent reduction in unemployment to its natural rate. At no point does this process get stuck, or even reverse course, despite the increasing longevity of the current economic expansion; • The “cost” in terms of inflation overshooting the 2% target will be minimal. While the risk that inflation could surprise on the upside is discounted, the risk that the policy could be overwhelmed by the powerful deflationary forces (as per the above discussion) is not even considered; • The definition of inflation chosen by the Fed is its favourite “core PCE”, i.e. excluding the stuff (food and energy) most likely to rise in price in an inflationary environment; • If the Fed does embark on tapering, there will be no adverse effect from reduced tapering on, for example, long-term interest rates and/or lower asset prices, etc; and • The central bank “enjoys complete credibility” (in the case of the IMF paper). The big switch! At this point, it seems likely that a Yellen Fed is going to try to offset the impact of tapering QE with some form of optimal control with “enhanced” forward guidance versus the current thresholds of 6.5% unemployment and 2.5% inflation. The Fed paper incorporated simulations with forward guidance on economic thresholds, including a reduction to 5.5% for unemployment which some commentators have suggested. According to the IMF paper’s simulation, a 5.5% unemployment threshold (with 2.5% inflation) implies an initial rise in the Fed Funds rate in Q4 2015 – not 2017 as speculated in the FT. It also suggests that the delay in the first Fed Funds increase would only be two or three quarters later than with the current threshold of 6.5%. Source: IMF December 2013 36
  • 37. Does a commitment to keeping the Fed Funds rate at zero for an additional two or three quarters pale into insignificance compared with reducing QE by an annualised rate of more than US$ 1 trillion per annum. We suspect so, although the Fed is likely to soften the initial blow by reductions in “baby steps” of say US$10bn. But tapering is not tightening and the models work beautifully. The “father” of optimal control was a (Soviet) mathematician, Lev Pontryagin, revered as one of the greatest of the twentieth century. He was also blind and depended on his mother to read maths books to him while he was growing up. In his study of optimal control theory, Pontryagin introduced the “maximum principle.” One might argue that ZIRP plus QE of US$85bn per month is akin to the maximum principle in the history of US monetary policy. Pontryagin also introduced the idea of “bang-bang control.” From Wikipedia. “In control theory, a bang–bang controller (on–off controller)....is a feedback controller that switches abruptly between two states...They are often used to control a plant that accepts a binary input, for example, a furnace that is either completely on or completely off.” Your hot water system operates under bang-bang control. We remain doubtful that the US economy has reached the much discussed “escape velocity” on a sustainable basis. Consequently, if the Fed managed to taper QE entirely before the next slowdown/recession, the latter might trigger an abrupt return of VERY accommodative monetary policy in a true “bang-bang control” manner. Perhaps more likely is that the Fed begins to taper, but a slowing economy forces it to reverse course later in 2014. Finally, Stephen Lewis on the “Fad of the Year.” “The year 2013 will go down in history as the year when ‘forward guidance’ became the latest craze in central bank policy circles. Casual observers might assume that central banks are continually honing the instruments they use to implement their policies, and developing new ones. It might seem reasonable to suppose that this is a story of steady improvement in the effectiveness of central bank actions. That has not been the case, however. No major central bank nowadays aims to control the money supply (however defined), though that is what they all did in the 1980s. At the time, it was hailed as the long-concealed key to success that set modern central bank practice apart from the less than optimal performance of the past. But that view did not prevail for long. Later, ‘inflation targeting’ became the vogue but, following the 2007-09 financial crisis, only the Bank of Japan, among the majors, commits to meeting a specific target for inflation as its overriding policy-objective. Five years ago, ‘forward guidance’, whereby a central bank makes a commitment regarding its policy-settings conditional on a timeline or on specified economic circumstances, was merely an idea tossed around in a few university lecture-rooms.... “In his speech in New York earlier this week, Mr Carney argued that central banks had to respond aggressively to counter the risks of the liquidity trap closing. ‘Forward guidance is integral to the response,’ he declared. ‘It reduces uncertainty by providing reassurance that monetary policy December 2013 37
  • 38. will not be tightened prematurely before the recovery is entrenched to sustain higher rates.’ That is the standard defence of ‘forward guidance’. Even so, not all central bankers are impressed by the efficacy of this fashionable technique of monetary management. In a speech yesterday, Dr Weale of the BoE’s MPC made what is a valid point. He declared, ‘I find it inconceivable that, without forward guidance, I or any of my colleagues would already have voted to raise Bank Rate and that the only thing that has stopped us is forward guidance. If forward guidance has done no more than to codify what people had expected the Monetary Policy Committee to do anyway, then its effects on the profile of expected future rates, and thus on output and inflation, should be expected to be small.’ An even more outspoken critic of ‘forward guidance’ is Prof Fischer, often styled the doyen of central bankers partly on the grounds of his having been Mr Bernanke’s Ph.D thesis advisor. He may well feel that his pupil has gone astray because, in September, he lambasted ‘forward guidance’. He argued that, since the future is unknown, the central bank has no business giving assurances as to its future actions. Doing so is very likely to cause market confusion. “In the light of those comments, it is intriguing that Washington should be awash with rumours that President Obama wishes to appoint Prof Fischer as Vice Chairman of the Federal Reserve...” December 2013 38
  • 39. Important Information –Monument Securities Limited – FCA No 149028 Independent Investment Research Disclaimer This information has been has been issued by Monument Securities Limited (MSL) in accordance with MSL’s Investment Research Policy. This information is only intended to be distributed to existing Eligible Counterparties and Professional Clients of MSL. Further, MSL’s investment research is intended for use solely by Eligible Counterparties and Professional Clients, who possess a certain degree of knowledge and experience in the subject of this information. Therefore the contents may refer to terms and subjects that may be unsuitable for a retail client and this information should not under any circumstances be forwarded to a retail client. This content is for information purposes only and should not be construed as an offer, solicitation or recommendation to buy or sell any investments or investment advice. MSL do not recommend or endorse any particular investment, or course of action. This information has no regard for any investment objectives or financial situation of any eligible counterparty or professional client. Any investment that is mentioned may warrant further investigation or research, which will be solely at the discretion of the eligible counterparty or professional client. Information and opinions expressed herein are based on sources believed to be reliable, however we do not represent that they are accurate or complete. Further any views or estimates are based on judgements made as at the date of this information. All opinions and estimates are subject to change without notice. MSL and/or connected persons may from time to time have positions in or effect transactions in any investment or related investment mentioned herein and may provide financial services to the issuers or such investments. MSL has put in place systems and controls mechanisms supported by appropriate procedures to identify and manage any conflicts of interest that may arise. A copy of our conflict of interest policy is available on request. In relation to this content, we do not believe that any relationships, circumstances, interests or potential conflicts of interest that would require disclosure under the FCA Conduct of Business rules are likely to arise. In particular no major shareholdings or financial interests exist between MSL and any relevant company. In the event that this situation changes then appropriate disclosures will be made. All investments involve a degree of risk and may not be suitable for certain investors. All investors should make their own investment decisions based on their circumstances, financial objectives and resources and after seeking any appropriate professional advice. This is a marketing communication. It has not been prepared under the Independent Investment research regulatory requirements and accordingly there is no prohibition on dealing ahead of the dissemination of this research material. Monument Securities Limited is authorised and regulated by the Financial Services Authority FCA Number 149028 in the UK. December 2013 39