

Recomendados
Recomendados
Mais conteúdo relacionado
Mais procurados
Mais procurados (17)
Destaque
Destaque (20)
Semelhante a Q2 2012 Houston Industrial Market Report
Semelhante a Q2 2012 Houston Industrial Market Report (20)
Mais de Coy Davidson
Mais de Coy Davidson (20)
Último
Último (20)
Q2 2012 Houston Industrial Market Report
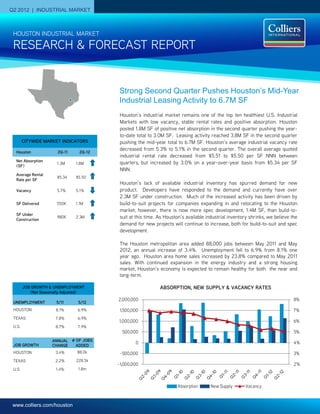
- 1. Q2 2012 | INDUSTRIAL MARKET HOUSTON INDUSTRIAL MARKET RESEARCH & FORECAST REPORT Strong Second Quarter Pushes Houston’s Mid-Year Industrial Leasing Activity to 6.7M SF Houston’s industrial market remains one of the top ten healthiest U.S. Industrial Markets with low vacancy, stable rental rates and positive absorption. Houston posted 1.8M SF of positive net absorption in the second quarter pushing the year- to-date total to 3.0M SF. Leasing activity reached 3.8M SF in the second quarter CITYWIDE MARKET INDICATORS pushing the mid-year total to 6.7M SF. Houston’s average industrial vacancy rate decreased from 5.3% to 5.1% in the second quarter. The overall average quoted Houston 2Q-11 2Q-12 industrial rental rate decreased from $5.51 to $5.50 per SF NNN between Net Absorption quarters, but increased by 3.0% on a year-over-year basis from $5.34 per SF 1.3M 1.8M (SF) NNN. Average Rental $5.34 $5.50 Rate per SF Houston’s lack of available industrial inventory has spurred demand for new Vacancy 5.7% 5.1% product. Developers have responded to the demand and currently have over 2.3M SF under construction. Much of the increased activity has been driven by SF Delivered 550K 1.1M build-to-suit projects for companies expanding in and relocating to the Houston market; however, there is now more spec development, 1.4M SF, than build-to- SF Under Construction 980K 2.3M suit at this time. As Houston’s available industrial inventory shrinks, we believe the demand for new projects will continue to increase, both for build-to-suit and spec development. The Houston metropolitan area added 88,000 jobs between May 2011 and May 2012, an annual increase of 3.4%. Unemployment fell to 6.9% from 8.1% one year ago. Houston area home sales increased by 23.8% compared to May 2011 sales. With continued expansion in the energy industry and a strong housing market, Houston’s economy is expected to remain healthy for both the near and long-term. JOB GROWTH & UNEMPLOYMENT ABSORPTION, NEW SUPPLY & VACANCY RATES (Not Seasonally Adjusted) 2,000,000 8% UNEMPLOYMENT 5/11 5/12 HOUSTON 8.1% 6.9% 1,500,000 7% TEXAS 7.8% 6.9% 1,000,000 6% U.S. 8.7% 7.9% 500,000 5% ANNUAL # OF JOBS 0 4% JOB GROWTH CHANGE ADDED HOUSTON 3.4% 88.0k -500,000 3% TEXAS 2.2% 228.5k -1,000,000 2% U.S. 1.4% 1.8m Absorption New Supply Vacancy www.colliers.com/houston
- 2. RESEARCH & FORECAST REPORT | Q2 2012 | HOUSTON INDUSTRIAL MARKET Vacancy & Availability on a year-over-year basis from $5.34 Bray International 13788 West Road per SF NNN. By property type, the Houston’s industrial vacancy averaged May-12 80,200 SF average quoted NNN rental rates are as 5.1% in the second quarter, 20 basis follows: $5.06 per SF for Distribution Tyco Valves & Control2 points below the 5.3% vacancy rate Bayport North Industrial Park space; $4.23 per SF for Bulk Warehouse posted in the first quarter. April-12 44,800SF space; $6.64 per SF for Flex/Service At the close of the second quarter, space; with Tech/R&D space averaging Stephens Office Supply, Inc.1, 2 $6.30 per SF. Alamo Crossing Commerce Center Houston had 24.6M SF of vacant May-12 41,458 SF industrial space citywide, 921K SF less Absorption & Demand Drilltec Technologies, Inc. than the previous quarter. Among the 3500 Brittmoore Rd major industrial corridors, the Northwest Houston’s industrial market posted 1.8M May-12 40,595 SF submarket held the largest amount of SF of positive net absorption in the vacant space with 5.6M SF (4.3% second quarter pushing the year-to-date United Plastics Group Inc.1 total to 3.0M SF. Alamo Crossing Commerce Center vacancy), followed by the Southeast Apr-12 36,439 SF submarket with 5.0M SF vacant (6.0% vacancy), the Southwest submarket with Among Houston’s major industrial Abacus Plumbing 4.4M SF vacant (6.9% vacancy), and the corridors, the North and Northwest 15851 Vickery Drive submarkets outperformed all others in Apr-12 33,450 SF North submarket with 3.9M SF vacant (5.5% vacancy). the second quarter, posting the highest GMI Mann Warehouses, Inc.2 positive net quarterly absorption of 1.1M 4410 Clinton Houston’s industrial construction pipeline SF and 415K SF respectively. The May-12 30,000 SF had 2.3M SF of projects underway at the Northeast submarket followed with 254K American International Shipping LLC end of the second quarter, including 1.4M SF of positive net absorption. 8201 La Porte Fwy. SF of spec development. The largest Apr-12 27,417 SF project under construction is a 475,000- There were several major tenant move- Spirit Delivery & Distribution SF state-of-the-art foodservice ins contributing to net absorption gains Pine Timbers Distribution Center distribution facility that will be the new in the first quarter, including National Apr-12 25,680 SF Gulf Coast regional distribution hub for Oilwell Varco (128,000 SF); Sutong Tire HWC Wire & Cable Co. the Ben E. Keith Company. The facility is (99,840 SF); OldCastle Building Envelope 8920 Lawndale Avenue being constructed on an 82-acre tract Inc. (61,194 SF); Houston Plate Apr-12 22,000 SF located in Missouri City in the Beltway Processing (48,688 SF); Allied Stone (43,382 SF); and Supreme Pet Supplies Instyle Granite & Marble Crossing Business Park. A list of 4315 Dacoma additional buildings currently under (42,660 SF). Jun-12 20,000 SF construction can be found on Page 4 of Leasing Batterson LP this report. The largest spec project in Houston’s industrial leasing activity 3901 Airline Drive the pipeline is a 267,200-SF distribution May-12 20,000 SF warehouse located on Okanella Lane in reached 3.8M SF in the second quarter, the Northwest Inner Loop industrial pushing the year-to-date total to over GHX Industrial, LLC 6.7M SF. A list of Houston’s top 6507 West Little York Road submarket. Jun-12 18,000 SF industrial leases signed to date includes: Rental Rates Emser Tile2 1 Colliers International transaction Although Houston’s overall average 9835 A Genard Road Jun-12 417,350 SF 2 Renewal quoted industrial rental rate decreased 3 Expansion from $5.51 to $5.50 per SF NNN Fortune Rag Company, Ltd between quarters, it increased by 3.0% Navigation Business Park May-12 84,791 SF COLLIERS INTERNATIONAL | P. 2
- 3. RESEARCH & FORECAST REPORT | Q2 2012 | HOUSTON INDUSTRIAL MARKET Sales Activity 2Q 2012 The National Realty Group, Inc. sold Oxiteno USA, LLC purchased a a 10,000-SF, Class B industrial 24,250 SF chemical manufacturing Total Volume: $427.5M warehouse to Transtar AC Supply, facility from Old World Industries, No. of Properties: 51 Inc. for $85 per SF. The building, Inc. for $619 per SF, which located at 1231 Price Plaza Dr. in included equipment for processing Total SF: 13.5M the Northwest Outlier Industrial chemicals. The property is located Average $/SF: $39 submarket, is a single-tenant at 9801 Bay Area Blvd. in warehouse which is 100% occupied Pasadena, TX. Average Cap Rate: 8.0% by Baker Distributing. Houston’s industrial investment Metal Coatings Corp. purchased an Petronash Americas LLC purchased 82,000-SF, Class B multi-tenant a 40,000-SF manufacturing activity increased between quarters, industrial warehouse from Richland building from KW Industries for $57 with 51 properties being sold in the Investments, Inc. for $35 per SF. per SF. The property is located at second quarter compared to 46 in The property, located on 510 Industrial Blvd. in Sugar Land, the first quarter. Some of the Westhollow Parkway in Sugar Land TX. The buyer, an engineering and second quarter transactions include industrial submarket was 100% manufacturing company servicing the following: occupied at the time of sale. the oil & gas industry, will occupy the building. HOUSTON INDUSTRIAL MARKET SUMMARY Houston Industrial Market Statistical Summary 2nd Quarter 2012 Direct Sublet Total Direct Sublet Total 2Q12 Net YTD 2012 Net 2Q12 YTD 2012 SF Under Market Rentable Area Vacancy Vacancy Vacancy Vacant SF Vacant SF Vacant SF Absorption Absorption Completions Completions Construction Rate Rate Rate Greater Houston Total 483,649,091 23,939,845 4.9% 677,649 0.1% 24,617,494 5.1% 1,802,467 3,034,582 1,128,463 1,722,868 2,315,843 NW Inner Loop 12,328,230 473,340 3.8% - 0.0% 473,340 3.8% 29,979 89,513 - - - Downtown 32,666,651 1,790,705 5.5% - 0.0% 1,790,705 5.5% 8,183 (33,405) - - - North Inner Loop 5,265,017 479,090 9.1% - 0.0% 479,090 9.1% - 90,139 - - - SW Inner Loop 7,858,518 94,826 1.2% - 0.0% 94,826 1.2% 15,909 58,943 - - - Total Inner Loop 58,118,416 2,837,961 4.9% - 0.0% 2,837,961 4.9% 54,071 205,190 - - - North Fwy/Tomball Pky 14,101,569 886,492 6.3% 17,332 0.1% 903,824 6.4% 430,520 506,133 140,243 373,243 239,235 North Hardy Toll Rd 24,845,891 1,359,679 5.5% 7,617 0.0% 1,367,296 5.5% 154,872 176,129 180,058 180,058 80,415 North Outer Loop 17,668,453 909,127 5.1% - 0.0% 909,127 5.1% 389,349 373,933 45,380 146,630 45,840 The Woodlands/Conroe 13,305,895 660,530 5.0% 22,500 0.2% 683,030 5.1% (7,906) 42,049 - - 65,000 Total North Corridor 69,921,808 3,815,828 5.5% 47,449 0.1% 3,863,277 5.5% 966,835 1,098,244 365,681 699,931 430,490 Northeast Hwy 321 1,188,527 1,980 0.2% 7,500 0.6% 9,480 0.8% (7,500) (7,500) - - - Northeast Hwy 90 15,741,663 281,665 1.8% 129,000 0.8% 410,665 2.6% 143,471 78,386 - 20,000 - Northeast I-10 3,897,753 54,186 1.4% - 0.0% 54,186 1.4% 10,594 100,344 - - - Northeast Inner Loop 11,725,987 528,208 4.5% - 0.0% 528,208 4.5% 107,145 99,859 - - - Total Northeast Corridor 32,553,930 866,039 2.7% 136,500 0.4% 1,002,539 3.1% 253,710 271,089 - 20,000 - Hwy 290/Tomball Pky 14,991,866 671,520 4.5% 31,786 0.2% 703,306 4.7% (82,405) 10,443 - 89,919 108,548 Northwest Hwy 6 5,092,219 158,116 3.1% 11,520 0.2% 169,636 3.3% (21,032) (22,757) - 40,452 - Northwest Inner Loop 61,822,721 2,942,557 4.8% 143,341 0.2% 3,085,898 5.0% (19,023) 352,464 - - 303,273 Northwest Near 16,057,659 542,016 3.4% 64,112 0.4% 606,128 3.8% 54,308 493,339 - - 335,542 Northwest Outlier 12,664,809 341,929 2.7% 49,055 0.4% 390,984 3.1% 34,699 2,321 - - 22,500 West Outer Loop 22,147,007 692,743 3.1% - 0.0% 692,743 3.1% 448,565 661,211 - 45,835 62,375 Total Northwest Corridor 132,776,281 5,348,881 4.0% 299,814 0.2% 5,648,695 4.3% 415,112 1,497,021 - 176,206 832,238 South Highway 35 30,222,267 1,183,966 3.9% 58,961 0.2% 1,242,927 4.1% (38,961) (155,878) 20,000 20,000 108,000 South Inner Loop 13,801,162 580,075 4.2% 42,000 0.3% 622,075 4.5% 56,896 (118,561) - - - Total South Corridor 44,023,429 1,764,041 4.0% 100,961 0.2% 1,865,002 4.2% 17,935 (274,439) 20,000 20,000 108,000 East I-10 Outer Loop 15,582,008 115,135 0.7% - 0.0% 115,135 0.7% 10,500 61,500 - - - East-SE Far 46,389,438 4,413,656 9.5% 5,325 0.0% 4,418,981 9.5% 221,610 44,919 600,800 600,800 262,115 SE Outer Loop 20,995,067 468,667 2.2% - 0.0% 468,667 2.2% (6,365) 54,053 - - - Total Southeast Corridor 82,966,513 4,997,458 6.0% 5,325 0.0% 5,002,783 6.0% 225,745 160,472 600,800 600,800 262,115 Highway 59/Highway 90 21,897,222 1,072,926 4.9% - 0.0% 1,072,926 4.9% 144,728 222,362 45,727 59,227 683,000 Southwest Far 10,361,444 913,157 8.8% - 0.0% 913,157 8.8% (15,192) 71,564 - 50,449 - Southwest Outer Loop 12,748,688 836,548 6.6% - 0.0% 836,548 6.6% 19,421 41,147 - - - Fort Bend County/Sugar Land 18,281,360 1,487,006 8.1% 87,600 0.5% 1,574,606 8.6% (279,898) (258,068) 96,255 96,255 - Total Southwest Corridor 63,288,714 4,309,637 6.8% 87,600 0.1% 4,397,237 6.9% (130,941) 77,005 141,982 205,931 683,000 COLLIERS INTERNATIONAL | P. 3
- 4. RESEARCH & FORECAST REPORT | Q2 2012 | HOUSTON INDUSTRIAL MARKET 2Q 2012 Industrial Under Construction Estimated Submarket Building Address RBA % Leased Developer Delivery Southwest Corridor Ind 1001 Cravens Rd 475,000 100.0 Ben E Keith Jan-13 Northwest Corridor Ind 10650 Okanella Ln 267,273 0.0 Proterra Properties, Inc. May-12 Southeast Corridor Ind 405 Deerwood Glen Dr 160,000 100.0 Clay Development Jul-12 Northwest Corridor Ind 7355 Yorkfield Bldg 1 133,480 100.0 Weeks Robinson Properties Nov-12 Northwest Corridor Ind 7355 Yorkfield Bldg 100 131,050 0.0 Weeks Robinson Properties Oct-12 Southwest Corridor Ind 13223 S Gessner 116,480 0.0 Stream Realty Partners Jul-12 North Corridor Ind 14300 Hollister Rd 111,065 76.8 Liberty Property Trust Jan-13 South Corridor Ind 2725 Park South View 108,000 100.0 DiMare Fresh Aug-12 Southwest Corridor Ind 13123 S Gessner Dr 91,520 0.0 Stream Realty Partners Jul-12 North Corridor Ind 14400 Hollister Rd 88,170 0.0 Liberty Property Trust Jan-13 North Corridor Ind 12309 Cutten Rd 80,000 0.0 Clay Development Jun-12 North Corridor Ind 3375 Pollock Dr 65,000 100.0 KDW Sep-12 North Corridor Ind 2330 Peyton Rd 56,915 0.0 Capital Commercial Nov-12 Southeast Corridor Ind 310 W Deerwood Glen Dr 40,000 0.0 Clay Development Jun-12 Northwest Corridor Ind 12223 FM 529 37,875 0.0 Texas Development Co Jun-12 Northwest Corridor Ind Windfern Rd 36,000 0.0 First Industrial Sep-12 Southeast Corridor Ind 10200 New Decade Dr 32,000 0.0 Unknown Oct-12 Northwest Corridor Ind 12616 N Houston Rosslyn Rd 30,145 0.0 Capital Commercial Jun-12 Northwest Corridor Ind 6410 Langfield Rd - Bldg E 30,070 0.0 Clay Development Dec-12 Northwest Corridor Ind 7645 Railhead Ln 30,000 0.0 TNRG Jul-12 Northwest Corridor Ind 12010 FM 529 24,500 0.0 United Equities, Ltd. Sep-12 North Corridor Ind 1517 Richey Rd 23,500 100.0 National Realty Group Dec-12 Northwest Corridor Ind 6511 West Little York Rd 22,942 0.0 Levey Development Jul-12 Northwest Corridor Ind 459 Stonegate Dr - Bldg 1 22,500 0.0 Clay Development Sep-12 Northwest Corridor Ind 12626 N Houston Rosslyn Rd 21,403 0.0 Capital Commercial Jun-12 Northwest Corridor Ind 6507 West Little York Rd 18,000 0.0 Levey Development Jul-12 North Corridor Ind Vickery & Aldine Bender Bldg A 15,680 0.0 United Equities, Ltd. Aug-12 North Corridor Ind Vickery & Aldine Bender Bldg B 15,600 0.0 United Equities, Ltd. Aug-12 Northwest Corridor Ind 8725 Golden Spike Ln 15,000 0.0 TNRG Jul-12 North Corridor Ind Vickery & Aldine Bender Bldg C 14,560 0.0 United Equities, Ltd. Aug-12 Northwest Corridor Ind 8715 Golden Spike Ln 12,000 0.0 TNRG Jul-12 2Q 2012 Industrial Deliveries Submarket Building Address RBA % Leased Developer Delivered Southeast Corridor Ind 1445 Sens Rd 267,320 71.45 Carson Companies Jul-12 Southeast Corridor Ind 300 Delta Pky 168,480 100.00 National Property Holdings, LP Apr-12 Southeast Corridor Ind 6702 Gulf Fwy 165,000 100.00 Del Papa Distributing Apr-12 North Corridor Ind 330 Northpark Central Dr 146,700 0.00 Prologis Apr-12 Southwest Corridor Ind 12682 Cardinal Meadow 96,255 100.00 API Realty Jun-12 North Corridor Ind 7607 Bluff Point Dr 78,556 0.00 InSite Jun-12 North Corridor Ind 16605 Central Green Blvd - Bldg 1 77,886 100.00 PSRBB Apr-12 Southwest Corridor Ind 4230 Greenbriar Dr 45,727 100.00 Puffer Sweiven Apr-12 North Corridor Ind 14000 Vickery Dr 45,380 100.00 Clay Development Jul-12 North Corridor Ind 7603 Bluff Point Dr - Bldg 9 44,789 0.00 InSite May-12 North Corridor Ind 4560 Kendrick Plaza Dr. - 31B 35,255 0.00 InSite Jun-12 North Corridor Ind 2438 Greens Rd 33,538 0.00 Capital Commercial May-12 North Corridor Ind 2442 Greens Rd 33,379 0.00 Capital Commercial Jun-12 South Corridor Ind 9250 Park South View 20,000 100.00 Tribble & Young LLC Jun-12 COLLIERS INTERNATIONAL | P. 4
- 5. RESEARCH & FORECAST REPORT | Q2 2012 | HOUSTON INDUSTRIAL MARKET Colliers International Statistics Revenues: $1.8 billion Countries: 62 Offices: 522 Professionals & Staff: 12,300 Brokers: 4,800 Square Feet Managed: 1.25 billion* Lease/Sale Transactions: 76,000 Total Transaction Value: $68 billion (Based on 2011 results.) *The combination of Colliers International and FirstService results in 2.5 billion under management (2nd largest in the world). Lisa R. Bridges Director of Market Research Houston Direct +1 713 830 2125 Fax +1 713 830 2118 lisa.bridges@colliers.com COLLIERS INTERNATIONAL | HOUSTON 1300 Post Oak Boulevard Suite 200 Houston, Texas 77056 Main +1 713 222 2111 Accelerating success. COLLIERS INTERNATIONAL | P. 5