SlideShare uma empresa Scribd logo
1 de 5
Baixar para ler offline
SPRING 2011 | RETAIL


gLOBAL

HIGHLIGHTS


                                                  Premier Retail Streets Bounce-Back
                                                  rOss J. MOOre Chief Economist | USA
                                                  After two successive years of lackluster growth, the world’s top retail streets once again regained
                                                  their vitality, as reflected by a general rise in rents in many of the world’s premier shopping districts.
                                                  As the lingering effects of the global downturn faded during the latter half of 2010, rising demand for
                                                  the world’s most prime retail real estate was evident in many countries as many new retailers
gLOBAL retAiL streets                             sought to establish a foothold in the world’s most prestigious avenues. The rebound in luxury retail
(UsD per sQUAre fOOt per YeAr) - seLect           can be seen in the share prices of leading high-end fashion retailers, all of which are up sharply
cities                                            since the beginning of 2010. Burberry in particular is up 124.5%, but as the chart below demonstrates,
                                        AnnUAL
                                        chAnge    Bulgari, Richemont-Cartier, Tiffany, LVMH Moet Hennessey Louis Vuitton and PPR-Gucci are all up
 street/precinct              rent        (%)     significantly over the past 17 months. This surge in share prices shows that investors have
 New York – Fifth Avenue     2,150.00     72.0    confidence that high-end consumers are back to their big-spending ways. Two features unique to
                                                  high-end retail are the relative health of financial centers—which have recovered sharply since the
 Hong Kong – Russell         1,510.00     25.6
 Street, Causeway Bay                             lows of 2009—and tourism, which is benefiting such cities as London and New York.
 Paris – Avenue des          1,310.00       0.0
 Champs-Élysées                                   With the expansion of the global economy and key pockets of robust growth, luxury retailers are
                                                  increasingly looking beyond traditional locations and venturing into emerging markets previously
 London – Old Bond Street     962.00        0.0   viewed as too new or not deep enough. This trend is expected to continue along with a mix of
 Zurich – Bahnhofstrasse      955.00      14.2    low-end, high-fashion retailers and traditional luxury retailers.
 Milan – Via Monte            943.00      -2.7
 Napoleone                                        Although a move to discount retail is apparent in many countries, luxury retail is still a viable sector
 Sydney – Pitt Street Mall    901.00      11.1    and one that is still in a secular uptrend. “Aspirational” consumers and an expanding middle class—
                                                  particularly in Asia Pacific and South America—will be a key source of growth for many luxury
 Moscow – Tverskaya           689.00      21.3
 Street                                           retailers.
 Tokyo – Ginza-               611.00        0.0   In North America, most top retail corridors saw rents increase over the past year. New York’s Fifth
 Chuo Street
                                                  Avenue in particular saw rents spike, increasing by $900.00 per square foot (PSF) to $2,150.00
 Munich – Kaufingerstrasse    519.00        0.0   PSF, while Madison Avenue rose by a more modest $118.00 to $708.00 PSF. Chicago’s North
                                                  Michigan Avenue saw rents rise by $25.00 to $250.00 PSF; San Francisco’s Union Square district
                                                  saw rents increase by $20.00 to $340.00 PSF. Los Angeles’ Rodeo Drive, however, registered only
regiOnAL reseArch cOntActs                        a small increase, rising by $2.00 to $425.00 PSF. Canada’s premier retail avenues, including Bloor
AMericAs                                          Street in Toronto and Robson Street in Vancouver, saw rents hold steady over the year while Ste-
Ross Moore, ross.moore@colliers.com               Catherine Street in Montreal saw a modest drop.
eUrOpe/MiDDLe eAst/AfricA                                                                                           In Europe, Paris’ Avenue des
                                                   gLOBAL LUxUrY retAiLers
Thomas Grounds, thomas.grounds@colliers.com                                                                         Champs-Élysées saw no change
AsiA pAcific                                                                                                        over the last 12 months, with
Simon Lo, simon.lo@colliers.com                                                                                     rents averaging $1,310.00 PSF.
AUstrALiA/new zeALAnD                                                                                               London’s Old Bond Street also
Nerida Conisbee, nerida.conisbee@colliers.com                                                                       held steady at $962.00 PSF. In
                                                   Share Price, USD


                                                                                                                    Asia Pacific, rents in Ginza-Chuo
JApAn
Yumiko Yasuda, yumiko.yasuda@colliers.com                                                                           Avenue in Tokyo held at $611.00
                                                                                                                    P S F, w h i l e H o n g K o n g ’s
                                                                                                                    Causeway Bay district saw rents
                                                                                                                    increase by 25.6% to $1,510.00.
                                                                                                                    A list of the top 50 streets can
                                                                                                                    be found on page five of this
                                                                                                                    report.


www.colliers.com
HIGHLIGHTS | SPRING 2011 | ReTAIl | GlOBAl


 gLOBAL retAiL sUrVeY

                                                                                    MeAsUre
                                                                                                      exchAnge                                   AnnUAL
                                                                             QUOteD   tiMe           rAte (UsD)      QUOteD      UsD rent        chAnge
 citY                        cOUntrY         street                         cUrrencY periOD   Unit   MAr. 31, 2011    rent       psf/YeAr      (LOcAL, %)

 eUrOpe, MiDDLe eAst, AfricA
 Tirana                     Albania          Myslym Shyri                     EUR      Year   SM          0.71          50.00        78.62        (11.11)
 Vienna                     Austria          Graben, Kohlmarkt, Kärntner      EUR     Month   SM          0.71         350.00       550.31           0.00
                                             Strasse
 Minsk                      Belarus          Nezavisimosti Avenue             EUR     Month   SM          0.71          45.00        70.75        (18.18)
 Sofia                      Bulgaria         Vitosha Blv                      EUR     Month   SM          0.71          65.00       102.20        (13.33)
 Zagreb                     Croatia          Ilica Street                     EUR     Month   SM          0.71          45.00        70.75           0.00
 Prague                     Czech Republic   Na Příkopě                       EUR     Month   SM          0.71         200.00       314.46          17.65
 Copenhagen                 Denmark          Østergade (Strøget)              DKK      Year   SM          5.29       18,000.00      316.19           0.00
 Tallinn                    Estonia          Viru Street                      EUR     Month   SM          0.71          25.00        39.31           4.17
 Helsinki                   Finland          Aleksanterinkatu                 EUR     Month   SM          0.71         170.00       267.29          (5.56)
 Paris                      France           Avenue des Champs-Élysées        EUR     Month   SM          0.71         833.33     1,310.26           0.00
 Berlin                     Germany          Tauentzienstrasse                EUR     Month   SM          0.71         220.00       345.91           0.00
 Düsseldorf                 Germany          Königsallee                      EUR     Month   SM          0.71         240.00       377.36           4.35
 Frankfurt                  Germany          Zeil                             EUR     Month   SM          0.71         270.00       424.52           0.00
 Hamburg                    Germany          Spitalerstrasse                  EUR     Month   SM          0.71         240.00       377.36           9.09
 Munich                     Germany          Kaufingerstrasse                 EUR     Month   SM          0.71         330.00       518.86           0.00
 Stuttgart                  Germany          Königstrasse                     EUR     Month   SM          0.71         320.00       503.14           0.00
 Athens                     Greece           Ermou Street                     EUR     Month   SM          0.71         180.00       283.02        (10.00)
 Budapest                   Hungary          Váci Utca                        EUR     Month   SM          0.71         110.00       172.95        (12.00)
 Dublin                     Ireland          Grafton Street                   EUR      Year   SF          0.71         300.00       422.95        (10.00)
 Milan                      Italy            Via Monte Napoleone              EUR     Month   SM          0.71         600.00       943.39          (2.70)
 Rome                       Italy            Via Condotti                     EUR     Month   SM          0.71         450.00       707.54           8.00
 Riga                       Latvia           Barona Street                    EUR     Month   SM          0.71          20.00        31.45          33.33
 Vilnius                    Lithuania        Didzioji Street                  EUR     Month   SM          0.71          32.00        50.31           6.67
 Amsterdam                  Netherlands      Kalverstraat                     EUR     Month   SM          0.71         187.50       294.50          (2.17)
 Rotterdam                  Netherlands      Lijnbaan                         EUR     Month   SM          0.71         108.30       170.28          (0.03)
 The Hague                  Netherlands      Spuistraat                       EUR     Month   SM          0.71         104.20       163.84           0.03
 Oslo                       Norway           Karl Johans Gate                 NOK      Year   SM          5.59       14,000.00      232.59           3.70
 Warsaw                     Poland           Ulica Nowy Świat                 EUR     Month   SM          0.71          86.00       135.22        (14.00)
 Bucharest                  Romania          Magheru Street                   EUR     Month   SM          0.71          75.00       117.92        (16.67)
 Moscow                     Russia           Tverskaya Street                 EUR      Year   SM          0.71         438.00       688.67          21.33
 St. Petersburg             Russia           Nevsky Prospekt                  EUR      Year   SM          0.71         203.57       320.08          19.75
 Riyadh                     Saudi Arabia     King Fahad Road / Olaya Road     SAR      Year   SM          0.62        3,000.00      446.95           0.00
 Belgrade                   Serbia           Kneza Mihaila Street             EUR     Month   SM          0.71         110.00       172.95           0.00
 Bratislava                 Slovakia         Obchodná Street                  EUR     Month   SM          0.71          40.00        62.89        (11.11)
 Madrid                     Spain            Puerta del Sol Preciados         EUR     Month   SM          0.71         175.00       275.15           9.38
 Stockholm                  Sweden           Biblioteksgatan                  SEK      Year   SM          6.34       15,000.00      219.78           7.14
 Geneva                     Switzerland      Rue du Rhône                     CHF      Year   SM          0.92        7,500.00      756.24           0.00
 Zurich                     Switzerland      Bahnhofstrasse                   CHF      Year   SM          0.92        9,475.00      955.38          14.16
 Kyiv                       Ukraine          Vulitsya Khreshchatyk            EUR     Month   SM          0.71         193.00       303.46          30.47
 Abu Dhabi                  UAE              Khalifa Street                   USD     Month   SM          1.00          40.00        44.61
 Dubai                      UAE              Sheikh Zayed Road                USD     Month   SM          1.00          16.00        17.84           3.32
 Birmingham                 United Kingdom   High Street / New Street         GBP      Year   SF          0.62         140.00       224.43           5.00
 Edinburgh                  United Kingdom   Princes Street                   GBP      Year   SF          0.62         110.00       176.34           4.46


                                                                                                                         SM = square meters   SF = square feet


p. 2     | cOLLiers internAtiOnAL
HIGHLIGHTS | SPRING 2011 | ReTAIl | GlOBAl


 gLOBAL retAiL sUrVeY

                                                                                            MeAsUre
                                                                                                              exchAnge                                 AnnUAL
                                                                                     QUOteD   tiMe           rAte (UsD)      QUOteD      UsD rent      chAnge
 citY                               cOUntrY          street                         cUrrencY periOD   Unit   MAr. 31, 2011    rent       psf/YeAr    (LOcAL, %)
 Glasgow                            United Kingdom   Buchanan Street                  GBP      Year   SF          0.62         160.00       256.49        9.09
 Leeds                              United Kingdom   Briggate                         GBP      Year   SF          0.62         126.67       203.06        0.00
 London                             United Kingdom   Old Bond Street                  GBP      Year   SF          0.62         600.00       961.85        0.00
 London                             United Kingdom   Oxford Street                    GBP      Year   SF          0.62         475.00       761.46        0.00
 Manchester                         United Kingdom   Market Street                    GBP      Year   SF          0.62         150.00       240.46        0.00
 nOrth AMericA
 Calgary, AB                        Canada           Uptown 17th Avenue               CAD      Year   SF          1.03          55.00        53.47      (26.67)
 Edmonton, AB                       Canada           Downtown Edmonton                CAD      Year   SF          1.03          45.00        43.75        0.00
 Halifax, NS                        Canada           Spring Garden Road               CAD      Year   SF          1.03          50.00        48.61        0.00
 Montreal, QC                       Canada           Ste-Catherine Street West        CAD      Year   SF          1.03         210.00       204.16       (4.55)
 Ottawa, ON                         Canada           Byward Market                    CAD      Year   SF          1.03          40.00        38.89      (20.00)
 Saskatoon, SK                      Canada           Broadway Avenue                  CAD      Year   SF          1.03          35.00        34.03       25.00
 Toronto, ON                        Canada           Bloor Street                     CAD      Year   SF          1.03         300.00       291.66        0.00
 Vancouver, BC                      Canada           Robson Street                    CAD      Year   SF          1.03         200.00       194.44        0.00
 Victoria, BC                       Canada           Government Street                CAD      Year   SF          1.03          55.00        53.47       (5.17)
 Atlanta, GA                        United States    Peachtree                        USD      Year   SF          1.00          50.00        50.00       11.11
 Bakersfield, CA                    United States    Ming Avenue                      USD      Year   SF          1.00          12.00        12.00      (33.33)
 Boise, ID                          United States    8th Street                       USD      Year   SF          1.00          22.00        22.00        7.32
 Boston, MA                         United States    Newbury Street                   USD      Year   SF          1.00         200.00       200.00        8.11
 Charleston, SC                     United States    King Street                      USD      Year   SF          1.00          30.00        30.00      (14.29)
 Chicago, IL                        United States    North Michigan Avenue            USD      Year   SF          1.00         250.00       250.00       11.11
 Cincinnati, OH                     United States    Kenwood                          USD      Year   SF          1.00          37.00        37.00       (7.50)
 Columbia, SC                       United States    Gervais Street                   USD      Year   SF          1.00          22.00        22.00      (16.03)
 Columbus, OH                       United States    Easton Town Center               USD      Year   SF          1.00          35.00        35.00        0.00
 Dallas/Ft. Worth, TX               United States    Mockingbird Lane / Preston       USD      Year   SF          1.00          70.00        70.00        7.69
 Denver, CO                         United States    2nd Ave - Cherry Creek North     USD      Year   SF          1.00          35.00        35.00       (5.41)
 Ft. Lauderdale, FL                 United States    Las Olas Boulevard               USD      Year   SF          1.00          40.00        40.00        0.00
 Greenville, SC                     United States    Main Street                      USD      Year   SF          1.00          18.00        18.00      (45.45)
 Hartford, CT                       United States    Glastonbury Boulevard            USD      Year   SF          1.00          28.00        28.00       12.00
 Honolulu, HI                       United States    Kalakaua Avenue                  USD      Year   SF          1.00         300.00       300.00        0.00
 Houston, TX                        United States    Westheimer                       USD      Year   SF          1.00          40.00        40.00      (46.67)
 Las Vegas, NV                      United States    Las Vegas Boulevard              USD      Year   SF          1.00         160.00       160.00        0.00
 Los Angeles, CA                    United States    Rodeo Drive                      USD      Year   SF          1.00         425.00       425.00        0.47
 Miami, FL                          United States    Lincoln Road                     USD      Year   SF          1.00         135.00       135.00       35.00
 Nashville, TN                      United States    Hillsboro Road                   USD      Year   SF          1.00          45.00        45.00       12.50
 New York, NY                       United States    Fifth Avenue                     USD      Year   SF          1.00        2,150.00    2,150.00       72.00
 New York, NY                       United States    Madison Avenue                   USD      Year   SF          1.00         708.00       708.00       20.00
 Orlando, FL                        United States    Sand Lake Road                   USD      Year   SF          1.00          35.00        35.00       16.67
 Philadelphia, PA                   United States    Walnut Street                    USD      Year   SF          1.00          80.00        80.00      (20.00)
 Phoenix, AZ                        United States    Kierland/Scottsdale Road         USD      Year   SF          1.00          38.00        38.00       (7.32)
 Pleasanton/Walnut Creek, CA United States           Main Street, Walnut Creek        USD      Year   SF          1.00          72.00        72.00       33.33
 Portland, OR                       United States    SW Morrison Street               USD      Year   SF          1.00          20.19        20.19      (38.61)
 Reno, NV                           United States    South Virginia Street            USD      Year   SF          1.00          30.00        30.00       25.00
 Sacramento, CA                     United States    Central Business District        USD      Year   SF          1.00          39.00        39.00       30.00
 San Diego, CA                      United States    Prospect/Girard                  USD      Year   SF          1.00         111.20       111.20       42.56


SM = square meters    SF = square feet


                                                                                                                              cOLLiers internAtiOnAL |        p. 3
HIGHLIGHTS | SPRING 2011 | ReTAIl | GlOBAl


 gLOBAL retAiL sUrVeY

                                                                                      MeAsUre
                                                                                                        exchAnge                                    AnnUAL
                                                                               QUOteD   tiMe           rAte (UsD)      QUOteD       UsD rent        chAnge
 citY                          cOUntrY         street                         cUrrencY periOD   Unit   MAr. 31, 2011    rent        psf/YeAr      (LOcAL, %)
 San Francisco, CA             United States   Union Square – Post Street       USD      Year   SF          1.00          340.00       340.00           6.25
 San Jose/Silicon Valley, CA   United States   Santana Row                      USD      Year   SF          1.00           48.00        48.00        (11.11)
 Seattle/Puget Sound, WA       United States   Pine Street                      USD      Year   SF          1.00           44.93        44.93        (18.31)
 Stockton, CA                  United States   Pacific Avenue                   USD      Year   SF          1.00           30.00        30.00          (9.09)
 Tampa, FL                     United States   Hyde Park                        USD      Year   SF          1.00           32.00        32.00           3.23
 Washington, DC                United States   M Street, NW                     USD      Year   SF          1.00          125.00       125.00           4.17
 West Palm Beach, FL           United States   Worth Avenue                     USD      Year   SF          1.00           65.00        65.00        (35.00)
 AsiA pAcific
 Adelaide                      Australia       Rundle Mall                      AUD      Year   SM          1.03         3,000.00      270.43           1.69
 Brisbane                      Australia       Queen Street Mall                AUD      Year   SM          1.03         4,250.00      383.11           6.25
 Melbourne                     Australia       Bourke Street Mall               AUD      Year   SM          1.03         5,500.00      495.78           4.76
 Perth                         Australia       Hay St. and Murray St. Malls     AUD      Year   SM          1.03         3,250.00      292.96           0.00
 Sydney                        Australia       Pitt Street Mall                 AUD      Year   SM          1.03        10,000.00      901.42          11.11
 Beijing                       China           Mall at CWTC                     RMB     Month   SM          6.57         1,350.00      229.16          12.50
 Hong Kong                     China           Russell Street, Causeway Bay     HKD     Month   SF          7.79          980.00     1,509.88          25.64
 Hong Kong                     China           Queen's Road, Central            HKD     Month   SF          7.79          880.00     1,355.81          29.41
 Shanghai                      China           Nanjing Road West                RMB     Month   SM          6.57         1,920.00      325.91          23.87
 Bangalore                     India           Brigade Road                     INR     Month   SF         45.40          317.50        83.92           5.83
 Delhi                         India           Khan Market                      INR     Month   SF         45.40         1,050.00      277.55          16.67
 Tokyo                         Japan           Ginza-Chuo Avenue                JPY     Month   SM         82.87        45,375.00      610.64           0.00
 Auckland                      New Zealand     Queen Street                     NZD      Year   SM          1.32         1,830.00      129.17           1.67
 Wellington                    New Zealand     Lambton Quay                     NZD      Year   SM          1.32         2,100.00      148.22          (1.04)
 Singapore                     Singapore       Orchard Road                     SGD     Month   SF          1.26           38.50       366.00           0.00
 Seoul                         South Korea     Central District                 KRW     Month   SM      1,105.83       247,100.00      249.20          24.67
 Bangkok                       Thailand        Rama I Road                      BHT     Month   SM         30.39         2,650.00       97.26           6.00
 LAtin AMericA
 Buenos Aires                  Argentina       Peatonal Florida                 USD     Month   SM          1.00           90.00       100.37           5.88
 São Paulo                     Brazil          Oscar Freire                     USD     Month   SM          1.00          103.00       114.87          21.18
 Santiago                      Chile           Alonso de Córdova                USD     Month   SM          1.00           51.64        57.59          17.36
 Bogotá                        Colombia        Andino                           USD     Month   SM          1.00           70.00        78.07        (48.15)
 Mexico City                   Mexico          Presidente Mazaryk               USD      Year   SF          1.00           55.00        55.00           0.00
 Panama City                   Panama          Calle 50                         USD     Month   SM          1.00           25.00        27.88           0.00
 Lima                          Peru            Jirón de La Unión                USD     Month   SM          1.00           60.00        66.91           0.00


                                                                                                                            SM = square meters   SF = square feet


p. 4     | cOLLiers internAtiOnAL
HIGHLIGHTS | SPRING 2011 | ReTAIl | GlOBAl


  preMier fAshiOn retAiL cOrriDOr rents (UsD psf/YeAr)

                                                                                                                                      512 offices in
                0        100     200       300       400      500      600      700    800     900    1000   1100   1200   1300


    New York
   Hong Kong
                    Fifth Avenue 2,150.00
                    Russell Street, Causeway Bay 1,509.88
                                                                                                                                      61 countries on
   Hong Kong        Queen's Road, Central 1,355.81                                                                                    6 continents
        Paris       Avenue des Champs-Élysées 1,310.26
                    Old Bond Street 961.85
                                                                                                                                      United States: 125
      London
                                                                                                                                      Canada: 36
       Zurich       Bahnhofstrasse 955.38
                                                                                                                                      Latin America: 18
        Milan       Via Monte Napoleone 943.39                                                                                        Asia Pacific: 194
      Sydney        Pitt Street Mall 901.42                                                                                           EMEA: 117
      London        Oxford Street 761.46                                                                                          •   $1.5 billion in annual revenue
      Geneva        Rue du Rhône 756.24
                                                                                                                                  •   978.6 million square feet under
    New York        Madison Avenue 708.00                                                                                             management
       Rome         Via Condotti 707.54
                                                                                                                                  •   More than 12,500 professionals
     Moscow         Tverskaya Street 688.67
       Tokyo        Ginza-Chuo Street 610.64
                                                                                                                                      cOLLiers internAtiOnAL
      Vienna                                                 Graben, Kohlmarkt, Kärntner Strasse 550.31
      Munich                                                 Kau ngerstrasse 518.86                                                   601 Union Street, Suite 5300
                                                                                                                                      Seattle, WA 98101
    Stuttgart                                                Königstrasse 503.14
                                                                                                                                      teL +1 206 223 0866
   Melbourne                                               Bourke Street Mall 495.78
                                                                                                                                      fAx +1 206 757 9427
      Riyadh                                               `King Fahad Road / Olaya Road 446.95

 Los Angeles                                             Rodeo Drive 425.00

    Frankfurt                                            Zeil 424.52                                                                  fOr MOre infOrMAtiOn
      Dublin                                           Grafton Street 422.95
                                                                                                                                      Ross J. Moore
    Brisbane                                         Queen Street Mall 383.11                                                         Chief Economist | USA
   Dusseldorf                                        Königsallee 377.36                                                               teL +1 617 722 0221
    Hamburg                                        Spitalerstrasse 377.36                                                             eMAiL ross.moore@colliers.com
   Singapore                                       Orchard Road 366.00

       Berlin                                      Tauentzienstrasse 345.91

San Francisco                                    Union Square - Post Street 340.00                                                    Copyright © 2011 Colliers International.

    Shanghai                                     Nanjing Road West 325.91                                                             The information contained herein has been obtained
                                                 Nevsky Prospekt 320.08                                                               from sources deemed reliable. While every reasonable
St Petersburg
                                                                                                                                      effort has been made to ensure its accuracy, we cannot
 Copenhagen                                      Østergade 316.19                                                                     guarantee it. No responsibility is assumed for any
                                                                                                                                      inaccuracies. Readers are encouraged to consult their
      Prague                                    Na Příkopě 314.46
                                                                                                                                      professional advisors prior to acting on any of the
         Kyiv                                   Vulitsya Khreshchatyk 303.46                                                          material contained in this report.

    Honolulu                                    Kalakaua Avenue 300.00

  Amsterdam                                     Kalverstraat 294.81

        Perth                                  Hay Street and Murray Street Malls 292.96

      Toronto                                  Bloor Street 291.66

      Athens                                  Ermou Street 283.02

        Delhi                                 Khan Market 277.55

      Madrid                                  Puerta del Sol Preciados 275.15

     Adelaide                               Rundle Mall 270.43

     Helsinki                              Aleksanterinkatu 267.29

     Glasgow                               Buchanan Street 256.49

     Chicago                               North Michigan Avenue 250.00

       Seoul                              Central District 249.20

  Manchester                              Market Street 240.46

        Oslo                            Karl Johans Gate 232.59

      Beijing                           Mall at CWTC 229.16

 Birmingham                            High Street / New Street 224.43

   Stockholm                           Biblioteksgatan 219.78
                                                                                                                                                Accelerating success.
                0        100     200       300       400      500      600      700    800     900    1000   1100   1200   1300


www.colliers.com

Mais conteúdo relacionado

Mais de Coy Davidson

2017 Healthcare Marketplace
2017 Healthcare Marketplace2017 Healthcare Marketplace
2017 Healthcare MarketplaceCoy Davidson
 
Colliers International Houston Trends 2017
Colliers International Houston Trends 2017Colliers International Houston Trends 2017
Colliers International Houston Trends 2017Coy Davidson
 
2016 Houston Economic Outlook
2016 Houston Economic Outlook2016 Houston Economic Outlook
2016 Houston Economic OutlookCoy Davidson
 
2016 Healthcare Real Estate Marketplace
2016 Healthcare Real Estate Marketplace2016 Healthcare Real Estate Marketplace
2016 Healthcare Real Estate MarketplaceCoy Davidson
 
Houston Healthcare Real Estate Market Report - Year End 2015
Houston Healthcare Real Estate Market Report - Year End 2015Houston Healthcare Real Estate Market Report - Year End 2015
Houston Healthcare Real Estate Market Report - Year End 2015Coy Davidson
 
Top Office Metros 2015 4Q
Top Office Metros 2015 4Q Top Office Metros 2015 4Q
Top Office Metros 2015 4Q Coy Davidson
 
Colliers Houston Trends 2016 slides
Colliers Houston Trends 2016 slidesColliers Houston Trends 2016 slides
Colliers Houston Trends 2016 slidesCoy Davidson
 
Cre tech year end report 2015
Cre tech year end report 2015Cre tech year end report 2015
Cre tech year end report 2015Coy Davidson
 
Q4 2014 San Francisco Office Report
Q4 2014 San Francisco Office ReportQ4 2014 San Francisco Office Report
Q4 2014 San Francisco Office ReportCoy Davidson
 
Houston Medical Office Report and Healthcare Commentary
Houston Medical Office Report and Healthcare CommentaryHouston Medical Office Report and Healthcare Commentary
Houston Medical Office Report and Healthcare CommentaryCoy Davidson
 
Boma standards-update
Boma standards-update Boma standards-update
Boma standards-update Coy Davidson
 
SIOR: Understanding the Common Factor
SIOR: Understanding the Common FactorSIOR: Understanding the Common Factor
SIOR: Understanding the Common FactorCoy Davidson
 
North American Industrial Outlook Q4 13
North American Industrial Outlook Q4 13North American Industrial Outlook Q4 13
North American Industrial Outlook Q4 13Coy Davidson
 
Colliers Medical Office-Update
Colliers Medical Office-Update Colliers Medical Office-Update
Colliers Medical Office-Update Coy Davidson
 
Houston Medical Office Report YE 2013
Houston Medical Office Report YE 2013Houston Medical Office Report YE 2013
Houston Medical Office Report YE 2013Coy Davidson
 
The woodlands Q4 2013 Office Market Snapshot
The woodlands Q4 2013 Office Market SnapshotThe woodlands Q4 2013 Office Market Snapshot
The woodlands Q4 2013 Office Market SnapshotCoy Davidson
 
Colliers US Medical Office Report 2014 Outlook
Colliers US Medical Office Report 2014 OutlookColliers US Medical Office Report 2014 Outlook
Colliers US Medical Office Report 2014 OutlookCoy Davidson
 
Houston Trends 2014 Slide Deck
Houston Trends 2014 Slide DeckHouston Trends 2014 Slide Deck
Houston Trends 2014 Slide DeckCoy Davidson
 
Colliers North American Port Analysis 2H 2013
Colliers North American Port Analysis 2H 2013Colliers North American Port Analysis 2H 2013
Colliers North American Port Analysis 2H 2013Coy Davidson
 

Mais de Coy Davidson (20)

2017 Healthcare Marketplace
2017 Healthcare Marketplace2017 Healthcare Marketplace
2017 Healthcare Marketplace
 
Colliers International Houston Trends 2017
Colliers International Houston Trends 2017Colliers International Houston Trends 2017
Colliers International Houston Trends 2017
 
2016 Houston Economic Outlook
2016 Houston Economic Outlook2016 Houston Economic Outlook
2016 Houston Economic Outlook
 
2016 Healthcare Real Estate Marketplace
2016 Healthcare Real Estate Marketplace2016 Healthcare Real Estate Marketplace
2016 Healthcare Real Estate Marketplace
 
Houston Healthcare Real Estate Market Report - Year End 2015
Houston Healthcare Real Estate Market Report - Year End 2015Houston Healthcare Real Estate Market Report - Year End 2015
Houston Healthcare Real Estate Market Report - Year End 2015
 
Top Office Metros 2015 4Q
Top Office Metros 2015 4Q Top Office Metros 2015 4Q
Top Office Metros 2015 4Q
 
Colliers Houston Trends 2016 slides
Colliers Houston Trends 2016 slidesColliers Houston Trends 2016 slides
Colliers Houston Trends 2016 slides
 
Cre tech year end report 2015
Cre tech year end report 2015Cre tech year end report 2015
Cre tech year end report 2015
 
Q4 2014 San Francisco Office Report
Q4 2014 San Francisco Office ReportQ4 2014 San Francisco Office Report
Q4 2014 San Francisco Office Report
 
Houston Medical Office Report and Healthcare Commentary
Houston Medical Office Report and Healthcare CommentaryHouston Medical Office Report and Healthcare Commentary
Houston Medical Office Report and Healthcare Commentary
 
Colliers
Colliers Colliers
Colliers
 
Boma standards-update
Boma standards-update Boma standards-update
Boma standards-update
 
SIOR: Understanding the Common Factor
SIOR: Understanding the Common FactorSIOR: Understanding the Common Factor
SIOR: Understanding the Common Factor
 
North American Industrial Outlook Q4 13
North American Industrial Outlook Q4 13North American Industrial Outlook Q4 13
North American Industrial Outlook Q4 13
 
Colliers Medical Office-Update
Colliers Medical Office-Update Colliers Medical Office-Update
Colliers Medical Office-Update
 
Houston Medical Office Report YE 2013
Houston Medical Office Report YE 2013Houston Medical Office Report YE 2013
Houston Medical Office Report YE 2013
 
The woodlands Q4 2013 Office Market Snapshot
The woodlands Q4 2013 Office Market SnapshotThe woodlands Q4 2013 Office Market Snapshot
The woodlands Q4 2013 Office Market Snapshot
 
Colliers US Medical Office Report 2014 Outlook
Colliers US Medical Office Report 2014 OutlookColliers US Medical Office Report 2014 Outlook
Colliers US Medical Office Report 2014 Outlook
 
Houston Trends 2014 Slide Deck
Houston Trends 2014 Slide DeckHouston Trends 2014 Slide Deck
Houston Trends 2014 Slide Deck
 
Colliers North American Port Analysis 2H 2013
Colliers North American Port Analysis 2H 2013Colliers North American Port Analysis 2H 2013
Colliers North American Port Analysis 2H 2013
 

Último

Sankla East World Hadapsar Pune Brochure.pdf
Sankla East World Hadapsar Pune Brochure.pdfSankla East World Hadapsar Pune Brochure.pdf
Sankla East World Hadapsar Pune Brochure.pdfabbu831446
 
Goyal Ganga One Boat Club Pune Brochure.pdf
Goyal Ganga One Boat Club Pune Brochure.pdfGoyal Ganga One Boat Club Pune Brochure.pdf
Goyal Ganga One Boat Club Pune Brochure.pdfabbu831446
 
LCAR Real Estate Practice - Real Estate Math Concepts II
LCAR Real Estate Practice - Real Estate Math Concepts IILCAR Real Estate Practice - Real Estate Math Concepts II
LCAR Real Estate Practice - Real Estate Math Concepts IITom Blefko
 
Assetz Melodies Of Life off Hosa Road Bangalore.pdf
Assetz Melodies Of Life off Hosa Road Bangalore.pdfAssetz Melodies Of Life off Hosa Road Bangalore.pdf
Assetz Melodies Of Life off Hosa Road Bangalore.pdfashiyadav24
 
Managing Uncertainty: Newman George Leech's Real Estate Finance Strategy
Managing Uncertainty: Newman George Leech's Real Estate Finance StrategyManaging Uncertainty: Newman George Leech's Real Estate Finance Strategy
Managing Uncertainty: Newman George Leech's Real Estate Finance StrategyNewman George Leech
 
Shriram Hebbal One Kempapura Bangalore E- Brochure.pdf
Shriram Hebbal One Kempapura Bangalore E- Brochure.pdfShriram Hebbal One Kempapura Bangalore E- Brochure.pdf
Shriram Hebbal One Kempapura Bangalore E- Brochure.pdffaheemali990101
 
SVN Live 4.8.24 Weekly Property Broadcast
SVN Live 4.8.24 Weekly Property BroadcastSVN Live 4.8.24 Weekly Property Broadcast
SVN Live 4.8.24 Weekly Property BroadcastSVN International Corp.
 
Prestige Sanctuary Nandi Hills Bangalore.pdf
Prestige Sanctuary Nandi Hills Bangalore.pdfPrestige Sanctuary Nandi Hills Bangalore.pdf
Prestige Sanctuary Nandi Hills Bangalore.pdfashiyadav24
 
Lancaster Market Expenses and Company Worksheet
Lancaster Market Expenses and Company WorksheetLancaster Market Expenses and Company Worksheet
Lancaster Market Expenses and Company WorksheetTom Blefko
 
_Purva Blubelle Magadi Road E-Brochure.pdf
_Purva Blubelle Magadi Road E-Brochure.pdf_Purva Blubelle Magadi Road E-Brochure.pdf
_Purva Blubelle Magadi Road E-Brochure.pdffaheemali990101
 
Purva Park Hill Kanakapura Road Bangalore.pdf
Purva Park Hill  Kanakapura Road Bangalore.pdfPurva Park Hill  Kanakapura Road Bangalore.pdf
Purva Park Hill Kanakapura Road Bangalore.pdfashiyadav24
 
What is Affordable Housing? Bristol Civic Society April 2024
What is Affordable Housing? Bristol Civic Society April 2024What is Affordable Housing? Bristol Civic Society April 2024
What is Affordable Housing? Bristol Civic Society April 2024Paul Smith
 
LCAR Unit 18 - Sales Contracts - 14th Edition Revised
LCAR Unit 18 - Sales Contracts - 14th Edition RevisedLCAR Unit 18 - Sales Contracts - 14th Edition Revised
LCAR Unit 18 - Sales Contracts - 14th Edition RevisedTom Blefko
 
Dubai Real Estate vs Other Global Markets-a-Comparative-Analysis
Dubai Real Estate vs Other Global Markets-a-Comparative-AnalysisDubai Real Estate vs Other Global Markets-a-Comparative-Analysis
Dubai Real Estate vs Other Global Markets-a-Comparative-AnalysisHomeStation1
 
Honer Richmont Hyderabad E brochure - A Life With A View
Honer Richmont Hyderabad E brochure - A Life With A ViewHoner Richmont Hyderabad E brochure - A Life With A View
Honer Richmont Hyderabad E brochure - A Life With A ViewAhanundefined
 
Kohinoor Hinjewadi Phase 2 In Pune - PDF.pdf
Kohinoor Hinjewadi Phase 2 In Pune - PDF.pdfKohinoor Hinjewadi Phase 2 In Pune - PDF.pdf
Kohinoor Hinjewadi Phase 2 In Pune - PDF.pdfmonikasharma630
 
Listing Turkey - Viva Perla Maltepe Catalog
Listing Turkey - Viva Perla Maltepe CatalogListing Turkey - Viva Perla Maltepe Catalog
Listing Turkey - Viva Perla Maltepe CatalogListing Turkey
 
Listing Turkey Green life Istanbul Eyup Catalog
Listing Turkey Green life Istanbul Eyup CatalogListing Turkey Green life Istanbul Eyup Catalog
Listing Turkey Green life Istanbul Eyup CatalogListing Turkey
 
Goyal Orchid Life East Bangalore.pdf.pdf
Goyal Orchid Life East Bangalore.pdf.pdfGoyal Orchid Life East Bangalore.pdf.pdf
Goyal Orchid Life East Bangalore.pdf.pdfkratirudram
 
SSPL The Strand Abodes Pune Brochure.pdf
SSPL The Strand Abodes Pune Brochure.pdfSSPL The Strand Abodes Pune Brochure.pdf
SSPL The Strand Abodes Pune Brochure.pdfkishor21012022
 

Último (20)

Sankla East World Hadapsar Pune Brochure.pdf
Sankla East World Hadapsar Pune Brochure.pdfSankla East World Hadapsar Pune Brochure.pdf
Sankla East World Hadapsar Pune Brochure.pdf
 
Goyal Ganga One Boat Club Pune Brochure.pdf
Goyal Ganga One Boat Club Pune Brochure.pdfGoyal Ganga One Boat Club Pune Brochure.pdf
Goyal Ganga One Boat Club Pune Brochure.pdf
 
LCAR Real Estate Practice - Real Estate Math Concepts II
LCAR Real Estate Practice - Real Estate Math Concepts IILCAR Real Estate Practice - Real Estate Math Concepts II
LCAR Real Estate Practice - Real Estate Math Concepts II
 
Assetz Melodies Of Life off Hosa Road Bangalore.pdf
Assetz Melodies Of Life off Hosa Road Bangalore.pdfAssetz Melodies Of Life off Hosa Road Bangalore.pdf
Assetz Melodies Of Life off Hosa Road Bangalore.pdf
 
Managing Uncertainty: Newman George Leech's Real Estate Finance Strategy
Managing Uncertainty: Newman George Leech's Real Estate Finance StrategyManaging Uncertainty: Newman George Leech's Real Estate Finance Strategy
Managing Uncertainty: Newman George Leech's Real Estate Finance Strategy
 
Shriram Hebbal One Kempapura Bangalore E- Brochure.pdf
Shriram Hebbal One Kempapura Bangalore E- Brochure.pdfShriram Hebbal One Kempapura Bangalore E- Brochure.pdf
Shriram Hebbal One Kempapura Bangalore E- Brochure.pdf
 
SVN Live 4.8.24 Weekly Property Broadcast
SVN Live 4.8.24 Weekly Property BroadcastSVN Live 4.8.24 Weekly Property Broadcast
SVN Live 4.8.24 Weekly Property Broadcast
 
Prestige Sanctuary Nandi Hills Bangalore.pdf
Prestige Sanctuary Nandi Hills Bangalore.pdfPrestige Sanctuary Nandi Hills Bangalore.pdf
Prestige Sanctuary Nandi Hills Bangalore.pdf
 
Lancaster Market Expenses and Company Worksheet
Lancaster Market Expenses and Company WorksheetLancaster Market Expenses and Company Worksheet
Lancaster Market Expenses and Company Worksheet
 
_Purva Blubelle Magadi Road E-Brochure.pdf
_Purva Blubelle Magadi Road E-Brochure.pdf_Purva Blubelle Magadi Road E-Brochure.pdf
_Purva Blubelle Magadi Road E-Brochure.pdf
 
Purva Park Hill Kanakapura Road Bangalore.pdf
Purva Park Hill  Kanakapura Road Bangalore.pdfPurva Park Hill  Kanakapura Road Bangalore.pdf
Purva Park Hill Kanakapura Road Bangalore.pdf
 
What is Affordable Housing? Bristol Civic Society April 2024
What is Affordable Housing? Bristol Civic Society April 2024What is Affordable Housing? Bristol Civic Society April 2024
What is Affordable Housing? Bristol Civic Society April 2024
 
LCAR Unit 18 - Sales Contracts - 14th Edition Revised
LCAR Unit 18 - Sales Contracts - 14th Edition RevisedLCAR Unit 18 - Sales Contracts - 14th Edition Revised
LCAR Unit 18 - Sales Contracts - 14th Edition Revised
 
Dubai Real Estate vs Other Global Markets-a-Comparative-Analysis
Dubai Real Estate vs Other Global Markets-a-Comparative-AnalysisDubai Real Estate vs Other Global Markets-a-Comparative-Analysis
Dubai Real Estate vs Other Global Markets-a-Comparative-Analysis
 
Honer Richmont Hyderabad E brochure - A Life With A View
Honer Richmont Hyderabad E brochure - A Life With A ViewHoner Richmont Hyderabad E brochure - A Life With A View
Honer Richmont Hyderabad E brochure - A Life With A View
 
Kohinoor Hinjewadi Phase 2 In Pune - PDF.pdf
Kohinoor Hinjewadi Phase 2 In Pune - PDF.pdfKohinoor Hinjewadi Phase 2 In Pune - PDF.pdf
Kohinoor Hinjewadi Phase 2 In Pune - PDF.pdf
 
Listing Turkey - Viva Perla Maltepe Catalog
Listing Turkey - Viva Perla Maltepe CatalogListing Turkey - Viva Perla Maltepe Catalog
Listing Turkey - Viva Perla Maltepe Catalog
 
Listing Turkey Green life Istanbul Eyup Catalog
Listing Turkey Green life Istanbul Eyup CatalogListing Turkey Green life Istanbul Eyup Catalog
Listing Turkey Green life Istanbul Eyup Catalog
 
Goyal Orchid Life East Bangalore.pdf.pdf
Goyal Orchid Life East Bangalore.pdf.pdfGoyal Orchid Life East Bangalore.pdf.pdf
Goyal Orchid Life East Bangalore.pdf.pdf
 
SSPL The Strand Abodes Pune Brochure.pdf
SSPL The Strand Abodes Pune Brochure.pdfSSPL The Strand Abodes Pune Brochure.pdf
SSPL The Strand Abodes Pune Brochure.pdf
 

Spring 2011 Global Retail Highlights Report Summarizes Luxury Retail Rebound

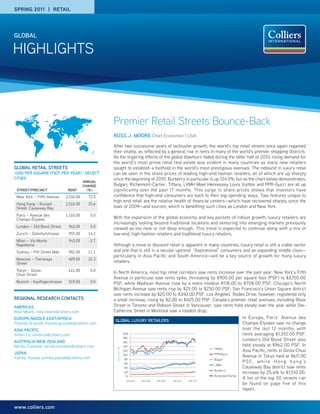
  • 1. SPRING 2011 | RETAIL gLOBAL HIGHLIGHTS Premier Retail Streets Bounce-Back rOss J. MOOre Chief Economist | USA After two successive years of lackluster growth, the world’s top retail streets once again regained their vitality, as reflected by a general rise in rents in many of the world’s premier shopping districts. As the lingering effects of the global downturn faded during the latter half of 2010, rising demand for the world’s most prime retail real estate was evident in many countries as many new retailers gLOBAL retAiL streets sought to establish a foothold in the world’s most prestigious avenues. The rebound in luxury retail (UsD per sQUAre fOOt per YeAr) - seLect can be seen in the share prices of leading high-end fashion retailers, all of which are up sharply cities since the beginning of 2010. Burberry in particular is up 124.5%, but as the chart below demonstrates, AnnUAL chAnge Bulgari, Richemont-Cartier, Tiffany, LVMH Moet Hennessey Louis Vuitton and PPR-Gucci are all up street/precinct rent (%) significantly over the past 17 months. This surge in share prices shows that investors have New York – Fifth Avenue 2,150.00 72.0 confidence that high-end consumers are back to their big-spending ways. Two features unique to high-end retail are the relative health of financial centers—which have recovered sharply since the Hong Kong – Russell 1,510.00 25.6 Street, Causeway Bay lows of 2009—and tourism, which is benefiting such cities as London and New York. Paris – Avenue des 1,310.00 0.0 Champs-Élysées With the expansion of the global economy and key pockets of robust growth, luxury retailers are increasingly looking beyond traditional locations and venturing into emerging markets previously London – Old Bond Street 962.00 0.0 viewed as too new or not deep enough. This trend is expected to continue along with a mix of Zurich – Bahnhofstrasse 955.00 14.2 low-end, high-fashion retailers and traditional luxury retailers. Milan – Via Monte 943.00 -2.7 Napoleone Although a move to discount retail is apparent in many countries, luxury retail is still a viable sector Sydney – Pitt Street Mall 901.00 11.1 and one that is still in a secular uptrend. “Aspirational” consumers and an expanding middle class— particularly in Asia Pacific and South America—will be a key source of growth for many luxury Moscow – Tverskaya 689.00 21.3 Street retailers. Tokyo – Ginza- 611.00 0.0 In North America, most top retail corridors saw rents increase over the past year. New York’s Fifth Chuo Street Avenue in particular saw rents spike, increasing by $900.00 per square foot (PSF) to $2,150.00 Munich – Kaufingerstrasse 519.00 0.0 PSF, while Madison Avenue rose by a more modest $118.00 to $708.00 PSF. Chicago’s North Michigan Avenue saw rents rise by $25.00 to $250.00 PSF; San Francisco’s Union Square district saw rents increase by $20.00 to $340.00 PSF. Los Angeles’ Rodeo Drive, however, registered only regiOnAL reseArch cOntActs a small increase, rising by $2.00 to $425.00 PSF. Canada’s premier retail avenues, including Bloor AMericAs Street in Toronto and Robson Street in Vancouver, saw rents hold steady over the year while Ste- Ross Moore, ross.moore@colliers.com Catherine Street in Montreal saw a modest drop. eUrOpe/MiDDLe eAst/AfricA In Europe, Paris’ Avenue des gLOBAL LUxUrY retAiLers Thomas Grounds, thomas.grounds@colliers.com Champs-Élysées saw no change AsiA pAcific over the last 12 months, with Simon Lo, simon.lo@colliers.com rents averaging $1,310.00 PSF. AUstrALiA/new zeALAnD London’s Old Bond Street also Nerida Conisbee, nerida.conisbee@colliers.com held steady at $962.00 PSF. In Share Price, USD Asia Pacific, rents in Ginza-Chuo JApAn Yumiko Yasuda, yumiko.yasuda@colliers.com Avenue in Tokyo held at $611.00 P S F, w h i l e H o n g K o n g ’s Causeway Bay district saw rents increase by 25.6% to $1,510.00. A list of the top 50 streets can be found on page five of this report. www.colliers.com
  • 2. HIGHLIGHTS | SPRING 2011 | ReTAIl | GlOBAl gLOBAL retAiL sUrVeY MeAsUre exchAnge AnnUAL QUOteD tiMe rAte (UsD) QUOteD UsD rent chAnge citY cOUntrY street cUrrencY periOD Unit MAr. 31, 2011 rent psf/YeAr (LOcAL, %) eUrOpe, MiDDLe eAst, AfricA Tirana Albania Myslym Shyri EUR Year SM 0.71 50.00 78.62 (11.11) Vienna Austria Graben, Kohlmarkt, Kärntner EUR Month SM 0.71 350.00 550.31 0.00 Strasse Minsk Belarus Nezavisimosti Avenue EUR Month SM 0.71 45.00 70.75 (18.18) Sofia Bulgaria Vitosha Blv EUR Month SM 0.71 65.00 102.20 (13.33) Zagreb Croatia Ilica Street EUR Month SM 0.71 45.00 70.75 0.00 Prague Czech Republic Na Příkopě EUR Month SM 0.71 200.00 314.46 17.65 Copenhagen Denmark Østergade (Strøget) DKK Year SM 5.29 18,000.00 316.19 0.00 Tallinn Estonia Viru Street EUR Month SM 0.71 25.00 39.31 4.17 Helsinki Finland Aleksanterinkatu EUR Month SM 0.71 170.00 267.29 (5.56) Paris France Avenue des Champs-Élysées EUR Month SM 0.71 833.33 1,310.26 0.00 Berlin Germany Tauentzienstrasse EUR Month SM 0.71 220.00 345.91 0.00 Düsseldorf Germany Königsallee EUR Month SM 0.71 240.00 377.36 4.35 Frankfurt Germany Zeil EUR Month SM 0.71 270.00 424.52 0.00 Hamburg Germany Spitalerstrasse EUR Month SM 0.71 240.00 377.36 9.09 Munich Germany Kaufingerstrasse EUR Month SM 0.71 330.00 518.86 0.00 Stuttgart Germany Königstrasse EUR Month SM 0.71 320.00 503.14 0.00 Athens Greece Ermou Street EUR Month SM 0.71 180.00 283.02 (10.00) Budapest Hungary Váci Utca EUR Month SM 0.71 110.00 172.95 (12.00) Dublin Ireland Grafton Street EUR Year SF 0.71 300.00 422.95 (10.00) Milan Italy Via Monte Napoleone EUR Month SM 0.71 600.00 943.39 (2.70) Rome Italy Via Condotti EUR Month SM 0.71 450.00 707.54 8.00 Riga Latvia Barona Street EUR Month SM 0.71 20.00 31.45 33.33 Vilnius Lithuania Didzioji Street EUR Month SM 0.71 32.00 50.31 6.67 Amsterdam Netherlands Kalverstraat EUR Month SM 0.71 187.50 294.50 (2.17) Rotterdam Netherlands Lijnbaan EUR Month SM 0.71 108.30 170.28 (0.03) The Hague Netherlands Spuistraat EUR Month SM 0.71 104.20 163.84 0.03 Oslo Norway Karl Johans Gate NOK Year SM 5.59 14,000.00 232.59 3.70 Warsaw Poland Ulica Nowy Świat EUR Month SM 0.71 86.00 135.22 (14.00) Bucharest Romania Magheru Street EUR Month SM 0.71 75.00 117.92 (16.67) Moscow Russia Tverskaya Street EUR Year SM 0.71 438.00 688.67 21.33 St. Petersburg Russia Nevsky Prospekt EUR Year SM 0.71 203.57 320.08 19.75 Riyadh Saudi Arabia King Fahad Road / Olaya Road SAR Year SM 0.62 3,000.00 446.95 0.00 Belgrade Serbia Kneza Mihaila Street EUR Month SM 0.71 110.00 172.95 0.00 Bratislava Slovakia Obchodná Street EUR Month SM 0.71 40.00 62.89 (11.11) Madrid Spain Puerta del Sol Preciados EUR Month SM 0.71 175.00 275.15 9.38 Stockholm Sweden Biblioteksgatan SEK Year SM 6.34 15,000.00 219.78 7.14 Geneva Switzerland Rue du Rhône CHF Year SM 0.92 7,500.00 756.24 0.00 Zurich Switzerland Bahnhofstrasse CHF Year SM 0.92 9,475.00 955.38 14.16 Kyiv Ukraine Vulitsya Khreshchatyk EUR Month SM 0.71 193.00 303.46 30.47 Abu Dhabi UAE Khalifa Street USD Month SM 1.00 40.00 44.61 Dubai UAE Sheikh Zayed Road USD Month SM 1.00 16.00 17.84 3.32 Birmingham United Kingdom High Street / New Street GBP Year SF 0.62 140.00 224.43 5.00 Edinburgh United Kingdom Princes Street GBP Year SF 0.62 110.00 176.34 4.46 SM = square meters SF = square feet p. 2 | cOLLiers internAtiOnAL
  • 3. HIGHLIGHTS | SPRING 2011 | ReTAIl | GlOBAl gLOBAL retAiL sUrVeY MeAsUre exchAnge AnnUAL QUOteD tiMe rAte (UsD) QUOteD UsD rent chAnge citY cOUntrY street cUrrencY periOD Unit MAr. 31, 2011 rent psf/YeAr (LOcAL, %) Glasgow United Kingdom Buchanan Street GBP Year SF 0.62 160.00 256.49 9.09 Leeds United Kingdom Briggate GBP Year SF 0.62 126.67 203.06 0.00 London United Kingdom Old Bond Street GBP Year SF 0.62 600.00 961.85 0.00 London United Kingdom Oxford Street GBP Year SF 0.62 475.00 761.46 0.00 Manchester United Kingdom Market Street GBP Year SF 0.62 150.00 240.46 0.00 nOrth AMericA Calgary, AB Canada Uptown 17th Avenue CAD Year SF 1.03 55.00 53.47 (26.67) Edmonton, AB Canada Downtown Edmonton CAD Year SF 1.03 45.00 43.75 0.00 Halifax, NS Canada Spring Garden Road CAD Year SF 1.03 50.00 48.61 0.00 Montreal, QC Canada Ste-Catherine Street West CAD Year SF 1.03 210.00 204.16 (4.55) Ottawa, ON Canada Byward Market CAD Year SF 1.03 40.00 38.89 (20.00) Saskatoon, SK Canada Broadway Avenue CAD Year SF 1.03 35.00 34.03 25.00 Toronto, ON Canada Bloor Street CAD Year SF 1.03 300.00 291.66 0.00 Vancouver, BC Canada Robson Street CAD Year SF 1.03 200.00 194.44 0.00 Victoria, BC Canada Government Street CAD Year SF 1.03 55.00 53.47 (5.17) Atlanta, GA United States Peachtree USD Year SF 1.00 50.00 50.00 11.11 Bakersfield, CA United States Ming Avenue USD Year SF 1.00 12.00 12.00 (33.33) Boise, ID United States 8th Street USD Year SF 1.00 22.00 22.00 7.32 Boston, MA United States Newbury Street USD Year SF 1.00 200.00 200.00 8.11 Charleston, SC United States King Street USD Year SF 1.00 30.00 30.00 (14.29) Chicago, IL United States North Michigan Avenue USD Year SF 1.00 250.00 250.00 11.11 Cincinnati, OH United States Kenwood USD Year SF 1.00 37.00 37.00 (7.50) Columbia, SC United States Gervais Street USD Year SF 1.00 22.00 22.00 (16.03) Columbus, OH United States Easton Town Center USD Year SF 1.00 35.00 35.00 0.00 Dallas/Ft. Worth, TX United States Mockingbird Lane / Preston USD Year SF 1.00 70.00 70.00 7.69 Denver, CO United States 2nd Ave - Cherry Creek North USD Year SF 1.00 35.00 35.00 (5.41) Ft. Lauderdale, FL United States Las Olas Boulevard USD Year SF 1.00 40.00 40.00 0.00 Greenville, SC United States Main Street USD Year SF 1.00 18.00 18.00 (45.45) Hartford, CT United States Glastonbury Boulevard USD Year SF 1.00 28.00 28.00 12.00 Honolulu, HI United States Kalakaua Avenue USD Year SF 1.00 300.00 300.00 0.00 Houston, TX United States Westheimer USD Year SF 1.00 40.00 40.00 (46.67) Las Vegas, NV United States Las Vegas Boulevard USD Year SF 1.00 160.00 160.00 0.00 Los Angeles, CA United States Rodeo Drive USD Year SF 1.00 425.00 425.00 0.47 Miami, FL United States Lincoln Road USD Year SF 1.00 135.00 135.00 35.00 Nashville, TN United States Hillsboro Road USD Year SF 1.00 45.00 45.00 12.50 New York, NY United States Fifth Avenue USD Year SF 1.00 2,150.00 2,150.00 72.00 New York, NY United States Madison Avenue USD Year SF 1.00 708.00 708.00 20.00 Orlando, FL United States Sand Lake Road USD Year SF 1.00 35.00 35.00 16.67 Philadelphia, PA United States Walnut Street USD Year SF 1.00 80.00 80.00 (20.00) Phoenix, AZ United States Kierland/Scottsdale Road USD Year SF 1.00 38.00 38.00 (7.32) Pleasanton/Walnut Creek, CA United States Main Street, Walnut Creek USD Year SF 1.00 72.00 72.00 33.33 Portland, OR United States SW Morrison Street USD Year SF 1.00 20.19 20.19 (38.61) Reno, NV United States South Virginia Street USD Year SF 1.00 30.00 30.00 25.00 Sacramento, CA United States Central Business District USD Year SF 1.00 39.00 39.00 30.00 San Diego, CA United States Prospect/Girard USD Year SF 1.00 111.20 111.20 42.56 SM = square meters SF = square feet cOLLiers internAtiOnAL | p. 3
  • 4. HIGHLIGHTS | SPRING 2011 | ReTAIl | GlOBAl gLOBAL retAiL sUrVeY MeAsUre exchAnge AnnUAL QUOteD tiMe rAte (UsD) QUOteD UsD rent chAnge citY cOUntrY street cUrrencY periOD Unit MAr. 31, 2011 rent psf/YeAr (LOcAL, %) San Francisco, CA United States Union Square – Post Street USD Year SF 1.00 340.00 340.00 6.25 San Jose/Silicon Valley, CA United States Santana Row USD Year SF 1.00 48.00 48.00 (11.11) Seattle/Puget Sound, WA United States Pine Street USD Year SF 1.00 44.93 44.93 (18.31) Stockton, CA United States Pacific Avenue USD Year SF 1.00 30.00 30.00 (9.09) Tampa, FL United States Hyde Park USD Year SF 1.00 32.00 32.00 3.23 Washington, DC United States M Street, NW USD Year SF 1.00 125.00 125.00 4.17 West Palm Beach, FL United States Worth Avenue USD Year SF 1.00 65.00 65.00 (35.00) AsiA pAcific Adelaide Australia Rundle Mall AUD Year SM 1.03 3,000.00 270.43 1.69 Brisbane Australia Queen Street Mall AUD Year SM 1.03 4,250.00 383.11 6.25 Melbourne Australia Bourke Street Mall AUD Year SM 1.03 5,500.00 495.78 4.76 Perth Australia Hay St. and Murray St. Malls AUD Year SM 1.03 3,250.00 292.96 0.00 Sydney Australia Pitt Street Mall AUD Year SM 1.03 10,000.00 901.42 11.11 Beijing China Mall at CWTC RMB Month SM 6.57 1,350.00 229.16 12.50 Hong Kong China Russell Street, Causeway Bay HKD Month SF 7.79 980.00 1,509.88 25.64 Hong Kong China Queen's Road, Central HKD Month SF 7.79 880.00 1,355.81 29.41 Shanghai China Nanjing Road West RMB Month SM 6.57 1,920.00 325.91 23.87 Bangalore India Brigade Road INR Month SF 45.40 317.50 83.92 5.83 Delhi India Khan Market INR Month SF 45.40 1,050.00 277.55 16.67 Tokyo Japan Ginza-Chuo Avenue JPY Month SM 82.87 45,375.00 610.64 0.00 Auckland New Zealand Queen Street NZD Year SM 1.32 1,830.00 129.17 1.67 Wellington New Zealand Lambton Quay NZD Year SM 1.32 2,100.00 148.22 (1.04) Singapore Singapore Orchard Road SGD Month SF 1.26 38.50 366.00 0.00 Seoul South Korea Central District KRW Month SM 1,105.83 247,100.00 249.20 24.67 Bangkok Thailand Rama I Road BHT Month SM 30.39 2,650.00 97.26 6.00 LAtin AMericA Buenos Aires Argentina Peatonal Florida USD Month SM 1.00 90.00 100.37 5.88 São Paulo Brazil Oscar Freire USD Month SM 1.00 103.00 114.87 21.18 Santiago Chile Alonso de Córdova USD Month SM 1.00 51.64 57.59 17.36 Bogotá Colombia Andino USD Month SM 1.00 70.00 78.07 (48.15) Mexico City Mexico Presidente Mazaryk USD Year SF 1.00 55.00 55.00 0.00 Panama City Panama Calle 50 USD Month SM 1.00 25.00 27.88 0.00 Lima Peru Jirón de La Unión USD Month SM 1.00 60.00 66.91 0.00 SM = square meters SF = square feet p. 4 | cOLLiers internAtiOnAL
  • 5. HIGHLIGHTS | SPRING 2011 | ReTAIl | GlOBAl preMier fAshiOn retAiL cOrriDOr rents (UsD psf/YeAr) 512 offices in 0 100 200 300 400 500 600 700 800 900 1000 1100 1200 1300 New York Hong Kong Fifth Avenue 2,150.00 Russell Street, Causeway Bay 1,509.88 61 countries on Hong Kong Queen's Road, Central 1,355.81 6 continents Paris Avenue des Champs-Élysées 1,310.26 Old Bond Street 961.85 United States: 125 London Canada: 36 Zurich Bahnhofstrasse 955.38 Latin America: 18 Milan Via Monte Napoleone 943.39 Asia Pacific: 194 Sydney Pitt Street Mall 901.42 EMEA: 117 London Oxford Street 761.46 • $1.5 billion in annual revenue Geneva Rue du Rhône 756.24 • 978.6 million square feet under New York Madison Avenue 708.00 management Rome Via Condotti 707.54 • More than 12,500 professionals Moscow Tverskaya Street 688.67 Tokyo Ginza-Chuo Street 610.64 cOLLiers internAtiOnAL Vienna Graben, Kohlmarkt, Kärntner Strasse 550.31 Munich Kau ngerstrasse 518.86 601 Union Street, Suite 5300 Seattle, WA 98101 Stuttgart Königstrasse 503.14 teL +1 206 223 0866 Melbourne Bourke Street Mall 495.78 fAx +1 206 757 9427 Riyadh `King Fahad Road / Olaya Road 446.95 Los Angeles Rodeo Drive 425.00 Frankfurt Zeil 424.52 fOr MOre infOrMAtiOn Dublin Grafton Street 422.95 Ross J. Moore Brisbane Queen Street Mall 383.11 Chief Economist | USA Dusseldorf Königsallee 377.36 teL +1 617 722 0221 Hamburg Spitalerstrasse 377.36 eMAiL ross.moore@colliers.com Singapore Orchard Road 366.00 Berlin Tauentzienstrasse 345.91 San Francisco Union Square - Post Street 340.00 Copyright © 2011 Colliers International. Shanghai Nanjing Road West 325.91 The information contained herein has been obtained Nevsky Prospekt 320.08 from sources deemed reliable. While every reasonable St Petersburg effort has been made to ensure its accuracy, we cannot Copenhagen Østergade 316.19 guarantee it. No responsibility is assumed for any inaccuracies. Readers are encouraged to consult their Prague Na Příkopě 314.46 professional advisors prior to acting on any of the Kyiv Vulitsya Khreshchatyk 303.46 material contained in this report. Honolulu Kalakaua Avenue 300.00 Amsterdam Kalverstraat 294.81 Perth Hay Street and Murray Street Malls 292.96 Toronto Bloor Street 291.66 Athens Ermou Street 283.02 Delhi Khan Market 277.55 Madrid Puerta del Sol Preciados 275.15 Adelaide Rundle Mall 270.43 Helsinki Aleksanterinkatu 267.29 Glasgow Buchanan Street 256.49 Chicago North Michigan Avenue 250.00 Seoul Central District 249.20 Manchester Market Street 240.46 Oslo Karl Johans Gate 232.59 Beijing Mall at CWTC 229.16 Birmingham High Street / New Street 224.43 Stockholm Biblioteksgatan 219.78 Accelerating success. 0 100 200 300 400 500 600 700 800 900 1000 1100 1200 1300 www.colliers.com