83770-87607 ۞Call Girls In Near The Park Hotel (Cp) Delhi
Q1 2013 Houston Industrial Market Research Report
1. www.colliers.com/houston
Q1 2013 | INDUSTRIAL MARKET
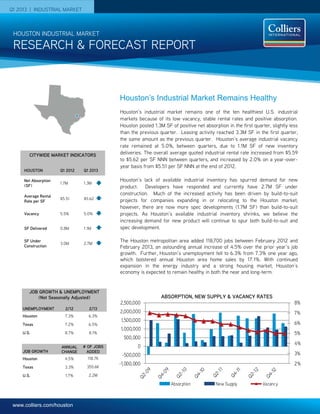
2%
3%
4%
5%
6%
7%
8%
-1,000,000
-500,000
0
500,000
1,000,000
1,500,000
2,000,000
2,500,000
Absorption New Supply Vacancy
Houston’s industrial market remains one of the ten healthiest U.S. industrial
markets because of its low vacancy, stable rental rates and positive absorption.
Houston posted 1.3M SF of positive net absorption in the first quarter, slightly less
than the previous quarter. Leasing activity reached 3.3M SF in the first quarter,
the same amount as the previous quarter. Houston’s average industrial vacancy
rate remained at 5.0%, between quarters, due to 1.1M SF of new inventory
deliveries. The overall average quoted industrial rental rate increased from $5.59
to $5.62 per SF NNN between quarters, and increased by 2.0% on a year-over-
year basis from $5.51 per SF NNN at the end of 2012.
Houston’s lack of available industrial inventory has spurred demand for new
product. Developers have responded and currently have 2.7M SF under
construction. Much of the increased activity has been driven by build-to-suit
projects for companies expanding in or relocating to the Houston market;
however, there are now more spec developments (1.7M SF) than build-to-suit
projects. As Houston’s available industrial inventory shrinks, we believe the
increasing demand for new product will continue to spur both build-to-suit and
spec development.
The Houston metropolitan area added 118,700 jobs between February 2012 and
February 2013, an astounding annual increase of 4.5% over the prior year’s job
growth. Further, Houston’s unemployment fell to 6.3% from 7.3% one year ago,
which bolstered annual Houston area home sales by 17.1%. With continued
expansion in the energy industry and a strong housing market, Houston’s
economy is expected to remain healthy in both the near and long-term.
RESEARCH & FORECAST REPORT
HOUSTON INDUSTRIAL MARKET
ABSORPTION, NEW SUPPLY & VACANCY RATES
Houston’s Industrial Market Remains Healthy
CITYWIDE MARKET INDICATORS
HOUSTON Q1 2012 Q1 2013
Net Absorption
(SF)
1.7M 1.3M
Average Rental
Rate per SF
$5.51 $5.62
Vacancy 5.5% 5.0%
SF Delivered 0.8M 1.1M
SF Under
Construction
3.0M 2.7M
UNEMPLOYMENT 2/12 2/13
Houston 7.3% 6.3%
Texas 7.2% 6.5%
U.S. 8.7% 8.1%
JOB GROWTH
ANNUAL
CHANGE
# OF JOBS
ADDED
Houston 4.5% 118.7K
Texas 3.3% 355.6K
U.S. 1.7% 2.2M
JOB GROWTH & UNEMPLOYMENT
(Not Seasonally Adjusted)
2. RESEARCH & FORECAST REPORT | Q1 2013 | HOUSTON INDUSTRIAL MARKET
COLLIERS INTERNATIONAL | P. 2
Vacancy & Availability
Although 1.1M SF of new inventory
delivered during the first quarter,
Houston’s industrial vacancy rate
remained unchanged between quarters at
5.0% and decreased by 30 basis points
from 5.3% reported in first quarter 2012.
At the close of the first quarter, Houston
had 24.1M SF of vacant industrial space
citywide, 224K SF less than the previous
quarter. Among the major industrial
corridors, the Northwest submarket has
the largest amount of vacant space with
5.0M SF (3.8% vacancy), followed by the
Southeast submarket with 4.9M SF
vacant (5.9% vacancy), the North
submarket with 4.6M SF vacant (6.3%
vacancy), and the Southwest submarket
with 3.7M SF vacant (5.9% vacancy).
Houston’s industrial construction pipeline
had 2.7M SF of projects underway at the
end of the first quarter, including 1.7M SF
of spec development. The largest project
under construction is a 475,000-SF
state-of-the-art foodservice distribution
facility that will be the new Gulf Coast
regional distribution hub for the Ben E.
Keith Company. The facility is being
constructed on an 82-acre tract located
in Missouri City in the Beltway Crossing
Business Park. A list of additional
buildings currently under construction
can be found on Page 4 of this report.
The largest spec project in the pipeline is
a 299,840-SF distribution warehouse
located on Langfield Rd. in the Northwest
industrial submarket.
Rental Rates
Houston’s overall average quoted
industrial rental rate increased from
$5.59 to $5.62 per SF NNN in the first
quarter, and increased by 2.0% on a
year-over-year basis from $5.51 per SF
NNN. By property type, the average
quoted NNN rental rates are as follows:
$5.45 per SF for Distribution space;
$4.43 per SF for Bulk Warehouse space;
$7.21 per SF for Flex/Service space; with
Tech/R&D space averaging $8.21 per SF.
Absorption & Demand
Houston’s industrial market posted 1.3M
SF of positive net absorption in the first
quarter, slightly less than the previous
quarter. The Northwest and Southwest
submarkets outperformed all others in the
first quarter, posting the largest positive
net quarterly absorption of 589K SF and
556K SF respectively. The Northeast
submarket followed with 273K SF of
positive net absorption.
There were several major tenant move-
ins contributing to net absorption gains in
the first quarter, including Applied Cyro
Technologies (173,000 SF); Crane
Worldwide (150,000 SF); Dickson
Furniture (94,000 SF); Seatex (38,405
SF); Noble Drilling (28,800 SF); and
Bosch Rexroth Corporation (28,080 SF).
Leasing
Houston’s industrial leasing activity
reached 3.3M SF in the first quarter, the
same as the previous quarter. Some of
Houston’s top first quarter industrial
leases transactions include:
PCS-CTS1,2
Alamo Crossing
Mar-13 231,348 SF
CADECO Industries, Inc.2
1060 Lockwood Distribution Ct.
Jan-13 154,114 SF
Crane Worldwide
6501 Navigation Blvd
Feb-13 150,000 SF
Intermarine Industrial Terminals
13901 Industrial Rd
Mar-13 132,000 SF
Dickson Furniture
6000 S Loop Fwy E
Jan-13 94,000 SF
Overseas Import Export, Inc.2
1800-1802 South St.
Jan-13 66,000 SF
Guardian Building Products1,2
7603 Prairie Oak Dr
Mar-13 63,763 SF
Delta Petroleum Co., Inc.1,2
3710 Cedar Blvd
Feb-13 62,100 SF
Bass Computers2,3
10558 Bissonnet
Feb-13 55,967 SF
Veritrust, Inc.
2155 Silber Rd
Jan-13 41,937 SF
Aluminum Screen Manufacturers1
9505 West Tidwell
Mar-13 40,856 SF
ThyssenKrupp Materials NA, Inc.1
12321 Cutten Rd
Mar-13 40,000 SF
Seatex
1406 Southgate Dr.
Feb-13 38,405 SF
1 Colliers International transaction
2 Renewal
3 Expansion
4Sublease
3. RESEARCH & FORECAST REPORT | Q1 2013 | HOUSTON INDUSTRIAL MARKET
COLLIERS INTERNATIONAL | P. 3
Houston Industrial Market Summary
Houston industrial sales activity
slowed between quarters with only 90
property sales recorded in Q1 2013,
compared to 267 in Q4 2012. A few
of the sales transactions that occurred
in Q1 2013 are summarized at right.
Sales Activity
Amigo Real Estate Investments sold a
13,510-SF office/warehouse to an
undisclosed owner/user for $63 per SF.
The Class C property was built in 1979
and is located at 5092 Steadmont Dr. in
the Northwest Inner Loop industrial
submarket. The building was 100.0%
leased at the time of sale.
Market Rentable Area
Direct
Vacant SF
Direct
Vacancy
Rate
Sublet
Vacant SF
Sublet
Vacancy
Rate
Total
Vacant SF
Total
Vacancy
Rate
1Q13 Net
Absorption
4Q12 Net
Absorption
1Q13
Completions
4Q12
Completions
SF Under
Construction
Greater Houston Total 485,486,002 23,575,216 4.9% 549,350 0.1% 24,124,566 5.0% 1,332,391 1,882,980 1,108,430 949,497 2,670,272
CBD-NW Inner Loop 11,735,797 538,450 4.6% 22,200 0.2% 560,650 4.8% 7,548 (103,966) - - -
Downtown 31,867,298 1,864,372 5.9% - 0.0% 1,864,372 5.9% (146,663) 175,283 - 38,232 -
North Inner Loop 5,158,517 451,369 8.7% - 0.0% 451,369 8.7% - (40,000) - - -
SW Inner Loop 7,434,557 108,923 1.5% - 0.0% 108,923 1.5% 25,090 (11,100) - - -
Total Inner Loop 56,196,169 2,963,114 5.3% 22,200 0.0% 2,985,314 5.3% (114,025) 20,217 - 38,232 -
North Fwy/Tomball Pky 15,731,936 1,638,618 10.4% 19,050 0.1% 1,657,668 10.5% (134,703) (101,093) 333,272 120,670 26,000
North Hardy Toll Rd 25,755,261 1,257,283 4.9% 11,956 0.0% 1,269,239 4.9% 133,234 (1,674) 290,665 - 897,599
North Outer Loop 17,779,955 977,544 5.5% - 0.0% 977,544 5.5% (107,271) (17,363) - - 123,391
The Woodlands/Conroe 13,649,381 696,961 5.1% - 0.0% 696,961 5.1% 45,462 107,445 - 65,000 74,901
Total North Corridor 72,916,533 4,570,406 6.3% 31,006 0.0% 4,601,412 6.3% (63,278) (12,685) 623,937 185,670 1,121,891
Northeast Hwy 321 1,188,527 1,980 0.2% 7,500 0.6% 9,480 0.8% 0 0 - - -
Northeast Hwy 90 15,684,326 314,892 2.0% 129,000 0.8% 443,892 2.8% 13,914 10,190 20,000 - -
Northeast I-10 3,975,829 118,003 3.0% - 0.0% 118,003 3.0% 30,669 1,492 21,000 - -
Northeast Inner Loop 11,589,888 494,240 4.3% - 0.0% 494,240 4.3% 228,000 (40,652) - - -
Total Northeast Corridor 32,438,570 929,115 2.9% 136,500 0.4% 1,065,615 3.3% 272,583 (28,970) 41,000 - -
Hwy 290/Tomball Pky 15,036,842 652,292 4.3% 25,636 0.2% 677,928 4.5% 126,211 68,047 74,300 - 40,000
Northwest Hwy 6 4,234,621 96,123 2.3% - 0.0% 96,123 2.3% 23,924 1,865 - - -
Northwest Inner Loop 60,107,686 2,499,502 4.2% 81,527 0.1% 2,581,029 4.3% 191,249 606,827 - 65,400 150,000
Northwest Near 16,509,429 675,066 4.1% 83,051 0.5% 758,117 4.6% 2,939 2,627 - 112,653 320,267
Northwest Outlier 13,029,062 351,050 2.7% 49,055 0.4% 400,105 3.1% 7,787 32,804 - 26,480 -
West Outer Loop 22,948,670 475,204 2.1% 6,000 0.0% 481,204 2.1% 236,597 219,320 35,750 149,842 22,500
Total Northwest Corridor 131,866,310 4,749,237 3.6% 245,269 0.2% 4,994,506 3.8% 588,707 931,490 110,050 354,375 532,767
South Highway 35 31,243,555 1,133,397 3.6% 23,600 0.1% 1,156,997 3.7% (62,932) 216,492 10,672 66,841 88,000
South Inner Loop 13,358,702 641,050 4.8% - 0.0% 641,050 4.8% (51,349) 42,379 - - -
Total South Corridor 44,602,257 1,774,447 4.0% 23,600 0.1% 1,798,047 4.0% (114,281) 258,871 10,672 66,841 88,000
East I-10 Outer Loop 15,747,527 115,135 0.7% - 0.0% 115,135 0.7% 400 2,500 - - -
East-SE Far 47,891,137 4,498,359 9.4% 31,163 0.1% 4,529,522 9.5% 172,985 386,337 292,771 62,115 365,462
SE Outer Loop 20,408,405 293,812 1.4% - 0.0% 293,812 1.4% 32,990 38,940 - - -
Total Southeast Corridor 84,047,069 4,907,306 5.8% 31,163 0.0% 4,938,469 5.9% 206,375 427,777 292,771 62,115 365,462
Highway 59/Highway 90 21,873,520 901,913 4.1% 50,372 0.2% 952,285 4.4% 195,530 60,247 - 223,000 475,000
Southwest Far 10,253,568 909,688 8.9% - 0.0% 909,688 8.9% 16,489 120,156 - 19,264 57,152
Southwest Outer Loop 12,640,729 772,901 6.1% 4,240 0.0% 777,141 6.1% 119,207 27,988 - - -
Fort Bend County/Sugar Land 18,651,277 1,097,089 5.9% 5,000 0.0% 1,102,089 5.9% 225,084 77,889 30,000 - 30,000
Total Southwest Corridor 63,419,094 3,681,591 5.8% 59,612 0.1% 3,741,203 5.9% 556,310 286,280 30,000 242,264 562,152
Houston Industrial Market Statistical Summary
1st Quarter 2013
Intermarine, LLC sold a 132,000-SF
Class C industrial warehouse and 95-
acre industrial shipping terminal to
Lexington Real Trust for $81.4M.
Intermarine leased back the property
and is constructing a $10M operations
center on the site. This terminal is
situated along the Houston Ship
Channel.
Sources: Real Capital Analytics; CoStar Comps
4. RESEARCH & FORECAST REPORT | Q1 2013 | HOUSTON INDUSTRIAL MARKET
COLLIERS INTERNATIONAL | P. 4
Q1 2013 Industrial Under Construction – 25,000 SF or greater
Q1 2013 Industrial Deliveries - 25,000 SF or greater
Submarket Cluster Submarket Building Address RBA % Leased Developer
Estimated
Delivery
Southwest Corridor Ind Hwy 59/Hwy 90 1001 Cravens Rd 475,000 100.0 Ben E Keith Jun-13
Northwest Corridor Ind Northwest Near 7310 Langfield - Bldg 200 299,840 0.0 Avera Companies Jun-13
Southeast Corridor Ind East-Southeast Far 3750 Highway 225 185,168 0.0 The Carson Companies Sep-13
North Corridor Ind North Hardy Toll Rd 16200 Central Green Blvd 181,067 100.0 Liberty Property Trust Sep-13
North Corridor Ind North Hardy Toll Rd 500 Northpark Central Dr 174,200 0.0 Prologis Inc. Jun-13
North Corridor Ind North Hardy Toll Rd 14650 Heathrow Forest Pky 121,919 100.0 Wolff Properties Jun-13
Southeast Corridor Ind East-Southeast Far 3700 Highway 225 118,500 0.0 The Carson Companies Sep-13
North Corridor Ind North Hardy Toll Rd 4730 Consulate Plaza Dr 101,200 0.0 EastGroup Properties Jun-13
North Corridor Ind North Hardy Toll Rd 250 Century Plaza Dr 91,520 0.0 Avera Companies Jul-13
North Corridor Ind Woodlands/Conroe 4001 Technology Forest Blvd 74,901 0.0 Stream Realty Partners, L.P. May-13
Northwest Corridor Ind Northwest Inner Loop 1315 W Sam Houston Pky N - Bldg 1 70,000 0.0 Caldwell Companies May-13
Southeast Corridor Ind East-Southeast Far 3800 Highway 225 61,794 0.0 The Carson Companies Sep-13
North Corridor Ind North Hardy Toll Rd 4741 World Houston Pky 56,513 0.0 EastGroup Properties Jun-13
South Corridor Ind South Hwy 35 2425 Mowery Rd - Bldg A 53,000 0.0 Colliers International Apr-13
North Corridor Ind North Hardy Toll Rd 4740 Consulate Plaza Dr 50,340 100.0 EastGroup Properties Jun-13
North Corridor Ind North Hardy Toll Rd 4721 World Houston Pky 45,040 0.0 EastGroup Properties Jul-13
North Corridor Ind North Outer Loop 14134 Vickery Dr 41,964 100.0 Clay Development & Construction Inc. Apr-13
Northwest Corridor Ind Northwest Inner Loop 1315 W Sam Houston Pky N - Bldg 2 40,000 0.0 Caldwell Companies May-13
Northwest Corridor Ind Northwest Inner Loop 1315 W Sam Houston Pky N - Bldg 3 40,000 0.0 Caldwell Companies May-13
Southwest Corridor Ind Southwest Far 1145 Highway 90 A 38,000 0.0 Jacob Realty Group Jun-13
North Corridor Ind North Hardy Toll Rd 1368 E Richey Rd 33,000 0.0 Northwinds Commercial Jun-13
North Corridor Ind North Outer Loop 4641 Kennedy Commerce Dr 31,427 100.0 Clay Development & Construction Inc. Jun-13
Southwest Corridor Ind Fort Bend Co/Sugar Land 19830 FM 1093 30,000 0.0 Moody Rambin Interests Aug-13
North Corridor Ind North Fwy/Tomball Pky 6611 Willowbrook Park Dr 26,000 0.0 Capital Commercial Investments May-13
North Corridor Ind North Outer Loop 6010 Dwyer Dr 25,000 0.0 Nobel House Real Estate Jun-13
North Corridor Ind North Outer Loop 4615 Kennedy Commerce Dr 25,000 100.0 Clay Development & Construction Inc. Aug-13
South Corridor Ind South Hwy 35 12233 Robin Blvd 25,000 0.0 Colliers International Sep-13
Submarket Cluster Submarket Building Address RBA % Leased Developer Delivered
Southeast Corridor Ind East-SE Far 1902 S 16th St 261,291 0.0 ML Realty Partners Jan-13
North Corridor Ind North Hardy Toll Rd 16330 Central Green Blvd - B 10 163,600 0.0 Liberty Property Trust Jan-13
North Corridor Ind North Fwy/Tomball Pky 14300 Hollister Rd 111,065 76.8 Liberty Property Trust Jan-13
North Corridor Ind North Fwy/Tomball Pky 12101 Cutten Rd 101,123 100.0 Clay Development Feb-13
North Corridor Ind North Fwy/Tomball Pky 7505 Bluff Point Dr 86,823 0.0 EastGroup Properties Jan-13
North Corridor Ind North Hardy Toll Rd 2330 Peyton Rd 56,915 0.0 Capital Commercial Feb-13
Northwest Corridor Ind West Outer Loop 5915 Brittmoore Rd 35,750 0.0 Triten Real Estate Partners Mar-13
North Corridor Ind North Fwy/Tomball Pky 12031 North Fwy 34,261 100.0 Structure Tone, Inc. Jan-13
Southeast Corridor Ind East-Southeast Far 11804 Fairmont Pky 31,480 0.0 VIGAVI Realty Feb-13
Southwest Corridor Fort Bend Co/Sugar Land6510 FM 723 Rd - B 1 30,000 16.7 Wayne Stone Properties Jan-13
North Corridor Ind North Hardy Toll Rd 20221 Carriage Point Dr 25,050 100.0 The National Realty Group, Inc. Feb-13
5. RESEARCH & FORECAST REPORT | Q1 2013 | HOUSTON INDUSTRIAL MARKET
Accelerating success.
COLLIERS INTERNATIONAL | HOUSTON
1300 Post Oak Boulevard
Suite 200
Houston, Texas 77056
Main +1 713 222 2111
5COLLIERS INTERNATIONAL | P.
LISA R. BRIDGES
Director of Market Research Houston
Direct +1 713 830 2125
Fax +1 713 830 2118
lisa.bridges@colliers.com