
Recommended
Recommended
More Related Content
More from clairbycraft
More from clairbycraft (20)
Recently uploaded
Recently uploaded (20)
Calculate R-BarUpper control limit for the rangeUpper control .docx
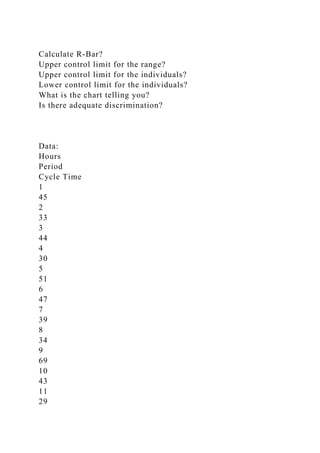
- 1. Calculate R-Bar? Upper control limit for the range? Upper control limit for the individuals? Lower control limit for the individuals? What is the chart telling you? Is there adequate discrimination? Data: Hours Period Cycle Time 1 45 2 33 3 44 4 30 5 51 6 47 7 39 8 34 9 69 10 43 11 29