Economy at a glance: Economic slowdown in Spain and abroad
•
0 likes•65 views

1. The Spanish economy is slowing down, with the composite leading indicator decreasing by 0.22 points to 98.58 and below 100 points for 12 months. Spain recorded the third largest economic slowdown among OECD countries in August. 2. Tourism to Spain increased by 1.5% in arrivals but average spending grew only modestly by 1.7%, below last year's growth. Forecasts for Spanish GDP growth in 2019 were reduced to a range of 1.9-2.2%. 3. Industrial production in Spain grew 1.7% in August but this was below the 2015-2017 average, confirming weaker industry dynamics since 2018 due to slowing European and German industry and lower exports.

Recommended
Recommended
More Related Content
What's hot
What's hot (20)
Similar to Economy at a glance: Economic slowdown in Spain and abroad
Similar to Economy at a glance: Economic slowdown in Spain and abroad (20)
More from Círculo de Empresarios
More from Círculo de Empresarios (20)
Recently uploaded
Recently uploaded (20)
Economy at a glance: Economic slowdown in Spain and abroad
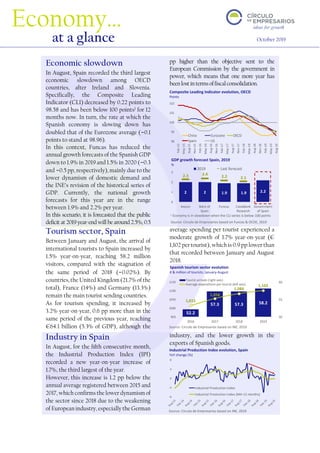
- 1. Source: Círculo de Empresarios based on Funcas & OCDE, 2019 Source: Círculo de Empresarios based on INE, 2019 1 Economy is in slowdown when the CLI series is below 100 points and decreasing. Source: Círculo de Empresarios based on INE, 2019 52.2 57.3 57.3 58.21,015 1,056 1,084 1,102 50 55 60 950 1000 1050 1100 1150 2016 2017 2018 2019 Tourist arrivals (right axis) Average expenditure per tourist (left axis) -8 -4 0 4 8 Industrial Production Index Industrial Production Index (MA 12 months) 98 99 100 101 102 Feb-15 May-15 Aug-15 Nov-15 Feb-16 May-16 Aug-16 Nov-16 Feb-17 May-17 Aug-17 Nov-17 Feb-18 May-18 Aug-18 Nov-18 Feb-19 May-19 Aug-19 China Eurozone OECD Spain US 2 2 1.9 1.9 2.2 2.3 2.4 2.2 2.1 0 1 2 3 Axesor Bank of Spain Funcas CaixaBank Research Government of Spain 2019 Last forecast Economic slowdown In August, Spain recorded the third largest economic slowdown among OECD countries, after Ireland and Slovenia. Specifically, the Composite Leading Indicator (CLI) decreased by 0.22 points to 98.58 and has been below 100 points1 for 12 months now. In turn, the rate at which the Spanish economy is slowing down has doubled that of the Eurozone average (-0.1 points to stand at 98.96). In this context, Funcas has reduced the annual growth forecasts of the Spanish GDP down to 1.9% in 2019 and 1.5% in 2020 (-0.3 and -0.5 pp, respectively), mainly due to the lower dynamism of domestic demand and the INE’s revision of the historical series of GDP. Currently, the national growth forecasts for this year are in the range between 1.9% and 2.2% per year. In this scenario, it is forecasted that the public deficit at 2019 year-end will be around 2.5%, 0.5 pp higher than the objective sent to the European Commission by the government in power, which means that one more year has beenlostintermsoffiscalconsolidation. Tourism sector, Spain Between January and August, the arrival of international tourists to Spain increased by 1.5% year-on-year, reaching 58.2 million visitors, compared with the stagnation of the same period of 2018 (-0.02%). By countries, the United Kingdom (21.7% of the total), France (14%) and Germany (13.3%) remain the main tourist sending countries. As for tourism spending, it increased by 3.2% year-on-year, 0.6 pp more than in the same period of the previous year, reaching €64.1 billion (5.3% of GDP), although the average spending per tourist experienced a moderate growth of 1.7% year-on-year (€ 1,102 per tourist), which is 0.9 pp lower than that recorded between January and August 2018. Industry in Spain In August, for the fifth consecutive month, the Industrial Production Index (IPI) recorded a new year-on-year increase of 1.7%, the third largest of the year. However, this increase is 1.2 pp below the annual average registered between 2015 and 2017, which confirms the lower dynamism of the sector since 2018 due to the weakening of European industry, especially the German industry, and the lower growth in the exports of Spanish goods. Economy… at a glance October 2019 Composite Leading Indicator evolution, OECD Points Spanish tourism sector evolution € & million of tourists; January-August GDP growth forecast Spain, 2019 % Industrial Production Index evolution, Spain YoY change (%)
- 2. ‘Economy at a glance’, a publication of the Círculo de Empresarios produced by its Department of the Economy, contains information and opinion from reliable sources. However, the Círculo de Empresarios does not guarantee its accuracy and does not take responsibility for any errors or omissions. This document is merely informative. As a result, the Círculo de Empresarios is not responsible for any uses that may be made of the publication. The opinions and estimates of the Department can be modified without prior warning. www.circulodeempresarios.org Source: Círculo de Empresarios based on Sentix, 2019 Source: Círculo de Empresarios based on Bureau of Labor Statistics, 2019 Source: Círculo de Empresarios based on Bank of Korea, 2019 0 50 100 150 200 250 300 350 Sep-16 Nov-16 Jan-17 Mar-17 May-17 Jul-17 Sep-17 Nov-17 Jan-18 Mar-18 May-18 Jul-18 Sep-18 Nov-18 Jan-19 Mar-19 May-19 Jul-19 Sep-19 Employment growth MA 12 months -16.8 -40 -20 0 20 40 Oct-09 Apr-10 Oct-10 Apr-11 Oct-11 Apr-12 Oct-12 Apr-13 Oct-13 Apr-14 Oct-14 Apr-15 Oct-15 Apr-16 Oct-16 Apr-17 Oct-17 Apr-18 Oct-18 Apr-19 Oct-19 -4 -2 0 2 4 6 GDP Industrial production Economic sentiment The monetary stimulus announced by the ECB and the Fed have failed to mitigate the growing doubts about the future evolution of the European economy. In October, the Sentix index, which assesses the economic sentiment of investors in the Eurozone, waned by 5.7 points to -16.8 points, its record low since April 2013. The main causes of the deterioration in business confidence are the escalating trade tensions, the slowdown of growth in the Eurozone, especially in Germany, and dwindling corporate profits. In this context, the IMF warns that the global economy is now in a synchronised slowdown in nearly 90% of the countries, estimating that the cost of the trade war could mean a loss of around $700 billion by 2020 (0.8% of its GDP). US labour market In September, the US unemployment rate decreased to 3.5%, reaching a new record low since 1969. In spite of this, its labour market continues to lose dynamism as its economic growth forecasts worsen. Specifically, the employed population increased by 136,000 people, 19% less than in August, and 23% below the average of the last 12 months (176,700 jobs/month). By sectors, on the one hand, the 2,000 jobs that were slashed in manufacturing stand out, compared with the average monthly creation of 22,000 jobs in 2018. On the other hand, the services sector increased by 109,000 workers, 33.1% less than in August. South Korea Since the beginning of 2019, South Korea has shown signs of an economic slowdown mainly due to the escalating trade tensions with Japan, the global economic slowdown, and the rising geopolitical risks. Specifically, the grim outlook for its industrial and foreign sectors: • In August, its industrial production fell by 2.9% year-on-year, or a cumulative average drop of 1.3% since January 2019, compared to the average progress recorded of 1.4% since 2015. • In September, its exports of goods fell by 11.7% year-on-year, which is 11 consecutive months of decline, compared to the progress of a 34.9% increase recorded a year ago. In this scenario, the South Korean government has announced a series of measures to boost job creation and investment in R&D. This expansive fiscal policy will represent an increase in public spending of 8% against the backdrop of a 40% debt-to-GDP ratio (75% for the OECD) and where its central bank has reduced the official interest rates to 1.5% in August (-25 bp). Employment monthly growth, US Thousands of jobs Sentix index Eurozone Points GDP growth and industrial production, South Korea YoY change (%)