SlideShare a Scribd company logo
1 of 1
Download to read offline
NO!A Data Quality Performance and Efficiency
The Near Detector successfully made 79.7% of good runs and the Far Detector successfully made 86.2% of good runs so far.! The bad
subruns due to different failure modes:
Follow NO!A on Social Media
www.facebook.com/novaexperiment/
See live data! nusoft.fnal.gov/nova/public
@NOvANuz http://www-nova.fnal.gov
Bottom: Left: 6 Months of Near Detector Data and failure modes within that time period with overall/segmented efficiency Right: 1 year of Far
Detector data and failure modes within that time period, with overall/segmented efficiency
1.8%
6.3%
0.06%
0.8%
0.4%
0.09%
8.3%
0.01%
1. The NO!A Experiment
15.8%
3.1%
< 0.1%
14.9%
0.0%
26.1%
14.1%
14.9%
4.9%
0.2%
wire (beam direction)
• Two functionally identical low-z highly active
detectors located 14 milliradians off the NuMi
neutrino beam axis, separated by 809km
• The Far Detector has 344,064 channels and the
Near Detector has 20,192 individual channels.
• The Far Detector is located on the surface while the
Near Detector is ~100m underground to help
remove cosmic rays.
• The NOvA experiment is designed to run 365 days a
year, 24/7. Constant monitoring and data quality
determination is needed to immediately fix any
potential problems
• The NOvA detectors are segmented in the following
way:
wire (beam direction)
2. Far Detector Data Quality
Determining Data Quality for the NO!A Experiment
Chatura Kuruppu On behalf of NO!A Collaboration
University of South Carolina, ckuruppu@email.sc.edu
The Far and Near Detectors• The quality of the data is based on a periodic zero bias trigger that contains
150Hz of cosmics.
• The Far Detector is unique in the fact that it can be compartmentalized on a
subrun-by-subrun level, using detector masks to ignore any parts of the
detector that are considered bad to maximize the amount of the good POT
which we keep for analyzes.
• Far Detector has 64 subruns in a run, with each subrun averaging about 2-3
minutes of data
3. Near Detector Data Quality
• The quality of data is determined by using neutrino beam data.
• The Near Detector provides spill level data quality cuts to filter out low quality
spills that are missed by subrun level quality cuts and also focuses on the
quality of the beam received from Fermilab
• Near Detector has 24 subruns in a single run, with a subrun averaging to about
an hour of data.
FD Hardware Level Matrix
In the Far Detector, hit rates are monitored on a channel (pixel) and FEB level in
each DCM and DiBlock. Each DCM is assigned individual cuts over all DiBlocks
for both channels and FEBs. These cuts allow the Far Detector environment to be
segmented and allow certain parts of the detector to be masked off on a subrun-
by-subrun level.
FD Subrun Level Cuts
The Far Detector data quality is determined using a subruns worth of data. These
subrun level cuts look at overall hardware performance, the health of the DAQ by
monitoring trigger levels, and by looking at basic reconstruction products, such as
hit clustering (slicing), in the detector.
ND Spill Level Quality
Since subruns are comparatively long in the Near Detector, spill level quality metrics
are needed to maximize POT received. Some spill quality metrics we look at are:
number of noisy channels, number of hits that are out of beam window time, and
number of “bad” or missing DCMs
ND Subrun Level Cuts
The subrun level cuts for the Near Detector look at the overall hardware performance,
beam conditions and performance, reconstruction products, and trigger levels which
could indicate beam or DAQ performance.
Left: The average hit rate in the Near Detector per 1000 spills of the neutrino beam. The
red arrows indicate the values that are cut on. This metric tracks the the number of physics
hits normalized by the number of POT. This can help indicate when the detector
environment changes, including gain changes.
Right: The subrun averaged neutrino beam timing peak start. The red arrows indicate the
values that are cut on. This metric helps ensure that the Near Detector is synchronized in
time and is receiving beam spills correctly.
ND Beam Quality
The beam quality is closely monitored using the Intensity Frontier Database
(IFDB). NOvA receives beam metrics from this data, such as NuMI horn
current, POT, positioning, width, and timing of the beam. These metrics help
determine if a beam is considered good or bad which is rolled into our data
quality metrics.
Examples of beam quality metrics, where the dashed red line shows the cut
between good and bad beam for that metric
Left: A year of Far Detector data showing which DiBlocks have been masked off (red)
and shows a ~99.4% efficiency for our whole detector.
Right: The averaged hit rate over several runs for channels in the top of the detector.
NOvA expects to see different rates in different parts of the detector because of
differences in the cosmic rate throughout the Far Detector. In addition, DCMs near the
top of the detector are more likely to get hit more than those on the side of the detector.
Left: The overall hit rate in the detector on a subrun level over the
past year. This is to track any changes in gain due to cooling
failures, as an example. In the past year, there has been a permanent
change in the gain from ~100 to ~150 only in the Far Detector. This
has caused the hit rate to increase overall, due to increasing our
sensitivity.
Right: A metric that tracks trigger levels in the Far Detector. The red
arrow indicates where a cut is made to determine subrun quality.
This metric is cut on to ensure that slicing rate is constant. Changes
in slicing rate can indicate reconstruction failures due to
synchronization issues or excess noise.
• 32 channels per Front End Board (FEB)
• 64 FEBs per Data Concentrator Module (DCM)
• 12 DCMs per DiBlock (DB) for Far Detector
• ~4 DCMs per DiBlocks for Near Detector A real time plot demonstrating FEB hit rates in the Far Detector
An event display showing a non-reporting DCM in a beam Spill event
Far Detector
Near Detector
NDOS Prototype

More Related Content

What's hot

Intrusion Detection In Open Field Using Geophone (Report)
Intrusion Detection In Open Field Using Geophone (Report)Intrusion Detection In Open Field Using Geophone (Report)
Intrusion Detection In Open Field Using Geophone (Report)Nuthan Prasad
 
Electronic noise filtering strategy in hemodynamic research
Electronic noise filtering strategy in hemodynamic researchElectronic noise filtering strategy in hemodynamic research
Electronic noise filtering strategy in hemodynamic researchFilip Konecny
 
Analysis for Radar and Electronic Warfare
Analysis for Radar and Electronic WarfareAnalysis for Radar and Electronic Warfare
Analysis for Radar and Electronic WarfareReza Taryghat
 
Final year project
Final year projectFinal year project
Final year projectLow Jun Jie
 
Spectrum Analyzer
Spectrum AnalyzerSpectrum Analyzer
Spectrum AnalyzerManasa K
 
TH3.TO4.2.pptx
TH3.TO4.2.pptxTH3.TO4.2.pptx
TH3.TO4.2.pptxgrssieee
 

What's hot (11)

Intrusion Detection In Open Field Using Geophone (Report)
Intrusion Detection In Open Field Using Geophone (Report)Intrusion Detection In Open Field Using Geophone (Report)
Intrusion Detection In Open Field Using Geophone (Report)
 
Oscillation Monitoring System at TVA
Oscillation Monitoring System at TVAOscillation Monitoring System at TVA
Oscillation Monitoring System at TVA
 
Electronic noise filtering strategy in hemodynamic research
Electronic noise filtering strategy in hemodynamic researchElectronic noise filtering strategy in hemodynamic research
Electronic noise filtering strategy in hemodynamic research
 
Analysis for Radar and Electronic Warfare
Analysis for Radar and Electronic WarfareAnalysis for Radar and Electronic Warfare
Analysis for Radar and Electronic Warfare
 
Final year project
Final year projectFinal year project
Final year project
 
Spectrum Analyzer
Spectrum AnalyzerSpectrum Analyzer
Spectrum Analyzer
 
Ofdm
OfdmOfdm
Ofdm
 
Spread spectrum
Spread spectrumSpread spectrum
Spread spectrum
 
4rth lec dsss
4rth lec   dsss4rth lec   dsss
4rth lec dsss
 
Mbc system
Mbc systemMbc system
Mbc system
 
TH3.TO4.2.pptx
TH3.TO4.2.pptxTH3.TO4.2.pptx
TH3.TO4.2.pptx
 

Similar to Determining Data Quality for NOvA experiment

Color flow medical cardiac ultrasound
Color flow medical cardiac ultrasoundColor flow medical cardiac ultrasound
Color flow medical cardiac ultrasoundLarry Miller PhD
 
Application note signal_generator_spectral_purity
Application note signal_generator_spectral_purityApplication note signal_generator_spectral_purity
Application note signal_generator_spectral_purityS.c. Lu
 
Drive Test and Optimization Tutorial - I.pdf
Drive Test and Optimization Tutorial - I.pdfDrive Test and Optimization Tutorial - I.pdf
Drive Test and Optimization Tutorial - I.pdfhamdi_saif
 
Automatic azimuth tunning
Automatic azimuth tunningAutomatic azimuth tunning
Automatic azimuth tunningFASMETRICS S.A.
 
sub topics of NMR.pptx
sub topics of NMR.pptxsub topics of NMR.pptx
sub topics of NMR.pptxHajira Mahmood
 
Relative Dosimetry_02.04.2019_ Final.pptx
Relative Dosimetry_02.04.2019_ Final.pptxRelative Dosimetry_02.04.2019_ Final.pptx
Relative Dosimetry_02.04.2019_ Final.pptxAshikurRahman204838
 
Cathode ray oscilloscope and related experiments
Cathode ray oscilloscope and related experimentsCathode ray oscilloscope and related experiments
Cathode ray oscilloscope and related experimentsTrisha Banerjee
 
CellExtender® Antenna System Design Guidelines
CellExtender® Antenna System Design GuidelinesCellExtender® Antenna System Design Guidelines
CellExtender® Antenna System Design GuidelinesCaroline Seawright
 
Noiseken electromagnetic field visualization system - denkei
Noiseken electromagnetic field visualization system - denkeiNoiseken electromagnetic field visualization system - denkei
Noiseken electromagnetic field visualization system - denkeiNIHON DENKEI SINGAPORE
 
spectrum analyzers ppt
spectrum analyzers pptspectrum analyzers ppt
spectrum analyzers pptAvinash Jadhav
 
OTDR-OPTICAL TIME DOMAIN REFLECTOMETER
OTDR-OPTICAL TIME DOMAIN REFLECTOMETEROTDR-OPTICAL TIME DOMAIN REFLECTOMETER
OTDR-OPTICAL TIME DOMAIN REFLECTOMETERPremashis Kumar
 
IRJET- Random Valued Impulse Noise Detection Schemes
IRJET- Random Valued Impulse Noise Detection SchemesIRJET- Random Valued Impulse Noise Detection Schemes
IRJET- Random Valued Impulse Noise Detection SchemesIRJET Journal
 
A Frequency-based RF Partial Discharge Detector for Low-power Wireless Sens...
A Frequency-based  RF Partial Discharge Detector  for Low-power Wireless Sens...A Frequency-based  RF Partial Discharge Detector  for Low-power Wireless Sens...
A Frequency-based RF Partial Discharge Detector for Low-power Wireless Sens...Swathi Venugopal
 

Similar to Determining Data Quality for NOvA experiment (20)

Color flow medical cardiac ultrasound
Color flow medical cardiac ultrasoundColor flow medical cardiac ultrasound
Color flow medical cardiac ultrasound
 
Application note signal_generator_spectral_purity
Application note signal_generator_spectral_purityApplication note signal_generator_spectral_purity
Application note signal_generator_spectral_purity
 
Azimuth-SON
Azimuth-SONAzimuth-SON
Azimuth-SON
 
Drive Test and Optimization Tutorial - I.pdf
Drive Test and Optimization Tutorial - I.pdfDrive Test and Optimization Tutorial - I.pdf
Drive Test and Optimization Tutorial - I.pdf
 
Automatic azimuth tunning
Automatic azimuth tunningAutomatic azimuth tunning
Automatic azimuth tunning
 
sub topics of NMR.pptx
sub topics of NMR.pptxsub topics of NMR.pptx
sub topics of NMR.pptx
 
Relative Dosimetry_02.04.2019_ Final.pptx
Relative Dosimetry_02.04.2019_ Final.pptxRelative Dosimetry_02.04.2019_ Final.pptx
Relative Dosimetry_02.04.2019_ Final.pptx
 
Cathode ray oscilloscope and related experiments
Cathode ray oscilloscope and related experimentsCathode ray oscilloscope and related experiments
Cathode ray oscilloscope and related experiments
 
3 g drive test
3 g drive test3 g drive test
3 g drive test
 
CellExtender® Antenna System Design Guidelines
CellExtender® Antenna System Design GuidelinesCellExtender® Antenna System Design Guidelines
CellExtender® Antenna System Design Guidelines
 
Noiseken electromagnetic field visualization system - denkei
Noiseken electromagnetic field visualization system - denkeiNoiseken electromagnetic field visualization system - denkei
Noiseken electromagnetic field visualization system - denkei
 
14184864.ppt
14184864.ppt14184864.ppt
14184864.ppt
 
spectrum analyzers ppt
spectrum analyzers pptspectrum analyzers ppt
spectrum analyzers ppt
 
C04441722
C04441722C04441722
C04441722
 
Ei unit 2
Ei unit 2Ei unit 2
Ei unit 2
 
OTDR-OPTICAL TIME DOMAIN REFLECTOMETER
OTDR-OPTICAL TIME DOMAIN REFLECTOMETEROTDR-OPTICAL TIME DOMAIN REFLECTOMETER
OTDR-OPTICAL TIME DOMAIN REFLECTOMETER
 
IRJET- Random Valued Impulse Noise Detection Schemes
IRJET- Random Valued Impulse Noise Detection SchemesIRJET- Random Valued Impulse Noise Detection Schemes
IRJET- Random Valued Impulse Noise Detection Schemes
 
Spectrum analyzer
Spectrum analyzerSpectrum analyzer
Spectrum analyzer
 
OTDR&Applns.pdf
OTDR&Applns.pdfOTDR&Applns.pdf
OTDR&Applns.pdf
 
A Frequency-based RF Partial Discharge Detector for Low-power Wireless Sens...
A Frequency-based  RF Partial Discharge Detector  for Low-power Wireless Sens...A Frequency-based  RF Partial Discharge Detector  for Low-power Wireless Sens...
A Frequency-based RF Partial Discharge Detector for Low-power Wireless Sens...
 

Recently uploaded

Music 9 - 4th quarter - Vocal Music of the Romantic Period.pptx
Music 9 - 4th quarter - Vocal Music of the Romantic Period.pptxMusic 9 - 4th quarter - Vocal Music of the Romantic Period.pptx
Music 9 - 4th quarter - Vocal Music of the Romantic Period.pptxleah joy valeriano
 
Influencing policy (training slides from Fast Track Impact)
Influencing policy (training slides from Fast Track Impact)Influencing policy (training slides from Fast Track Impact)
Influencing policy (training slides from Fast Track Impact)Mark Reed
 
Incoming and Outgoing Shipments in 3 STEPS Using Odoo 17
Incoming and Outgoing Shipments in 3 STEPS Using Odoo 17Incoming and Outgoing Shipments in 3 STEPS Using Odoo 17
Incoming and Outgoing Shipments in 3 STEPS Using Odoo 17Celine George
 
Choosing the Right CBSE School A Comprehensive Guide for Parents
Choosing the Right CBSE School A Comprehensive Guide for ParentsChoosing the Right CBSE School A Comprehensive Guide for Parents
Choosing the Right CBSE School A Comprehensive Guide for Parentsnavabharathschool99
 
Difference Between Search & Browse Methods in Odoo 17
Difference Between Search & Browse Methods in Odoo 17Difference Between Search & Browse Methods in Odoo 17
Difference Between Search & Browse Methods in Odoo 17Celine George
 
Barangay Council for the Protection of Children (BCPC) Orientation.pptx
Barangay Council for the Protection of Children (BCPC) Orientation.pptxBarangay Council for the Protection of Children (BCPC) Orientation.pptx
Barangay Council for the Protection of Children (BCPC) Orientation.pptxCarlos105
 
USPS® Forced Meter Migration - How to Know if Your Postage Meter Will Soon be...
USPS® Forced Meter Migration - How to Know if Your Postage Meter Will Soon be...USPS® Forced Meter Migration - How to Know if Your Postage Meter Will Soon be...
USPS® Forced Meter Migration - How to Know if Your Postage Meter Will Soon be...Postal Advocate Inc.
 
Field Attribute Index Feature in Odoo 17
Field Attribute Index Feature in Odoo 17Field Attribute Index Feature in Odoo 17
Field Attribute Index Feature in Odoo 17Celine George
 
Active Learning Strategies (in short ALS).pdf
Active Learning Strategies (in short ALS).pdfActive Learning Strategies (in short ALS).pdf
Active Learning Strategies (in short ALS).pdfPatidar M
 
Virtual-Orientation-on-the-Administration-of-NATG12-NATG6-and-ELLNA.pdf
Virtual-Orientation-on-the-Administration-of-NATG12-NATG6-and-ELLNA.pdfVirtual-Orientation-on-the-Administration-of-NATG12-NATG6-and-ELLNA.pdf
Virtual-Orientation-on-the-Administration-of-NATG12-NATG6-and-ELLNA.pdfErwinPantujan2
 
4.16.24 21st Century Movements for Black Lives.pptx
4.16.24 21st Century Movements for Black Lives.pptx4.16.24 21st Century Movements for Black Lives.pptx
4.16.24 21st Century Movements for Black Lives.pptxmary850239
 
ICS2208 Lecture6 Notes for SL spaces.pdf
ICS2208 Lecture6 Notes for SL spaces.pdfICS2208 Lecture6 Notes for SL spaces.pdf
ICS2208 Lecture6 Notes for SL spaces.pdfVanessa Camilleri
 
Global Lehigh Strategic Initiatives (without descriptions)
Global Lehigh Strategic Initiatives (without descriptions)Global Lehigh Strategic Initiatives (without descriptions)
Global Lehigh Strategic Initiatives (without descriptions)cama23
 
Visit to a blind student's school🧑‍🦯🧑‍🦯(community medicine)
Visit to a blind student's school🧑‍🦯🧑‍🦯(community medicine)Visit to a blind student's school🧑‍🦯🧑‍🦯(community medicine)
Visit to a blind student's school🧑‍🦯🧑‍🦯(community medicine)lakshayb543
 
Integumentary System SMP B. Pharm Sem I.ppt
Integumentary System SMP B. Pharm Sem I.pptIntegumentary System SMP B. Pharm Sem I.ppt
Integumentary System SMP B. Pharm Sem I.pptshraddhaparab530
 
GRADE 4 - SUMMATIVE TEST QUARTER 4 ALL SUBJECTS
GRADE 4 - SUMMATIVE TEST QUARTER 4 ALL SUBJECTSGRADE 4 - SUMMATIVE TEST QUARTER 4 ALL SUBJECTS
GRADE 4 - SUMMATIVE TEST QUARTER 4 ALL SUBJECTSJoshuaGantuangco2
 
Earth Day Presentation wow hello nice great
Earth Day Presentation wow hello nice greatEarth Day Presentation wow hello nice great
Earth Day Presentation wow hello nice greatYousafMalik24
 

Recently uploaded (20)

Music 9 - 4th quarter - Vocal Music of the Romantic Period.pptx
Music 9 - 4th quarter - Vocal Music of the Romantic Period.pptxMusic 9 - 4th quarter - Vocal Music of the Romantic Period.pptx
Music 9 - 4th quarter - Vocal Music of the Romantic Period.pptx
 
Influencing policy (training slides from Fast Track Impact)
Influencing policy (training slides from Fast Track Impact)Influencing policy (training slides from Fast Track Impact)
Influencing policy (training slides from Fast Track Impact)
 
Incoming and Outgoing Shipments in 3 STEPS Using Odoo 17
Incoming and Outgoing Shipments in 3 STEPS Using Odoo 17Incoming and Outgoing Shipments in 3 STEPS Using Odoo 17
Incoming and Outgoing Shipments in 3 STEPS Using Odoo 17
 
Choosing the Right CBSE School A Comprehensive Guide for Parents
Choosing the Right CBSE School A Comprehensive Guide for ParentsChoosing the Right CBSE School A Comprehensive Guide for Parents
Choosing the Right CBSE School A Comprehensive Guide for Parents
 
Difference Between Search & Browse Methods in Odoo 17
Difference Between Search & Browse Methods in Odoo 17Difference Between Search & Browse Methods in Odoo 17
Difference Between Search & Browse Methods in Odoo 17
 
Barangay Council for the Protection of Children (BCPC) Orientation.pptx
Barangay Council for the Protection of Children (BCPC) Orientation.pptxBarangay Council for the Protection of Children (BCPC) Orientation.pptx
Barangay Council for the Protection of Children (BCPC) Orientation.pptx
 
USPS® Forced Meter Migration - How to Know if Your Postage Meter Will Soon be...
USPS® Forced Meter Migration - How to Know if Your Postage Meter Will Soon be...USPS® Forced Meter Migration - How to Know if Your Postage Meter Will Soon be...
USPS® Forced Meter Migration - How to Know if Your Postage Meter Will Soon be...
 
Field Attribute Index Feature in Odoo 17
Field Attribute Index Feature in Odoo 17Field Attribute Index Feature in Odoo 17
Field Attribute Index Feature in Odoo 17
 
Active Learning Strategies (in short ALS).pdf
Active Learning Strategies (in short ALS).pdfActive Learning Strategies (in short ALS).pdf
Active Learning Strategies (in short ALS).pdf
 
Virtual-Orientation-on-the-Administration-of-NATG12-NATG6-and-ELLNA.pdf
Virtual-Orientation-on-the-Administration-of-NATG12-NATG6-and-ELLNA.pdfVirtual-Orientation-on-the-Administration-of-NATG12-NATG6-and-ELLNA.pdf
Virtual-Orientation-on-the-Administration-of-NATG12-NATG6-and-ELLNA.pdf
 
4.16.24 21st Century Movements for Black Lives.pptx
4.16.24 21st Century Movements for Black Lives.pptx4.16.24 21st Century Movements for Black Lives.pptx
4.16.24 21st Century Movements for Black Lives.pptx
 
YOUVE_GOT_EMAIL_PRELIMS_EL_DORADO_2024.pptx
YOUVE_GOT_EMAIL_PRELIMS_EL_DORADO_2024.pptxYOUVE_GOT_EMAIL_PRELIMS_EL_DORADO_2024.pptx
YOUVE_GOT_EMAIL_PRELIMS_EL_DORADO_2024.pptx
 
ICS2208 Lecture6 Notes for SL spaces.pdf
ICS2208 Lecture6 Notes for SL spaces.pdfICS2208 Lecture6 Notes for SL spaces.pdf
ICS2208 Lecture6 Notes for SL spaces.pdf
 
FINALS_OF_LEFT_ON_C'N_EL_DORADO_2024.pptx
FINALS_OF_LEFT_ON_C'N_EL_DORADO_2024.pptxFINALS_OF_LEFT_ON_C'N_EL_DORADO_2024.pptx
FINALS_OF_LEFT_ON_C'N_EL_DORADO_2024.pptx
 
Global Lehigh Strategic Initiatives (without descriptions)
Global Lehigh Strategic Initiatives (without descriptions)Global Lehigh Strategic Initiatives (without descriptions)
Global Lehigh Strategic Initiatives (without descriptions)
 
Visit to a blind student's school🧑‍🦯🧑‍🦯(community medicine)
Visit to a blind student's school🧑‍🦯🧑‍🦯(community medicine)Visit to a blind student's school🧑‍🦯🧑‍🦯(community medicine)
Visit to a blind student's school🧑‍🦯🧑‍🦯(community medicine)
 
YOUVE GOT EMAIL_FINALS_EL_DORADO_2024.pptx
YOUVE GOT EMAIL_FINALS_EL_DORADO_2024.pptxYOUVE GOT EMAIL_FINALS_EL_DORADO_2024.pptx
YOUVE GOT EMAIL_FINALS_EL_DORADO_2024.pptx
 
Integumentary System SMP B. Pharm Sem I.ppt
Integumentary System SMP B. Pharm Sem I.pptIntegumentary System SMP B. Pharm Sem I.ppt
Integumentary System SMP B. Pharm Sem I.ppt
 
GRADE 4 - SUMMATIVE TEST QUARTER 4 ALL SUBJECTS
GRADE 4 - SUMMATIVE TEST QUARTER 4 ALL SUBJECTSGRADE 4 - SUMMATIVE TEST QUARTER 4 ALL SUBJECTS
GRADE 4 - SUMMATIVE TEST QUARTER 4 ALL SUBJECTS
 
Earth Day Presentation wow hello nice great
Earth Day Presentation wow hello nice greatEarth Day Presentation wow hello nice great
Earth Day Presentation wow hello nice great
 

Determining Data Quality for NOvA experiment

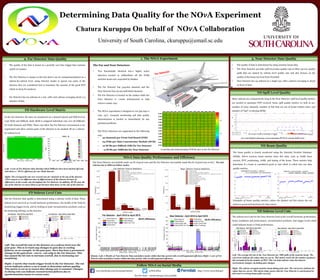
  • 1. NO!A Data Quality Performance and Efficiency The Near Detector successfully made 79.7% of good runs and the Far Detector successfully made 86.2% of good runs so far.! The bad subruns due to different failure modes: Follow NO!A on Social Media www.facebook.com/novaexperiment/ See live data! nusoft.fnal.gov/nova/public @NOvANuz http://www-nova.fnal.gov Bottom: Left: 6 Months of Near Detector Data and failure modes within that time period with overall/segmented efficiency Right: 1 year of Far Detector data and failure modes within that time period, with overall/segmented efficiency 1.8% 6.3% 0.06% 0.8% 0.4% 0.09% 8.3% 0.01% 1. The NO!A Experiment 15.8% 3.1% < 0.1% 14.9% 0.0% 26.1% 14.1% 14.9% 4.9% 0.2% wire (beam direction) • Two functionally identical low-z highly active detectors located 14 milliradians off the NuMi neutrino beam axis, separated by 809km • The Far Detector has 344,064 channels and the Near Detector has 20,192 individual channels. • The Far Detector is located on the surface while the Near Detector is ~100m underground to help remove cosmic rays. • The NOvA experiment is designed to run 365 days a year, 24/7. Constant monitoring and data quality determination is needed to immediately fix any potential problems • The NOvA detectors are segmented in the following way: wire (beam direction) wire (beam direction) 2. Far Detector Data Quality Determining Data Quality for the NO!A Experiment Chatura Kuruppu On behalf of NO!A Collaboration University of South Carolina, ckuruppu@email.sc.edu The Far and Near Detectors• The quality of the data is based on a periodic zero bias trigger that contains 150Hz of cosmics. • The Far Detector is unique in the fact that it can be compartmentalized on a subrun-by-subrun level, using detector masks to ignore any parts of the detector that are considered bad to maximize the amount of the good POT which we keep for analyzes. • Far Detector has 64 subruns in a run, with each subrun averaging about 2-3 minutes of data 3. Near Detector Data Quality • The quality of data is determined by using neutrino beam data. • The Near Detector provides spill level data quality cuts to filter out low quality spills that are missed by subrun level quality cuts and also focuses on the quality of the beam received from Fermilab • Near Detector has 24 subruns in a single run, with a subrun averaging to about an hour of data. FD Hardware Level Matrix In the Far Detector, hit rates are monitored on a channel (pixel) and FEB level in each DCM and DiBlock. Each DCM is assigned individual cuts over all DiBlocks for both channels and FEBs. These cuts allow the Far Detector environment to be segmented and allow certain parts of the detector to be masked off on a subrun- by-subrun level. FD Subrun Level Cuts The Far Detector data quality is determined using a subruns worth of data. These subrun level cuts look at overall hardware performance, the health of the DAQ by monitoring trigger levels, and by looking at basic reconstruction products, such as hit clustering (slicing), in the detector. ND Spill Level Quality Since subruns are comparatively long in the Near Detector, spill level quality metrics are needed to maximize POT received. Some spill quality metrics we look at are: number of noisy channels, number of hits that are out of beam window time, and number of “bad” or missing DCMs ND Subrun Level Cuts The subrun level cuts for the Near Detector look at the overall hardware performance, beam conditions and performance, reconstruction products, and trigger levels which could indicate beam or DAQ performance. Left: The average hit rate in the Near Detector per 1000 spills of the neutrino beam. The red arrows indicate the values that are cut on. This metric tracks the the number of physics hits normalized by the number of POT. This can help indicate when the detector environment changes, including gain changes. Right: The subrun averaged neutrino beam timing peak start. The red arrows indicate the values that are cut on. This metric helps ensure that the Near Detector is synchronized in time and is receiving beam spills correctly. ND Beam Quality The beam quality is closely monitored using the Intensity Frontier Database (IFDB). NOvA receives beam metrics from this data, such as NuMI horn current, POT, positioning, width, and timing of the beam. These metrics help determine if a beam is considered good or bad which is rolled into our data quality metrics. Examples of beam quality metrics, where the dashed red line shows the cut between good and bad beam for that metric Left: A year of Far Detector data showing which DiBlocks have been masked off (red) and shows a ~99.4% efficiency for our whole detector. Right: The averaged hit rate over several runs for channels in the top of the detector. NOvA expects to see different rates in different parts of the detector because of differences in the cosmic rate throughout the Far Detector. In addition, DCMs near the top of the detector are more likely to get hit more than those on the side of the detector. Left: The overall hit rate in the detector on a subrun level over the past year. This is to track any changes in gain due to cooling failures, as an example. In the past year, there has been a permanent change in the gain from ~100 to ~150 only in the Far Detector. This has caused the hit rate to increase overall, due to increasing our sensitivity. Right: A metric that tracks trigger levels in the Far Detector. The red arrow indicates where a cut is made to determine subrun quality. This metric is cut on to ensure that slicing rate is constant. Changes in slicing rate can indicate reconstruction failures due to synchronization issues or excess noise. • 32 channels per Front End Board (FEB) • 64 FEBs per Data Concentrator Module (DCM) • 12 DCMs per DiBlock (DB) for Far Detector • ~4 DCMs per DiBlocks for Near Detector A real time plot demonstrating FEB hit rates in the Far Detector An event display showing a non-reporting DCM in a beam Spill event Far Detector Near Detector NDOS Prototype