Seadrill technical analysis charts
•
0 gostou•84 visualizações

Seadrill technical analysis charts

Recomendados
Mais conteúdo relacionado
Mais de Chartician
Último
Último (20)
Seadrill technical analysis charts
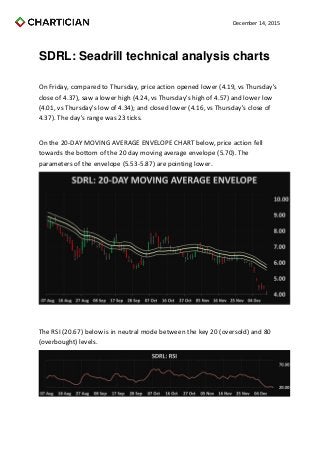
- 1. December 14, 2015 SDRL: Seadrill technical analysis charts On Friday, compared to Thursday, price action opened lower (4.19, vs Thursday's close of 4.37), saw a lower high (4.24, vs Thursday's high of 4.57) and lower low (4.01, vs Thursday's low of 4.34); and closed lower (4.16, vs Thursday's close of 4.37). The day's range was 23 ticks. On the 20-DAY MOVING AVERAGE ENVELOPE CHART below, price action fell towards the bottom of the 20 day moving average envelope (5.70). The parameters of the envelope (5.53-5.87) are pointing lower. The RSI (20.67) below is in neutral mode between the key 20 (oversold) and 80 (overbought) levels.
- 2. December 14, 2015 The MACD 12 day moving average is above the MACD 26 day moving average; both are above zero and falling. The Slow Stochastics, below, are in negative mode, with the K line below the D line. The Commodity Channel Index (-164.06), below, is in positive mode above the oversold -200 level. On the DAILY BOLLINGER BANDS CHART below, Friday represents the 5th consecutive close below the middle of the Bollinger Band envelope (5.70). The Bollinger Bands (4.14-7.26) are diverging; and widened from a width of 284 ticks on Thursday to a width of 312 ticks on Friday.
- 3. December 14, 2015 On the 5 AND 20 DAY MOVING AVERAGES CHART below, the 5 day moving average (4.42, moving down) is below the 20 day moving average (5.70, moving down); in negative mode. The 3-50 day strip of moving averages ranges from the 3 day moving average (4.29) at the bottom of the range to the 50 day moving average (6.40) at the top of the range. The Parabolic Stop and Reverse (5.11) below is in the 23th day of sell mode.
- 4. December 14, 2015 On the WEEKLY BOLLINGER BANDS CHART below, last week represents the 25th consecutive close below the bottom Bollinger Band (4.74). The Bollinger Bands (4.74-8.85) are diverging; expanding from a width of 364 ticks on Thursday to a width of 411 ticks on Friday.