Goldman Sachs Group technical analysis charts
•
0 likes•121 views

http://www.chartician.com/ Goldman Sachs Group technical analysis charts

Recommended
Recommended
More Related Content
Viewers also liked
Viewers also liked (9)
More from Chartician
More from Chartician (11)
Recently uploaded
Recently uploaded (20)
Goldman Sachs Group technical analysis charts
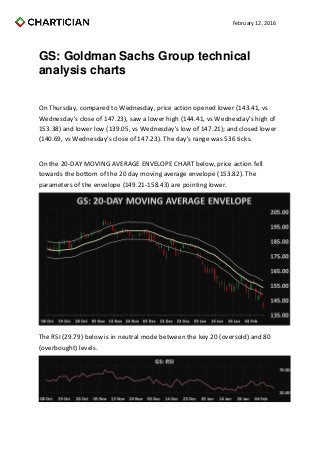
- 1. February 12, 2016 GS: Goldman Sachs Group technical analysis charts On Thursday, compared to Wednesday, price action opened lower (143.41, vs Wednesday's close of 147.23), saw a lower high (144.41, vs Wednesday's high of 153.38) and lower low (139.05, vs Wednesday's low of 147.21); and closed lower (140.69, vs Wednesday's close of 147.23). The day's range was 536 ticks. On the 20-DAY MOVING AVERAGE ENVELOPE CHART below, price action fell towards the bottom of the 20 day moving average envelope (153.82). The parameters of the envelope (149.21-158.43) are pointing lower. The RSI (29.79) below is in neutral mode between the key 20 (oversold) and 80 (overbought) levels.
- 2. February 12, 2016 The MACD 12 day moving average is above the MACD 26 day moving average; both are above zero and falling. The Slow Stochastics, below, are in negative mode, with the K line below the D line. The Commodity Channel Index (-247.13), below, is in neutral mode. On the DAILY BOLLINGER BANDS CHART below, Thursday represents the 19th consecutive close below the bottom Bollinger Band (143.99). The Bollinger Bands (143.99-163.65) are diverging; and widened from a width of 1,603 ticks on Wednesday to a width of 1,966 ticks on Thursday.
- 3. February 12, 2016 On the 5 AND 20 DAY MOVING AVERAGES CHART below, the 5 day moving average (148.38, moving down) is below the 20 day moving average (153.82, moving down); in negative mode. The 3-50 day strip of moving averages ranges from the 3 day moving average (145.39) at the bottom of the range to the 50 day moving average (168.72) at the top of the range.
- 4. February 12, 2016 The Parabolic Stop and Reverse (155.72) below is in the 8th day of sell mode. On the WEEKLY BOLLINGER BANDS CHART below, last week represents the 2nd consecutive close below the bottom Bollinger Band (146.19). The Bollinger Bands (146.19-206.38) are diverging; expanding from a width of 5,058 ticks on Wednesday to a width of 6,019 ticks on Thursday.