Stock Research Report for Yamana Gold Inc AGCO as of 11/17/11 - Chaikin Power Tools
•
1 like•180 views

To order a Chaikin Power Gauge stock research report for AGCO go to http://www.chaikinpowertools.com/reports

Recommended
Recommended
More Related Content
More from Dan Oconnor
More from Dan Oconnor (7)
Recently uploaded
Recently uploaded (20)
Stock Research Report for Yamana Gold Inc AGCO as of 11/17/11 - Chaikin Power Tools
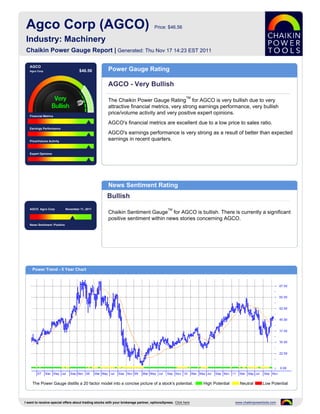
- 1. Agco Corp (AGCO) Price: $46.56 Industry: Machinery Chaikin Power Gauge Report | Generated: Thu Nov 17 14:23 EST 2011 AGCO Agco Corp $46.56 Power Gauge Rating AGCO - Very Bullish TM The Chaikin Power Gauge Rating for AGCO is very bullish due to very attractive financial metrics, very strong earnings performance, very bullish price/volume activity and very positive expert opinions. Financial Metrics AGCO's financial metrics are excellent due to a low price to sales ratio. Earnings Performance AGCO's earnings performance is very strong as a result of better than expected Price/Volume Activity earnings in recent quarters. Expert Opinions News Sentiment Rating Bullish AGCO Agco Corp November 11, 2011 TM Chaikin Sentiment Gauge for AGCO is bullish. There is currently a significant positive sentiment within news stories concerning AGCO. News Sentiment :Positive Power Trend - 5 Year Chart The Power Gauge distills a 20 factor model into a concise picture of a stock's potential. High Potential Neutral Low Potential I want to receive special offers about trading stocks with your brokerage partner, optionsXpress. Click here www.chaikinpowertools.com
- 2. Financials & Earnings Financial Metrics Financial Metrics Rating LT Debt/Equity Ratio Very Bullish Price to Book Value AGCO's financial metrics are excellent. The company has high revenue per share and does not hold much long term debt. Return on Equity The rank is based on a low long term debt to equity ratio, high return on equity, low price to sales ratio and relatively high cash flow. Price to Sales Ratio Business Value Assets and Liabilities Valuation Returns Ratio TTM Ratio TTM Ratio TTM Current Ratio 1.70 Price/Book 1.57 Return on Invest 11.7% LT Debt/Equity 0.17 Price/Sales 0.65 Return on Equity 13.4% Earnings Performance Earnings Performance Rating Earnings Growth Very Bullish Earnings Surprise AGCO's earnings performance has been very strong. The company has outperformed analysts' earnings estimates and experienced superior earnings growth in the past 12 months. Earnings Trend The rank is based on poor EPS growth over the past 3-5 years, better than Projected P/E Ratio expected earnings in recent quarters, an upward trend in earnings this year, a relatively low projected P/E ratio and consistent earnings over the past 5 years. Earnings Consistency 5 Year Revenue and Earnings Growth EPS Estimates 12/06 12/07 12/08 12/09 12/10 Factor Actual EPS Prev EST EPS Current Change Revenue(M) 5,435.00 6,828.10 8,424.60 6,630.40 6,896.60 Quarterly EPS $0.92 $1.30 +0.38 Rev % Growth -0.27% 25.63% 23.38% -21.30% 4.01% Yearly EPS $2.38 $4.34 +1.96 EPS $-0.71 $2.69 $4.36 $1.47 $2.38 Factor Actual EPS Growth Est EPS Growth Change EPS % Growth -302.86% 478.87% 62.08% -66.28% 61.90% 3-5 year EPS 6.29% 18.76% +12.47 EPS Surprise EPS Quarterly Results Estimate Actual Difference % Difference FY Qtr 1 Qtr 2 Qtr 3 Qtr 4 Total Latest Qtr $0.75 $0.87 $0.12 16.00 12/09 $0.37 $0.62 $0.12 $0.36 $1.47 1 Qtr Ago $1.13 $1.35 $0.22 19.47 12/10 $0.11 $0.68 $0.67 $0.92 $2.38 2 Qtr Ago $0.37 $0.81 $0.44 118.92 12/11 $0.85 $1.41 $0.88 - - 3 Qtr Ago $0.76 $0.88 $0.12 15.79 Fiscal Year End Month is December. I want to receive special offers about trading stocks with your brokerage partner, optionsXpress. Click here www.chaikinpowertools.com
- 3. Price Trend & Expert Opinions Price/Volume Activity Price/Volume Activity Rating Relative Strength vs Market Very Bullish Chaikin Money Flow Price and volume activity for AGCO is very bullish. AGCO is experiencing sustained buying and has a rising price trend. Price Trend The rank for AGCO is based on positive Chaikin money flow and a positive Price Trend ROC Chaikin price trend. Volume Trend Relative Strength vs S&P500 Index Chaikin Money Flow Chart shows whether AGCO is performing better or worse than the market. Chaikin Money Flow analyzes supply and demand for a company's stock. Price Activity Price Activity Volume Activity Factor Value Factor Value Factor Value 52 Week High 58.13 % Change Price - 4 Weeks 21.51% Average Volume 20 Days 1,766,175 52 Week Low 32.39 % Change Price - 24 Weeks -5.08% Average Volume 90 Days 2,006,259 % Change YTD Rel S&P 500 -8.84% % Change Price - 4 Wks Rel to S&P 18.85% Chaikin Money Flow Persistency 62% % Change Price - 24 Wks Rel to S&P 0.88% Expert Opinions Expert Opinions Earnings Estimate Revisions Very Bullish Short Interest Expert opinions about AGCO are very positive. Analysts are raising their EPS estimates for AGCO and shorting of AGCO is low. Insider Activity The rank for AGCO is based on analysts revising earnings estimates upward, a low short interest ratio, optimistic analyst opinions and price strength of the stock Analyst Opinions versus the Machinery industry group. Relative Strength vs Industry Earnings Estimate Revisions Analyst Recommendations EPS Estimates Revision Summary Current 7 Days Ago % Change Factor Value Last Week Last 4 Weeks Current Qtr 1.30 1.29 +0.78% Mean this Week Buy Up Down Up Down Next Qtr 0.89 0.89 0.00% Mean Last Week Buy Curr Qtr 0 0 8 0 Curr Yr 1 0 10 0 Current 30 Days Ago % Change Change 0.00 Next Qtr 0 0 2 0 Current FY 4.34 4.11 0.23 Mean 5 Weeks Ago Buy Next Yr 1 0 7 1 I want to receive special offers about trading stocks with your brokerage partner, optionsXpress. Click here www.chaikinpowertools.com
- 4. The Company & Its Competitors AGCO's Competitors in Machinery News Headlines for AGCO Company Power Historic EPS Projected EPS Profit Margin PEG PE Revenue(M) AGCO Corp 3Q net income jumps 35 percent - Gauge growth growth Oct 25, 2011 AGCO 6.29% 18.76% 4.55% 0.57 11.90 6,897 AGCO Develops Combine Business in China CNH 5.96% 14.50% 5.25% 0.74 10.20 15,608 with Acquisition of Shandong Dafeng Machinery Co., Lt - Apr 27, 2011 BGG -3.44% 7.00% 1.25% 1.63 11.39 2,110 EU (Stage IIIB) And EPA (Tier 4 interim) KUB 4.54% 6.11% 5.86% 2.47 15.35 10,924 Approve Exhaust Emission for AGCO SISU POWER Engines - Dec 21, 2010 DE 5.15% 13.96% 8.46% 0.76 12.57 - AGCO Expands Parts Business with Acquisition LNN 20.85% 16.77% 7.68% 1.10 20.31 479 of Sparex Holdings Ltd - Nov 5, 2010 ARTW 16.41% - 3.57% - 25.75 29 AGCO Grows Harvesting Business with Acquisition of Remaining Share of Laverda S.p.A - Nov 3, 2010 Company Details Company Profile AGCO CORP AGCO CORP. is engaged in the manufacturer and distribution of farm equipment, 4205 RIVER GREEN PKWAY machinery and replacement parts in the United States and Canada. Products include DULUTH, GA 30096 tractors, combines, hay tools and forage equipment and implements. USA Phone: 7708139200 Fax: 770-813-6118 Website: http://http://www.agcocorp.com Full Time Employees: 14,300 Sector: Industrial Products Power Gauge Ratings are created using a relative ranking system that assigns a rank of 0 to 100 (100 being the highest) to each stock in the universe. Rank is calculated by evaluating each of the stocks factors and combining them into a single number using a weighting formula. A stock's rank ranges from 100-0, where 100 is the strongest, and a rank of 95 indicates the stock is better than 95% of the stocks in the universe. Chaikin Stock Research(CSR) is not registered as a securities broker dealer or investment advisor with either the U.S. Securities and Exchange Commission or with any state securities regulatory authority. CSR is not responsible for trades executed by users of this research report, our web site or mobile app based on the information included herein. The information presented in this report does not represent a recommendation to buy or sell stocks or any financial instrument nor is it intended as an endorsement of any security or investment. The information in this report is generic by nature and is not personalized to the specific financial situation of any individual. The user bears complete responsibility for their own investment research and should seek the advice of a qualified investment professional before making any investment decisions. Copyright (c) 1978-(Present) by ZACKS Investment Research, Inc ("ZACKS"). The information, data, analyses and opinions contained herein (1) includes the confidential and proprietary information of ZACKS, (2) may not be copied or redistributed, for any purpose, (3) does not constitute investment advice offered by ZACKS, (4) are provided solely for informational purposes, and (5) are not warranted or represented to be correct, complete, accurate or timely. ZACKS shall not be responsible for investment decisions, damages or other losses resulting from, or related to, use of this information, data, analyses or opinions. Past performance is no guarantee of future performance. ZACKS is not affiliated with Chaikin Power Tools. This report from Chaikin Power Tools is for informational purposes only and is not a recommendation to buy or sell securities. LM 2.3 DS 3.0 LS 2.1 Data Provided by ZACKS Investment Research, Inc., www.zacks.com Special offers to trade stocks from optionsXpress: www.chaikinpowertools.com