Stock Research Report for AIG as of 8/17/11 - Chaikin Power Tools
•
0 gostou•118 visualizações

To order a free Chaikin Power Gauge stock research report for AIG go to http://www.chaikinpowertools.com/reports

Recomendados
Recomendados
Mais conteúdo relacionado
Último
Último (20)
Destaque
Destaque (20)
Stock Research Report for AIG as of 8/17/11 - Chaikin Power Tools
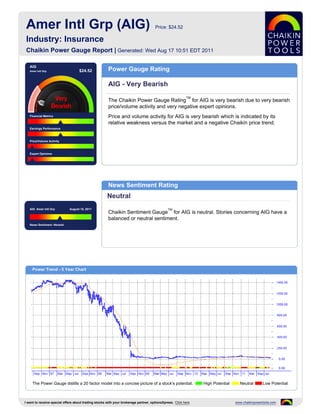
- 1. Amer Intl Grp (AIG) Price: $24.52 Industry: Insurance Chaikin Power Gauge Report | Generated: Wed Aug 17 10:51 EDT 2011 AIG Amer Intl Grp $24.52 Power Gauge Rating AIG - Very Bearish TM The Chaikin Power Gauge Rating for AIG is very bearish due to very bearish price/volume activity and very negative expert opinions. Financial Metrics Price and volume activity for AIG is very bearish which is indicated by its relative weakness versus the market and a negative Chaikin price trend. Earnings Performance Price/Volume Activity Expert Opinions News Sentiment Rating Neutral AIG Amer Intl Grp August 15, 2011 TM Chaikin Sentiment Gauge for AIG is neutral. Stories concerning AIG have a balanced or neutral sentiment. News Sentiment :Neutral Power Trend - 5 Year Chart The Power Gauge distills a 20 factor model into a concise picture of a stock's potential. High Potential Neutral Low Potential I want to receive special offers about trading stocks with your brokerage partner, optionsXpress. Click here www.chaikinpowertools.com
- 2. Financials & Earnings Financial Metrics Financial Metrics Rating LT Debt/Equity Ratio Neutral Price to Book Value AIG's financial metrics are neutral. The company may be undervalued and is carrying too much long term debt. Return on Equity The rank is based on a high long term debt to equity ratio, low price to book value, low return on equity, high price to sales ratio and relatively high cash flow. Price to Sales Ratio Business Value Assets and Liabilities Valuation Returns Ratio TTM Ratio TTM Ratio TTM Current Ratio 0.39 Price/Book 0.50 Return on Invest 0.9% LT Debt/Equity 0.00 Price/Sales 0.70 Return on Equity 1.4% Earnings Performance Earnings Performance Rating Earnings Growth Neutral Earnings Surprise AIG's earnings performance has been neutral. The company has outperformed analysts' earnings estimates and has a history of weak earnings growth. Earnings Trend The rank is based on poor EPS growth over the past 3-5 years, better than expected earnings in recent quarters, a relatively low projected P/E ratio and Projected P/E Ratio inconsistent earnings over the past 5 years. Earnings Consistency 5 Year Revenue and Earnings Growth EPS Estimates 12/06 12/07 12/08 12/09 12/10 Factor Actual EPS Prev EST EPS Current Change Revenue(M) - 110,064.00 11,104.00 96,004.00 66,767.00 Quarterly EPS $-17.62 $0.63 +18.25 Rev % Growth - - -89.91% 764.59% -30.45% Yearly EPS $11.60 $3.45 -8.15 EPS $107.40 $47.73 $-756.80 $-90.48 $11.60 Factor Actual EPS Growth Est EPS Growth Change EPS % Growth 34.59% -55.56% -1,685.59% 88.04% 112.82% 3-5 year EPS 214.74% 10.00% -204.74 EPS Surprise EPS Quarterly Results Estimate Actual Difference % Difference FY Qtr 1 Qtr 2 Qtr 3 Qtr 4 Total Latest Qtr $1.15 $0.72 $-0.43 -37.39 12/09 $-39.60 $2.30 $0.68 $-65.51 $-102.13 1 Qtr Ago $-0.15 $1.30 $1.45 966.67 12/10 $2.16 $-3.96 $-17.62 $16.60 $-2.82 2 Qtr Ago $-16.98 $-16.20 $0.78 4.59 12/11 $-0.35 $1.00 - - - 3 Qtr Ago $1.35 $-1.47 $-2.82 -208.89 Fiscal Year End Month is December. I want to receive special offers about trading stocks with your brokerage partner, optionsXpress. Click here www.chaikinpowertools.com
- 3. Price Trend & Expert Opinions Price/Volume Activity Price/Volume Activity Rating Relative Strength vs Market Very Bearish Chaikin Money Flow Price and volume activity for AIG is very bearish. AIG has underperformed the S&P 500 over 26 weeks and has a declining price trend. Price Trend The rank for AIG is based on its relative weakness versus the market, negative Price Trend ROC Chaikin money flow, a negative Chaikin price trend, a positive Chaikin price trend ROC and a decreasing volume trend. Volume Trend Relative Strength vs S&P500 Index Chaikin Money Flow Chart shows whether AIG is performing better or worse than the market. Chaikin Money Flow analyzes supply and demand for a company's stock. Price Activity Price Activity Volume Activity Factor Value Factor Value Factor Value 52 Week High 61.18 % Change Price - 4 Weeks -12.06% Average Volume 20 Days 10,580,155 52 Week Low 22.14 % Change Price - 24 Weeks -33.22% Average Volume 90 Days 12,145,579 % Change YTD Rel S&P 500 -57.17% % Change Price - 4 Wks Rel to S&P -2.18% Chaikin Money Flow Persistency 38% % Change Price - 24 Wks Rel to S&P -26.86% Expert Opinions Expert Opinions Earnings Estimate Revisions Very Bearish Short Interest Expert opinions about AIG are very negative. Short interest in AIG is high and analysts's opinions on AIG have been more negative recently. Insider Activity The rank for AIG is based on a high short interest ratio, insiders purchasing stock, pessimistic analyst opinions and relative weakness of the stock versus the Analyst Opinions Insurance industry group. Relative Strength vs Industry Earnings Estimate Revisions Analyst Recommendations EPS Estimates Revision Summary Current 7 Days Ago % Change Factor Value Last Week Last 4 Weeks Current Qtr 0.64 0.67 -4.48% Mean this Week Buy Up Down Up Down Next Qtr 0.74 0.74 0.00% Mean Last Week Buy Curr Qtr 0 1 2 7 Curr Yr 0 1 3 7 Current 30 Days Ago % Change Change 0.00 Next Qtr 0 1 3 6 Current FY 3.45 3.85 -0.40 Mean 5 Weeks Ago Buy Next Yr 1 0 2 6 I want to receive special offers about trading stocks with your brokerage partner, optionsXpress. Click here www.chaikinpowertools.com
- 4. The Company & Its Competitors AIG's Competitors in Insurance News Headlines for AIG Company Power Historic EPS Projected EPS Profit Margin PEG PE Revenue(M) Posting Profit, A.I.G. Aims To Trim Gauge growth growth Government's Stake - Aug 5, 2011 AIG 214.74% 10.00% 15.41% 0.71 - 66,767 AIG airplane leasing unit buys AerCap engine PUK -4.81% 9.00% - 1.14 - 73,661 unit - Aug 3, 2011 ILFC to Acquire AerCap’s AeroTurbine AEG -9.04% -2.00% 4.05% -3.32 6.46 41,975 Subsidiary - Aug 3, 2011 MET 4.54% 9.00% 4.53% 0.72 7.15 52,717 EDITORIAL: Report: Bailouts one-sided - Aug 2, 2011 DealBook: Validus Takes Bid for Transatlantic to Shareholders - Jul 25, 2011 Company Details Company Profile AMER INTL GRP American International Group, Inc., world leaders in insurance and financial services, is 70 PINE ST the leading international insurance organization with operations in more than one NEW YORK, NY 10270 hundred thirty countries and jurisdictions. AIG companies serve commercial, institutional USA and individual customers through the most extensive worldwide property-casualty and life Phone: 2127707000 insurance networks of any insurer. In addition, AIG companies are leading providers of Fax: 212-425-3499 retirement services, financial services and asset management around the world. Website: http://http://www.aig.com Full Time Employees: 63,000 Sector: Finance Power Gauge Ratings are created using a relative ranking system that assigns a rank of 0 to 100 (100 being the highest) to each stock in the universe. Rank is calculated by evaluating each of the stocks factors and combining them into a single number using a weighting formula. A stock's rank ranges from 100-0, where 100 is the strongest, and a rank of 95 indicates the stock is better than 95% of the stocks in the universe. Chaikin Stock Research(CSR) is not registered as a securities broker dealer or investment advisor with either the U.S. Securities and Exchange Commission or with any state securities regulatory authority. CSR is not responsible for trades executed by users of this research report, our web site or mobile app based on the information included herein. The information presented in this report does not represent a recommendation to buy or sell stocks or any financial instrument nor is it intended as an endorsement of any security or investment. The information in this report is generic by nature and is not personalized to the specific financial situation of any individual. The user bears complete responsibility for their own investment research and should seek the advice of a qualified investment professional before making any investment decisions. Copyright (c) 1978-(Present) by ZACKS Investment Research, Inc ("ZACKS"). The information, data, analyses and opinions contained herein (1) includes the confidential and proprietary information of ZACKS, (2) may not be copied or redistributed, for any purpose, (3) does not constitute investment advice offered by ZACKS, (4) are provided solely for informational purposes, and (5) are not warranted or represented to be correct, complete, accurate or timely. ZACKS shall not be responsible for investment decisions, damages or other losses resulting from, or related to, use of this information, data, analyses or opinions. Past performance is no guarantee of future performance. ZACKS is not affiliated with Chaikin Power Tools. This report from Chaikin Power Tools is for informational purposes only and is not a recommendation to buy or sell securities. LM 2.3 DS 3.0 LS 2.1 Data Provided by ZACKS Investment Research, Inc., www.zacks.com Special offers to trade stocks from optionsXpress: www.chaikinpowertools.com