Introduction to ecg
•Download as PPTX, PDF•
17 likes•8,756 views

Lecture By Dr.Haifa Khedier ER Doctor. MGH Madinah, KSA

Recommended
More Related Content
What's hot
What's hot (20)
Viewers also liked
Viewers also liked (14)
Similar to Introduction to ecg
Similar to Introduction to ecg (20)
More from MEEQAT HOSPITAL
More from MEEQAT HOSPITAL (20)
Recently uploaded
Recently uploaded (20)
Introduction to ecg
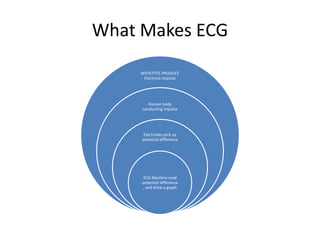
- 1. What Makes ECG MYOCYTES PRODUCE Electrical impulse Human body conducting impulse Electrodes pick up potential difference ECG Machine read potential difference , and draw a graph
- 2. What is electrode ? Special Sensor devices Connected to certain areas in the body Pick up potential difference They known as leads
- 3. Types of leads ( Electrodes ) Bipolar Limb Leads Unipolar Leads Chest leads V1 to V6
- 4. What is Bipolar leads Lead 1 Lead 11 Lead 111 • +ve LA • -ve RA • +ve LL • -ve RA • +ve LL • -ve LA
- 5. Bipolar Limb Leads Can be located at any part of the limb 10 cm from the heart They form equilateral triangle Einthoven triangle
- 6. Augmented Unipolar leads aVR • +ve • RA aVF • +ve • Lf aVL • +ve • LA
- 7. Augmented Unipolar leads • No Negative pole • Instate the reference is the other two leads • The machine change the leads without addition of attached devices
- 8. Chest leads Location V1 Rt 4th IC V2 Lt 4th IC V3 HALF WAY V2&V4 V4 LT 5th IC V5 5th IC , AAL V5 5th IC ,MAL
- 9. Hexaxial system • Two victors(leads) are equal in intensity ,and polarity as long as they are parallel • Accordingly we can shit the leads to a point passing through the heart center, and they will be the same • The location of the lead is determined by its positive pole • Direction of the Lead is from Positive to Negative electrode
- 10. • The direction of the unipolar lead is towards the center of the corresponding limb of the triangle, otherwise same is applied as in bipolar leads
- 11. Hexaxial system
- 12. Anatomical representations of the leads
- 13. Anatomical representations of the leads
- 14. ECG paper
- 15. ECG paper
- 16. ECG paper Calibration Box Found at edge of ECG paper Standard 10 mm height (1MV ) .2 second width To confirm standard ECG format
- 17. ECG Components Waves Segment Interval • A deflections from the base line represent cardiac event • P- QRS- T waves • A specific portion of the complex • PR – ST • Distance measured as time between two cardiac events • QT- PR- TP
- 18. Waves Waves represent : Atrial , or ventricular depolarization , repolarization and conduction Can be positive ,negative or biphasic deflection from the baseline Baseline from one TP segment to the next
- 19. ECG Representation of cardiac events • • • • • • Atrial depolarizatio Atrial Repolarization Conduction Ventricular depolarization Ventricular Repolarization Conduction
- 20. ECG Segments & Intervals Segments Intervals Additional intervals PR PR RR ST QT PP
- 21. P- Wave • First wave after TP • Represent atrial depolarization and conduction • Duration 0.08 – 0.11 second • Direction of the impulse is downwards & to the left • It is upright in leads 11,111,& aVf • Downwards in aVR • It must be upright in Leads 11 & aVF to say sinus rhythm
- 22. TP wave • Represent repolarization of Atria • Usually not seen • It occurs when there is no QRS after P as in Av dissociation • It can also be seen in PR or ST depression
- 23. PR Segment • From end of P to beginning of QRS • Usually at the base line • Depression of up to 0.8 mm is accepted as normal • Pathological depression in pericarditis and atrial ischemia
- 24. PR Interval • Include P wave ,and PR segment • Cover the event from initiation of impulse at SA node to start of ventricular depolariz. • Duration o.12 sec. to 0.20 sec. • < 0.11 shortening • > 0.20 1st degree heart block
- 25. QRS Complex • Composed of two or more waces • Represent ventricular depolarization • Duration is up to 0.12 second
- 26. How to identify different waves Q wave R wave S wave • The first negative wave after P wave • The first Positive wave after P wave • The first negative deflection after R wave
- 27. An X Prime wave • • • • • Extra wave in QRS It isn't an actual wave Change in QRS QRS become bizarre S wave : only when cross the baseline
- 28. Q Wave Can be significant if : 0.03 second or wider Equal to or greater than 1/3rd of height of R wave Non significant Q wave Commonly found in Leads : 1 , aVL & V6
- 29. The Intrinsicoid Deflection • Beginning of QRS to the beginning of negative down slope of the R wave when no Q wave • Represent the time of electrical impulse from purkinje fibers to surface of epicardium • It is longer in left preicordial leads V5, V6 • Prolongation in LVH , BBB
- 30. The ST Segment • End of QRS to Beginning of T • Usually along the base line with normal variation of 1 mm in limbs leads & 3 mm in Right chest leads • The point of junction with QRS is called J point • Represent the period from depol. to repol. of ventricles
- 31. The T Wave • Represent ventricular repolarization • negative or positive deflection after ST Segment • Should be The same direction of QRS • It is asymmetric , begin sloping and end is faster
- 32. How to measure asymmetry • Draw a line from the peak of T wave to the base line , and measure each side • Asymmetry is usually a sign of pathology , but may be normal
- 33. QT Interval QRS + ST + T Represent all the event of ventricular systole Varies with Rate ,age sex , and electrolyte abnormality prolongation predispose to arrhythmias
- 34. Best way to measure QT Interval • Normal QT Is less than the half of R-R Interval • Accordingly lengthen when the heart rate slow, and shorten when fast • This makes it hard to calculate the interval at which QT is normal
- 35. QTc Interval • • • • • Stand for QT corrected Interval Corrected for the heart rate QTc interval calculation is the best way. Normal QTc : 0.410 second prolonged QTc : > 0.419 second
- 37. U - Wave • A small flat wave sometimes seen after the T wave • Representation unknown • Clinical significance : Hypokalemia Hyperkalemia Inaccuracy in measuring QT segment
- 38. Additional Intervals • R-R Interval • The distance between peaks of R waves in two consecutive QRS • P-P interval • Distance between two identical points of one P to the next • These intervals are useful in evaluation of Rhythm