
Recommended
More Related Content
What's hot
What's hot (20)
Viewers also liked
Viewers also liked (20)
Similar to Climate change: Extreme weather events
Similar to Climate change: Extreme weather events (20)
More from cdenef
More from cdenef (15)
Recently uploaded
Recently uploaded (20)
Climate change: Extreme weather events
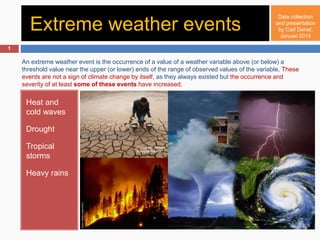
- 1. Extreme weather events Heat and cold waves Drought Tropical storms Heavy rains Photograph: Stringer Shanghai/Reuters An extreme weather event is the occurrence of a value of a weather variable above (or below) a threshold value near the upper (or lower) ends of the range of observed values of the variable. These events are not a sign of climate change by itself, as they always existed but the occurrence and severity of at least some of these events have increased. 1 Data collection and presentation by Carl Denef, Januari 2014
- 2. Land summer temperature distribution has shifted From 1951 to 1961, only 1% of the land area in the Northern Hemisphere was exposed to temperatures higher than 3 standard deviations (SD) from the mean for 1951–1980. But from 2001-2011, 11% of land area was exposed to temperatures higher than 3 SD away from the average. About 1% of land area, an area twice the size of France, experienced heat extremes of 5 SD from the mean. The same trend is seen in the Southern Hemisphere. 2
- 3. The annual frequency of warm nights (90th percentile) and warm days (90th percentile) for the period 1950-2010 is increasing, relative to the period 1961 to 1990, in many regions of the World. The same trend is seen in decadal values (right panel). Occurrence of warm nights is more widespread than that of warm days. From IPCC AR5 Figure 2.32. Extreme high temperatures become more frequent The Figure shows 3 datasets: HadEX2; HadGHCND and GHCNDEX 3
- 4. In contrast, the incidence of cold days and nights (10th percentile of temperatures) have decreased. From IPCC AR5 Figure 2.32 4
- 5. Also in Europe the number of hot days since 1960 have increased. In the Figure higher confidence in the long-term trend is shown by a black dot. From European Environment Agency 5
- 6. Warmest day of the year Between 1951 and 2010 there was a robust rise in the temperature value of the warmest day of the year in many areas of the World. The trend was up to >1 °C per decade. This means up to 10 °C in some areas From IPCC AR5 Box 2.4, Figure 1. 6
- 7. Heat waves Heat waves are often associated with quasi-stationary anticyclonic circulation anomalies that produce prolonged hot weather. Heat waves can be amplified by pre-existing dry soil conditions, induced by precipitation deficits or evapotranspiration excesses, such as in the extreme summer heat waves in southeastern Europe. According to IPCC AR5, there is “only medium confidence that the length and frequency of warm spells, including heat waves, has increased since the middle of the 20th century. The confidence is medium due to lack of data in Africa and South America. However, it is likely that heat wave frequency has increased during this period in large parts of Europe, Asia and Australia.” Several high-profile heat waves have occurred in recent years (e.g., in Europe in 2003, Australia in 2009, Russia in 2010 and USA in 2011/2012. With high confidence, Hansen et al. (2012)[47] attributed the 2010 Moscow and 2011 Texas heat waves to human- induced global warming , although Dole et al. (2011)[48] concluded that the 2010 Moscow heatwave was mostly due to natural climate variability. As reviewed in the journal Science, april 2011, 332:220-224, the summer of 2003 was exceptionally hot in western and central Europe, causing around 70,000 heat-related deaths. In summer 2010, many cities in eastern Europe recorded extremely high mean temperature: 38.2°C in daytime in Moscow, 25°C at night in Kiev, and 26.1°C day average in Helsinki. Russia counted 55,000 deaths, an annual crop failure of ~25%, more than 1 million hectares a of burned area, and ~$15 billion of total economic loss (~1% of gross domestic product). During the same period, parts of eastern Asia also experienced 7
- 8. extremely warm weather, while Pakistan was hit by devastating monsoon floods. The European 2010 summer temperature anomaly was +1.8°C, i.e. 3.5 standard deviations difference relative to 1970–1999. Further, hottest summers occurrence stands substantially above any other 10-year period since 1500 (see Figure next slide). At least two summers in this decade have been the warmest of the last 510 years in Europe. It should be noted, on the other hand, that there is also evidence that periods prior to the 1950s had more heat waves in some regions (e.g., over the USA during the 1930s decade, while in other regions heatwave trends may have been underestimated due to poor quality and/or consistency of data (e.g., over Western Europe and over the Mediterranean). In South America, Africa, Middle-East and South-East Asia, there is low confidence or insufficient evidence (lack of data) for any change. In other parts of Asia the trends are variable, but there are more regions of increase in heat waves than decrease. 8
- 9. The Figure shows the statistical frequency distribution of european summer land temperature anomalies for the 1500–2010 period (vertical lines). Anomalies in °C relative to the 1970–1999 period are shown in X-axis, and the individual summers are represented by the vertical lines. The 5 warmest and coldest summers are highlighted. The Gaussian fit is in black. As can be seen the 5 hottest summers all fall in the last decade. Bottom shows the decadal frequency of summers with temperature above the 95th percentile of the 1500–2002 distribution. European summer temperatures for 1500–2010, constructed from instrumental and proxy data. From Science, april 2011, 332:220-49
- 10. Europe was again unusually hot in July-August 2013. The map shows average surface temperature anomalies between July 16 and August 11, 2013, compared to the 1981-2010 average for the same time of year. Austria had its record highest ever (40°C) on August 8. Source10
- 11. Record high and low temperatures in the U.S. As shown in the Figure below, record Highs now outpace record Lows by 2:1, as observed at about 1,800 weather stations in the 48 contiguous United States from January 1950 through September 2009. Meehl et al. 2009 Read more 11
- 12. Droughts Long-term droughts (persisting for periods up to a decade or longer) are a recurring feature of Holocene paleoclimate records in North America, East and South Asia, Europe, Africa and India. The transitions into and out of the long-term droughts take many years. These events are natural and since the long-term droughts all ended they are not irreversible. Several recent studies suggest that regional reductions in precipitation are primarily due to climate variability and that man-caused trends are currently weak. To measure drought conditions the Palmer Drought Severity Index (PDSI) is used on a scale of zero (normal rainfall) to -4 (extreme drought). It is used also for wet spells, in which case positive numbers are used. It is calculated from a simple water-balance model including monthly precipitation and temperature data. The global very dry areas were found doubled since the 1970s, consistent with decreases in regional precipitation and of increasing evaporation due to global warming. The Figure shows the increasing trend in regional cumulative deficit in surface land moisture (relative to local mean conditions) as well as the global PDSI between 1900 and 2002. Figure from IPCC AR4 12
- 13. Recently, however, scientists at Princeton University showed that the PDSI overestimates drought trends because the model relies too much on surface temperature, that itself is increasing due to climate change[Ref] . They developed a new model that included inputs such as solar radiation, humidity and wind. The Figure shows drought condition trends over the past 60 years (1950–2008), made up with the mentioned method. Red areas indicate increasing levels of drought while blue areas are less prone to dry conditions. Drought changes are small. According to IPCC AR5, observed trends in drought or dryness (lack of rainfall) since the middle of the 20th century have low confidence at a global-scale, due to lack of direct observations, geographical inconsistencies in the trends, and dependencies of trends quantitation on the index choice. However, it is likely that the frequency and intensity of drought has increased in the Mediterranean and West Africa and decreased in central North America and north-west Australia since 1950. 13
- 14. Lake shrinkage and decreased river flow Top: The Cheyenne Bottoms Wildlife Wetlands in Kansas. The region was dramatically impacted by the drought in 2012. There was sufficient water in the wetland area in 2010, but the levels began to diminish in 2011. By mid-July 2012, virtually all the water had evaporated. The area has provided a resting place for millions of migrating birds every fall. Images taken by Landsat 5 and Landsat 7. Source: U.S. Geological Survey (USGS) Landsat Missions Gallery, U.S. Department of the Interior / USGS and NASA. Bottom: Bahr al Milh (Lake Razazah) in Iraq. This is a salt lake, fed by the Euphrates River. Water levels have been drastically low year-round in the past decade. Images taken by Landsat 5, Landsat 7, and Landsat 8. Source: U.S. Geological Survey (USGS) Landsat Missions Gallery U.S. Department of the Interior / USGS and NASA. 14
- 15. Reservoir shrinkage The photo shows Boulder Basin, the western part of Lake Mead, in Nevada/Arizona. Lake Mead is one of the largest reservoirs in the World, supplying water to California, Arizona, Nevada and Mexico. Since 2000 the water level has been dropping at a fairly steady rate due to lower snowfall. As of July 2010, the lake is at 38 % of its capacity. Between January 2001 and April 2004, the water level dropped 18 m. January 30, 2001 April 28, 2004 15
- 16. Tropical cyclones (typhoons, hurricanes, tornados) A tropical cyclone is a rapidly-rotating storm system characterized by a low-pressure center, strong winds, and a spiral arrangement of thunderstorms that produce heavy rain. Tropical cyclone generation relies upon several meteorological conditions. Local sea surface temperatures must be around 26.5 °C. Evaporation from warm surface waters creates high humidity in the atmosphere, and then leads to thunderstorm development. If multiple thunderstorm systems converge, a storm with a vortex movement develops. The vortex takes additional heat and water vapor from the surface of the ocean and releases it into the atmosphere in the form of rainfall. High winds are created. The more heat available at the surface, the higher the potential winds. Once wind speeds exceed 55 km/h, the system becomes a tropical storm and is assigned a name. Distribution of average sea surface temperature (SST) over the globe Tropical storm seen from Space 16
- 17. On the basis of the role of sea surface temperature on the severity of the cyclone, it can be expected that global warming may facilitate the incidence and/or severity of tropical cyclones. A 2005 study published in the journal Nature examined the duration and maximum wind speeds of each tropical cyclone over the last 30 years (Nature. 436:686- 688) and found that their destructive power has increased around 70 percent in both the Atlantic and Pacific Oceans. Another 2005 study (Science. 309: 1844-1846), revealed that the percentage of hurricanes classified as Category 4 or 5 (the two strongest categories on the Saffir-Simpson scale) has increased over the same period. A categoty 5 cyclone provokes ≥ 252 km/h wind speeds. Read more about category 5 tropical cyclones here The IPCC AR4 also concluded that there is no clear trend in the annual numbers of tropical cyclones but that there is a significant increase in severity (expressed by the « power dissipation index ») since 1970. Severity parallels sea surface temperature. Read more Source On November 7, 2013 the category 5 typhoon Haiyan made landfall on the Phillipines with one-minute sustained winds of 315 km/h and gusts up to 378 km/h.[24] These wind speeds made this tropical cyclone the strongest tropical landfalling cyclone on record [25]. There were thousands of death. 17
- 18. N-Atlantic tropical storms occur in cycles, quiet periods alternating with intense periods. There is a striking co-incidence with the cycles of AMO (see section on climate variability). When it is in a warm phase, the tendency is to have a very busy hurricane period. The opposite occurs in the cool phases, Source NOAA 18
- 19. Precipitation extremes As can be seen in the Figure there is a positive trend in the annual amount of extreme precipitation (expressed as days above the 95th percentile of precipitation distribution) in Eastern U.S. and Northern Europe between 1951 and 2010. From IPCC AR5 Figure 2.33 19
- 20. Extreme one-day precipitation in U.S. This figure (from EPA) shows the percentage of the land area where a much greater than normal portion of total annual precipitation has come from extreme single-day precipitation events. The bars represent individual years, while the line is a nine-year weighted average. Data source: NOAA, 2012 4 An increase is seen during the last 3 decades Read more 20
- 21. Floods Heavier rains together with sea level rise, tides and storm surges drive the occurrence of flood. Floods have become more frequent. Major floods that used to happen only once in 100 years now take place every 10 or 20 years. Look at animated map Figure From Data from EM-DAT Data from EM-DAT: The OFDA/CRED International Disaster Database – www.emdat.be – Université catholique de Louvain – Belgium. Numberofeventsreported 21
- 22. Examples of floods Flooding in Pakistan. In summer 2010 the Indus River in Pakistan caused a flood that was called one of the worst humanitarian disasters in history, as a result of heavy monsoon rains. More than a million acres were flooded, destroying crops and devastating cities including Sukkar, Mehar, and Dadu. The number of people directly affected exceeded 21 million, 1,800 were killed and 10 million left without shelter. Almost five million people were affected when heavy rains flooded parts of Baluchistan [Pakistan], Punjab [India] and Sindh [Pakistan] from mid-September 2012. Persistent floodwater caused many to get homeless for months. Over a million people who did return to their villages at the end of 2012, found their homes too badly damaged to inhabit . Read more here Also Oxfam reports: “Disasters escalating four-fold as climate change hits poor hardest” Read more here A list of floods can be seen in Wikipedia 22
- 23. View other slide shows on extreme weather 23