CBO's 2012 Long-Term Projections for Social Security
•
1 gostou•24,302 visualizações


Recomendados
Recomendados
Mais conteúdo relacionado
Mais de Congressional Budget Office
Mais de Congressional Budget Office (20)
Último
Último (20)
CBO's 2012 Long-Term Projections for Social Security
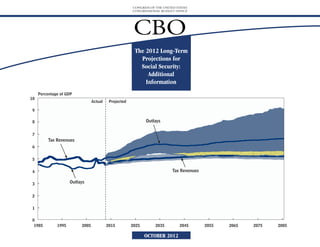
- 1. CONGRESS OF THE UNITED STATES CONGRESSIONAL BUDGET OFFICE CBO The 2012 Long-Term Projections for Social Security: Additional Information Percentage of GDP 10 Actual Projected 9 8 Outlays 7 Tax Revenues 6 5 4 Tax Revenues 3 Outlays 2 1 0 1985 1995 2005 2015 2025 2035 2045 2055 2065 2075 2085 OCTOBER 2012
- 2. Notes and Definitions Unless otherwise noted, all years referred to are calendar years. Numbers in the text and tables may not add up to totals because of rounding. Supplemental data are posted on CBO’s Web site (www.cbo.gov). For 2011 and 2012, the Social Security payroll tax on employees was reduced by 2 percentage points; the reduction in Social Security tax revenues is being made up by reimbursements from the Treasury’s general fund. In this report, Social Security tax revenues include those reimbursements. 80 percent range of uncertainty: A range of uncertainty based on a distribution of 500 simulations from CBO’s long-term model. Outcomes were above the range in 10 percent of the simulations, below the range in 10 percent, and within the range in 80 percent. Median: The middle of the distribution. When the median outcome for a group of people (defined in this document by birth cohort and lifetime earnings category) is shown, the value is lower for half of the people in that group and higher for half of the group. Present value: A single number that expresses a flow of current and future income or payments in terms of an equivalent lump sum received or paid today. Cost rate: The present value of outlays for a period, plus the present value of a year’s worth of benefits as a reserve at the end of the period, divided by the present value of the stream of gross domestic product or taxable payroll over the same period. Income rate: The present value of tax revenues for a period, plus the trust funds’ initial balance, divided by the present value of the stream of gross domestic product or taxable payroll over the same period. Actuarial balance: The difference between the income rate and the cost rate. Scheduled benefits: Full benefits as calculated under current law, regardless of the amounts available in the Social Security trust funds. Payable benefits: Benefits as calculated under current law, reduced as necessary to make outlays equal the Social Security system’s revenues. Upon exhaustion of the Social Security trust funds, the Social Security Administration would reduce all scheduled benefits such that outlays from the funds would equal revenues flowing into the funds. Replacement rate: Annual benefits as a percentage of annual lifetime earnings. CBO Pub. No. 4520
- 3. List of Exhibits Exhibit Page System Finances 1. Social Security Tax Revenues and Outlays, with Scheduled Benefits (Figure) 6 2. Social Security Tax Revenues and Outlays, with Scheduled Benefits (Table) 7 3. Percentage of Simulations in Which Social Security Outlays Exceed Tax Revenues by Specified Percentages, with Scheduled Benefits 8 4. Social Security Tax Revenues and Outlays, with Scheduled and Payable Benefits 9 5. Summarized Financial Measures for Social Security Under the Extended Baseline Scenario, with Scheduled Benefits 10 6. Summarized Financial Measures for Social Security Under the Extended Alternative Fiscal Scenario, with Scheduled Benefits 11 7. Trust Fund Ratio, with Scheduled Benefits 12 8. Percentage of Simulations That Show the Social Security Trust Funds Exhausted by a Particular Year 13 Distribution of Benefits 9. Median Initial Benefits for Retired Workers, with Scheduled and Payable Benefits 15 10. Median Initial Replacement Rates for Retired Workers, with Scheduled and Payable Benefits 16 11. Median Present Value of Lifetime Benefits for Retired Workers, with Scheduled and Payable Benefits 17 12. Median Benefits and Initial Replacement Rates for Disabled Workers, with Scheduled and Payable Benefits 18 13. Lifetime Social Security Payroll Taxes 19 14. Lifetime Social Security Benefits, with Scheduled and Payable Benefits 20 15. Lifetime Social Security Benefit-to-Tax Ratios, with Scheduled and Payable Benefits 21 CBO 16. Percentage of Simulations in Which Payable Benefits Exceed Specified Percentages of Scheduled Benefits 22
- 4. The 2012 Long-Term Projections for Social Security: Additional Information Social Security is the federal government’s largest and their employers at 6.2 percent apiece (except interest that is credited on previous balances, single program.1 Of the 56 million people who for self-employed workers, who pay the entire minus spending for benefits and administrative currently receive Social Security benefits, about 12.4 percent tax on earnings themselves).2 The costs, constitutes that fund’s surplus or deficit. 70 percent are retired workers or their spouses and payroll tax applies only to taxable earnings— children, and another 11 percent are survivors of earnings up to a maximum annual amount In calendar year 2010, for the first time since the deceased workers; all of those beneficiaries receive ($110,100 in 2012). Some Social Security benefits enactment of the Social Security Amendments of payments through Old-Age and Survivors Insur- also are subject to taxation: In recent years, an aver- 1983, annual outlays for the program exceeded ance (OASI). The other 19 percent of beneficiaries age of 3 percent of Social Security’s tax revenues annual tax revenues (that is, outlays exceeded total are disabled workers or their spouses and children; has come from the income taxes that higher- revenues excluding interest credited to the trust they receive Disability Insurance (DI) benefits. income beneficiaries pay on their benefits. Tax funds). In 2011, outlays exceeded tax revenues by The Congressional Budget Office (CBO) esti- revenues credited to the program totaled 4 percent, and CBO projects that the gap will aver- mates that in fiscal year 2012, Social Security’s $726 billion in fiscal year 2012, CBO estimates. age about 10 percent of tax revenues over the next outlays totaled $773 billion, one-fifth of federal decade. As more members of the baby-boom spending; OASI payments accounted for about Revenues from taxes, along with intragovern- generation enter retirement, outlays will increase 82 percent of those outlays, and DI payments mental interest payments, are credited to Social relative to the size of the economy, whereas tax rev- made up about 18 percent. Security’s two trust funds—one for OASI and one enues will remain at an almost constant share of for DI—and the program’s benefits and adminis- the economy. As a result, the gap will grow larger Social Security has two primary sources of tax reve- trative costs are paid from those funds. Although in the 2020s and will exceed 20 percent of revenues nues: payroll taxes and income taxes on benefits. legally separate, the funds often are described col- by 2030. Over the past decade, an average of 97 percent of lectively as the OASDI trust funds. In a given year, tax revenues dedicated to Social Security was col- the sum of receipts to a fund along with the CBO projects that under current law, the DI trust lected from a payroll tax of 12.4 percent levied fund will be exhausted in fiscal year 2016 and on earnings and split evenly between workers the OASI trust fund will be exhausted in 2038.3 2. The worker’s portion of the payroll tax was reduced by If a trust fund’s balance falls to zero and current 2 percentage points for 2011 and 2012 (as was the tax 1. For a description, see Congressional Budget Office, on the self-employed), and the reduction in tax revenues Social Security Policy Options (July 2010), “An Overview of is being made up by reimbursements from the U.S. 3. In Congressional Budget Office, The 2012 Long-Term Social Security,” pp. 1–4. Social Security’s financing and Treasury’s general fund. In this report, Social Security tax Budget Outlook (June 2012), Chapter 4, that date was trust funds are discussed on pp. 3–5 of that study. revenues include those reimbursements. originally incorrectly reported as 2037. CBO
- 5. INTRODUCTION THE 2012 LONG-TERM PROJECTIONS FOR SOCIAL SECURITY: ADDITIONAL INFORMATION 2 revenues are insufficient to cover the benefits that projections, which were made on the basis of two are called scheduled benefits. However, the Social are specified in law, the Social Security Administra- scenarios: The first, CBO’s extended baseline sce- Security Administration has no legal authority to tion does not have legal authority to pay full nario, adheres closely to current law. For example, pay scheduled benefits when they are due if their benefits when they are due. In 1994, legislation that scenario reflects the assumption that the cuts amounts exceed the balances in the trust funds. redirected revenues from the OASI trust fund to in individual income taxes enacted since 2001 and Therefore, if the trust funds became exhausted, it prevent the imminent exhaustion of the DI trust most recently extended in 2010 will expire as appears that payments to current and new benefi- fund. In part because of that experience, it is a scheduled in 2012 and 2013. CBO also has devel- ciaries would need to be reduced to make the common analytical convention to consider the DI oped an extended alternative fiscal scenario, which outlays from the funds equal the revenues flowing and OASI trust funds as combined. Thus, CBO incorporates the assumptions that certain policies into the funds.6 Benefits thus reduced are called projects, if some future legislation shifted resources that have been in place for a number of years will payable benefits. In such a case, all receipts to the from the OASI trust fund to the DI trust fund, the be continued and that some provisions of law that trust funds would be used, and the trust fund combined OASDI trust funds would be exhausted might be difficult to sustain for a long period will balances would remain essentially at zero. When in 2034. be modified. Unless otherwise noted, the projec- presenting projections of Social Security’s finances, tions presented in the current analysis are based on CBO generally focuses on scheduled benefits The amount of Social Security taxes paid by vari- the assumptions of the extended baseline scenario. because, by definition, the system would be fully ous groups of people differs, as do the benefits that In that scenario, income taxes, including the financed if payable benefits were all that was different groups receive. For example, people with income taxes on Social Security benefits that are disbursed. higher earnings pay more in Social Security payroll credited to the trust funds, are higher than they are taxes than do lower-earning participants, and they in the extended alternative fiscal scenario.5 also receive benefits that are larger (although not proportionately so). Because Social Security’s bene- Scheduled and Payable Benefits 5. In this report, as in most of its publications, CBO fit formula is progressive, replacement rates— CBO prepares two types of benefit projections. makes budgetary projections under the assumption that annual benefits as a percentage of average annual economic conditions would be the same under both Benefits as calculated under the Social Security lifetime earnings—are lower, on average, for work- scenarios. In fact, alternative policies would lead to Act, regardless of the balances in the trust funds, ers who have had higher earnings. As another economic outcomes that are significantly different from example, the amount of taxes paid and benefits those resulting from the policies embodied in current law. For discussion of the economic effects of different policies, received will be greater for people in later birth 4. See Congressional Budget Office, The 2012 Long-Term see Congressional Budget Office, An Update to the Budget cohorts because they typically will have higher Budget Outlook. Some of the 75-year projections in that and Economic Outlook: Fiscal Years 2012 to 2022 (August earnings over a lifetime, even after an adjustment volume extended through fiscal year 2087 because CBO 2012), Chapter 2; and The 2012 Long-Term Budget generally considers the projection period to begin in the for inflation, CBO projects. next fiscal year (in this case, fiscal year 2013). In this Outlook, Chapter 2. report and in Chapter 4 (“Social Security”) of The 2012 6. See Christine Scott, Social Security: What Would Happen If About This Analysis Long-Term Budget Outlook, the 75-year projection period the Trust Funds Ran Out? Report for Congress RL33514 Each year, CBO prepares long-term projections of consists of calendar years 2012 through 2086, matching (Congressional Research Service, August 2009), the period used in Social Security Administration, The http://go.usa.gov/YYs5. As explained in that report, it is revenues and outlays for the Social Security pro- 2012 Annual Report of the Board of Trustees of the Federal unclear how payments would be reduced. In its analysis, gram. The most recent set of 75-year projections Old-Age and Survivors Insurance and Federal Disability CBO assumes that each year after the trust funds became was published in June 2012.4 This publication Insurance Trust Funds (April 2012), http://go.usa.gov/ exhausted, each individual’s annual benefit would be presents additional information about those rKhw. reduced by the same percentage. CBO
- 6. INTRODUCTION THE 2012 LONG-TERM PROJECTIONS FOR SOCIAL SECURITY: ADDITIONAL INFORMATION 3 Quantifying Uncertainty scenario (see Exhibit 5), and from 2.00 percent to rate and the cost rate are both slightly higher than To quantify the uncertainty in its Social Security 2.40 percent of taxable payroll under the extended they were in last year’s report. The projections for projections, CBO, using its long-term model, alternative fiscal scenario (see Exhibit 6). growth in health care costs are lower, so a larger created a distribution of outcomes from 500 simu- share of compensation is projected to be paid as When measured as a share of taxable payroll, long- taxable earnings, rather than nontaxable health lations. In those simulations, the assumed values term tax revenues are slightly lower than those benefits.10 Therefore, Social Security’s taxable pay- for most of the key demographic and economic projected in 2011, but long-term outlays are roll is a larger share of GDP in this year’s report, factors that underlie the analysis—for example, higher. Compared with last year’s projections, the increasing both the income rate and cost rate as fertility and mortality rates, interest rates, and the 75-year income rate—a measure of Social Secu- shares of GDP. The 75-year imbalance is greater as rate of growth of productivity—were varied on rity’s tax revenues—is 0.6 percent lower under the a share of GDP for the same reasons that it is the basis of historical patterns of variation.7 Several extended baseline scenario and 0.7 percent lower greater as a share of taxable payroll. Under the exhibits in this publication show the simulations’ under the extended alternative fiscal scenario, in extended baseline scenario, the imbalance rose 80 percent range of uncertainty: That is, in both cases because revenues from income taxes on from 0.58 percent of GDP to 0.73 percent; under 80 percent of the 500 simulations, the value in benefits are projected to be lower. The 75-year cost the extended alternative fiscal scenario, it rose from question fell within the range shown; in 10 percent rate—a measure of outlays—is 2.0 percent higher 0.74 percent to 0.90 percent. of the simulations, the value was above that under both scenarios. Outlays are a significantly range; and in 10 percent, it was below. Long-term higher share of taxable payroll during the coming Related CBO Analyses projections are necessarily uncertain, and that decade—on average, 5 percent higher from 2012 uncertainty is illustrated in this publication; never- Further information about Social Security and through 2019—because of projected near-term theless, the general conclusions of this analysis are CBO’s projections is available in other CBO economic weakness. Relative to last year’s analysis, unchanged under a variety of assumptions. publications: projections of outlays are similar for the 25 years beginning in 2020 but around 2 percent higher in B Various approaches to changing the program Changes in CBO’s Long-Term Social later years, primarily because of greater assumed Security Projections Since 2011 are presented in Social Security Policy Options longevity.9 (July 2010) and in Policy Options for the The shortfalls for Social Security that CBO is cur- Social Security Disability Insurance Program rently projecting are larger than those the agency When measured as a share of gross domestic prod- (July 2012). projected a year ago.8 The 75-year imbalance has uct (GDP), however, the projections of the income increased from 1.58 percent to 1.95 percent of B The current long-term projections are consis- taxable payroll under the extended baseline tent with the 10-year baseline CBO published 9. CBO’s 2011 Social Security projections incorporated demographic projections from the Social Security trustees’ in Updated Budget Projections: Fiscal Years 2012 7. For more information, see Congressional Budget Office, to 2022 (March 2012). (Data in that report and 2010 report; the current study uses the projections in the Quantifying Uncertainty in the Analysis of Long-Term Social 2011 report, which, on the basis of more recent data, pre- in The 2012 Long-Term Budget Outlook (June Security Projections, Background Paper (November 2005). dicts greater longevity. See Social Security Administration, 2012) generally are presented for fiscal years; The methodology used in this report differs slightly from The 2011 Annual Report of the Board of Trustees of the techniques described in that earlier publication. the Federal Old-Age and Survivors Insurance and Federal 8. See Congressional Budget Office, CBO’s 2011 Long-Term Disability Insurance Trust Funds (May 2011), 10. See Congressional Budget Office, The 2012 Long-Term Projections for Social Security: Additional Information. http://go.usa.gov/rkW5. Budget Outlook, p. 92. CBO
- 7. INTRODUCTION THE 2012 LONG-TERM PROJECTIONS FOR SOCIAL SECURITY: ADDITIONAL INFORMATION 4 this analysis, Social Security Policy Options, and B The methodology used to develop the projec- Security trustees, except for the assumptions Policy Options for the Social Security Disability tions in this publication is described in CBO’s about immigration, which are CBO’s.)11 Insurance Program use calendar year data.) Long-Term Model: An Overview (Background Paper, June 2009). B A graphic treatment of background information B The estimates of revenues and outlays for is presented in “CBO’s 2011 Long-Term fiscal year 2012 are from CBO’s current base- B The data underlying the figures in this report Projections for Social Security” (infographic, line, published in An Update to the Budget and and expanded versions of some of the tables are August 2011), which includes a summary of Economic Outlook: Fiscal Years 2012 to 2022 available as supplemental material on CBO’s some of the agency’s 2011 projections. (August 2012). Web site. B Numerous other aspects of the program are B The current projections update those published B The values used for the demographic and addressed in various publications available on in CBO’s 2011 Long-Term Projections for Social economic variables underlying the projections, the “Retirement” page of CBO’s Web site, Security: Additional Information (August 2011). are explained in a section, “CBO’s Long-Term www.cbo.gov. Differences in the two sets of projections result Economic Benchmark,” in Chapter 2 of from newly available programmatic and eco- The 2012 Long-Term Budget Outlook (p. 31). 11. See Social Security Administration, The 2011 Annual nomic data, updated assumptions about future (The projections are based on the demographic Report of the Board of Trustees of the Federal Old-Age and economic trends, and improvements in models. assumptions of the 2011 report of the Social Survivors Insurance and Federal Disability Insurance Trust Funds (May 2011), http://go.usa.gov/rkW5. CBO
- 8. System Finances The first part of this publication (Exhibits 1 through 8) examines Social Security’s financial status from several vantage points. The fullest perspective is provided by projected streams of annual revenues and outlays. A more succinct analysis is given by measures that summarize the annual streams in a single number. The system’s finances also are described by projecting what is called the trust fund ratio, the amount in the trust funds at the beginning of a year in proportion to the outlays in that year.
- 9. SYSTEM FINANCES THE 2012 LONG-TERM PROJECTIONS FOR SOCIAL SECURITY: ADDITIONAL INFORMATION 6 Exhibit 1. In 2011, Social Security’s total outlays (benefits Social Security Tax Revenues and Outlays, with Scheduled Benefits plus administrative costs) equaled 4.9 percent of the country’s gross domestic product; tax revenues (Percentage of gross domestic product) dedicated to the program equaled 4.7 percent of 10 GDP. Most of Social Security’s tax revenues come Actual Projected from payroll taxes, although a small portion comes 9 from income taxes on benefits paid to higher- Outlaysb income beneficiaries. In addition to those tax 8 revenues, the trust funds are credited with interest. 7 Tax Revenuesa During the next few decades, the number of benefi- 6 ciaries will increase as the baby-boom generation ages. In 2036, scheduled spending will be 5 6.2 percent of GDP, CBO estimates. Over the ensuing decade, spending will decline slightly, rela- 4 tive to the size of the economy, as people in the Tax Revenuesa 3 b baby-boom generation die. Demographers gener- Outlays ally predict that life expectancy will continue to rise 2 and that birth rates will remain as they are now, so scheduled outlays are projected to resume their 1 upward trajectory around 2050, reaching 0 6.6 percent of GDP in 2086. 1985 1995 2005 2015 2025 2035 2045 2055 2065 2075 2085 The amount of tax revenues credited to the trust Source: Congressional Budget Office. funds is projected to decline from 4.7 percent of Note: The lines indicate CBO’s projections of expected outcomes. The shaded areas indicate the 80 percent GDP this year to 4.5 percent in 2013 as wages and range of uncertainty. other earnings decline as a share of the economy. a. Includes payroll taxes and income taxes on benefits. Tax revenues are projected to return to 4.7 percent of GDP by 2015 as the economy recovers and then b. Includes scheduled benefits and administrative costs. to rise slightly before stabilizing at about 5.2 per- cent in 2050. Two factors are important in creating that pattern. First, although people’s total compen- sation will be nearly constant as a percentage of GDP in the long run, CBO projects, the share of compensation that workers receive as wages will rise from 81 percent in 2021 to 84 percent in about 2050 as the excise tax on high-premium health insurance plans causes some employers and workers to shift to less expensive plans. Subsequently, as the cost of health care continues to rise, the share of compensation received as wages will fall, returning CBO (Continued)
- 10. SYSTEM FINANCES THE 2012 LONG-TERM PROJECTIONS FOR SOCIAL SECURITY: ADDITIONAL INFORMATION 7 Exhibit 2. (Continued) Social Security Tax Revenues and Outlays, with Scheduled Benefits to about its 2021 level by 2086. Second, when (Percentage of gross domestic product) earnings inequality increases (and the distribution Actual Projected of earnings widens), as it has in recent decades, the 2011 2036 2061 2086 taxable share of earnings declines because more earnings are above the maximum amount that is Tax Revenues 4.69 5.06 5.26 5.19 taxed for Social Security. CBO projects that earn- Outlays 4.87 6.19 6.37 6.63 ings inequality will increase somewhat during the Difference -0.19 -1.13 -1.11 -1.45 next few decades and that the share of earnings sub- 80 Percent Range of Uncertainty for CBO's Projections ject to the payroll tax, which has averaged around Tax Revenues 4.9 to 5.3 5.0 to 5.6 5.0 to 5.6 85 percent in recent years, will decline to around 83 percent in 2036. Outlays 5.5 to 7.3 5.1 to 8.1 5.3 to 9.1 Differencea -2.0 to -0.5 -2.7 to 0.0 -3.6 to -0.3 The uncertainty in CBO’s projections is illustrated by the range of outcomes from a series of 500 simu- Source: Congressional Budget Office. lations in which most of the key demographic and Note: Tax revenues consist of payroll taxes and income taxes on benefits that are credited to the Social Security economic factors that underlie the analysis have trust funds in the specified year. Outlays consist of scheduled benefits and administrative costs; scheduled been varied on the basis of historical patterns. benefits are benefits as calculated under the Social Security Act, regardless of the balances in the trust Although CBO projects that Social Security’s out- funds. lays will equal 6.2 percent of GDP in 2036, in 10 percent of the simulations, outlays in 2036 are a. The differences displayed generally do not equal the difference between the outlays and revenues shown below 5.5 percent of GDP, and in 10 percent, they because the low and high values of the ranges (for tax revenues, outlays, and the difference) are drawn from exceed 7.3 percent of GDP. In most simulations, different simulations. outlays in 2036 account for a much larger share of GDP than the 5.0 percent estimated for 2012. CBO
- 11. SYSTEM FINANCES THE 2012 LONG-TERM PROJECTIONS FOR SOCIAL SECURITY: ADDITIONAL INFORMATION 8 Exhibit 3. Another perspective on the uncertainty in projec- Percentage of Simulations in Which Social Security Outlays Exceed tions of Social Security’s finances involves the percentage of CBO’s simulations in which total Tax Revenues by Specified Percentages, with Scheduled Benefits outlays exceed tax revenues by a given amount in a (Percent) particular year. In the 500 simulations, most of the key demographic and economic factors that By 0 Percent of By 1 Percent of By 2 Percent of By 3 Percent of By 4 Percent of By 5 Percent of underlie the analysis vary on the basis of historical GDP or More GDP or More GDP or More GDP or More GDP or More GDP or More patterns. In almost every case, outlays equal or 2020 94 7 0 0 0 0 exceed tax revenues in 2030. Outlays are at least 2030 100 59 5 0 0 0 1 percentage point greater than tax revenues (when 2040 97 57 9 0 0 0 both are measured as shares of GDP) in 59 percent 2050 92 48 11 1 0 0 of simulations for that year and at least 2 percent- 2060 90 57 21 6 1 0 age points greater in 5 percent of the simulations. 2070 92 62 27 10 3 0 In later decades, projections of outlays are less cer- 2080 94 68 37 14 6 2 tain. As a result, the percentage of simulations in which outlays equal or exceed tax revenues declines Source: Congressional Budget Office. after 2030 but remains at or above 90 percent. Notes: Tax revenues consist of payroll taxes and income taxes on benefits that are credited to the Social Security The increase in uncertainty about outlays also trust funds in the specified year. Outlays consist of scheduled benefits and administrative costs; scheduled causes a rise in the portion of simulations in which benefits are benefits as calculated under the Social Security Act, regardless of the balances in the trust outlays exceed tax revenues (as shares of GDP) by funds. This analysis is based on 500 simulations from CBO’s long-term model. at least 2 percentage points; that portion reaches 37 percent by 2080. GDP = gross domestic product. CBO
- 12. SYSTEM FINANCES THE 2012 LONG-TERM PROJECTIONS FOR SOCIAL SECURITY: ADDITIONAL INFORMATION 9 Exhibit 4. The projected gap between outlays and revenues Social Security Tax Revenues and Outlays, with ultimately will eliminate the balance in the trust funds, and it appears that it would then be impossi- Scheduled and Payable Benefits ble, under current law, to pay the full amount of (Percentage of gross domestic product) scheduled benefits when due. Payable benefits will equal scheduled benefits until the trust funds are 7 exhausted; after that, they will equal the Social Actual Projected Security program’s annual revenues. CBO projects 6 Outlays with Scheduled Benefitsb that the trust funds will be exhausted in 2034. In the following year, revenues are projected to 5 equal 81 percent of scheduled outlays. Thus, Tax Revenuesa Outlays with Payable Benefitsb payable benefits will be 19 percent lower than 4 scheduled benefits. The gap between scheduled and Outlaysb payable benefits will shrink slightly for the follow- 3 ing decade, falling to 16 percent in 2050. It will then widen, and by 2086, payable benefits will be 2 24 percent smaller than scheduled benefits. 1 0 1985 1995 2005 2015 2025 2035 2045 2055 2065 2075 2085 Source: Congressional Budget Office. a. Includes payroll taxes and income taxes on benefits. Tax revenues shown are consistent with payable benefits and would decline slightly if the trust funds became exhausted because revenues from income taxes paid on benefits would decline. b. Includes benefits and administrative costs. CBO
- 13. SYSTEM FINANCES THE 2012 LONG-TERM PROJECTIONS FOR SOCIAL SECURITY: ADDITIONAL INFORMATION 10 Exhibit 5. To present the results of long-term projections suc- Summarized Financial Measures for Social Security Under the cinctly, analysts often summarize scheduled outlays and revenues as a single number that covers a given Extended Baseline Scenario, with Scheduled Benefits period (for example, total outlays over 75 years). The data are summarized by computing the present As a Percentage of GDP As a Percentage of Taxable Payroll value of outlays or tax revenues for a period and Income Cost Actuarial Income Cost Actuarial dividing that figure by the present value of the Rate Rate Balance Rate Rate Balance stream for GDP or taxable payroll over the same CBO's Projections period. (Present value is a single number that 25 Years (2012–2036) 5.56 5.84 -0.28 15.01 15.75 -0.75 expresses a flow of current and future income, or 50 Years (2012–2061) 5.40 5.96 -0.56 14.38 15.87 -1.49 payments, in terms of an equivalent lump sum 75 Years (2012–2086) 5.35 6.08 -0.73 14.26 16.21 -1.95 received or paid today. That computation uses the interest rate used to compute interest credited to 80 Percent Range of Uncertainty for CBO's Projectionsa the trust funds.) The income rate is the present 25 Years (2012–2036) 5.4 to 5.8 5.4 to 6.3 -0.7 to 0.0 14.7 to 15.2 14.8 to 16.9 -1.8 to 0.1 value of annual noninterest revenues (including the 50 Years (2012–2061) 5.2 to 5.6 5.5 to 6.6 -1.0 to -0.2 14.2 to 14.6 14.8 to 17.3 -2.8 to -0.5 initial trust fund balance), and the cost rate is the 75 Years (2012–2086) 5.2 to 5.6 5.6 to 6.8 -1.3 to -0.4 14.0 to 14.5 15.0 to 17.9 -3.5 to -0.9 present value of annual outlays (including a target trust fund balance at the end of the period, which is Source: Congressional Budget Office. traditionally the following year’s projected outlays), each divided by the present value of GDP or tax- Notes: Over the relevant periods, the income rate is the present value of annual tax revenues (plus the initial trust able payroll. The actuarial balance is the difference fund balance), and the cost rate is the present value of annual outlays (plus the present value of a year’s between the income and cost rates. worth of benefits as a reserve at the end of the period), each divided by the present value of GDP or taxable payroll. The actuarial balance is the difference between the income and cost rates. This analysis focuses on CBO’s extended baseline GDP = gross domestic product. scenario, which adheres closely to current law. In that scenario, federal income taxes on benefits a. The balances displayed generally do not equal the difference between the outlays and revenues shown would increase over time, and the estimated 75- because the low and high values of the ranges (for the income rate, the cost rate, and the actuarial balance) year actuarial balance would be -0.73 percent of are drawn from different simulations. GDP or -1.95 percent of taxable payroll. That means, for example, that if the Social Security payroll tax rate was increased immediately and per- manently by 1.95 percentage points—from the current rate of 12.40 percent to 14.35 percent—or if scheduled benefits were reduced by an equivalent amount, then the trust funds’ projected balance at the end of 2086 would equal projected outlays for 2087. CBO
- 14. SYSTEM FINANCES THE 2012 LONG-TERM PROJECTIONS FOR SOCIAL SECURITY: ADDITIONAL INFORMATION 11 Exhibit 6. This publication focuses mostly on CBO’s Summarized Financial Measures for Social Security Under the extended baseline scenario, which adheres closely to current law. CBO also has made long-term budget Extended Alternative Fiscal Scenario, with Scheduled Benefits projections using an alternative fiscal scenario that incorporates the assumptions that certain policies As a Percentage of GDP As a Percentage of Taxable Payroll that have been in place for a number of years will Income Cost Actuarial Income Cost Actuarial be continued and that some provisions of law that Rate Rate Balance Rate Rate Balance might be difficult to sustain for a long period will CBO's Projections be modified. (Details of the two scenarios are out- 25 Years (2012–2036) 5.50 5.84 -0.34 14.84 15.75 -0.91 lined in Table 1-1 of The 2012 Long-Term Budget 50 Years (2012–2061) 5.27 5.96 -0.68 14.05 15.87 -1.82 Outlook.) 75 Years (2012–2086) 5.18 6.08 -0.90 13.81 16.21 -2.40 The financial outlook for Social Security is 80 Percent Range of Uncertainty for CBO's Projectionsa less favorable under that scenario than it is under 25 Years (2012–2036) 5.3 to 5.7 5.4 to 6.3 -0.7 to 0.0 14.6 to 15.1 14.8 to 16.9 -2.0 to -0.1 the extended baseline scenario (shown in 50 Years (2012–2061) 5.1 to 5.5 5.5 to 6.6 -1.2 to -0.3 13.8 to 14.3 14.8 to 17.3 -3.1 to -0.9 Exhibit 5). Income taxes paid on benefits are 75 Years (2012–2086) 5.0 to 5.4 5.6 to 6.8 -1.5 to -0.5 13.6 to 14.0 15.0 to 17.9 -4.0 to -1.4 assumed to be lower under the alternative fiscal sce- nario, resulting in lower revenues from the taxation Source: Congressional Budget Office. of Social Security benefits and therefore a lower Notes: Over the relevant periods, the income rate is the present value of annual tax revenues (plus the initial trust Social Security income rate. Under the alternative fund balance), and the cost rate is the present value of annual outlays (plus the present value of a year’s fiscal scenario, the 75-year income rate is 5.18 per- worth of benefits as a reserve at the end of the period), each divided by the present value of GDP or cent of GDP, compared with a rate of 5.35 percent taxable payroll. The actuarial balance is the difference between the income and cost rates. under the extended baseline scenario. The cost rate is the same as under the extended baseline scenario. GDP = gross domestic product. As a result, the 75-year actuarial deficit is larger: a. The balances displayed generally do not equal the difference between the outlays and revenues shown 0.90 percent of GDP or 2.40 percent of taxable because the low and high values of the ranges (for the income rate, the cost rate, and the actuarial balance) payroll under the alternative fiscal scenario, com- are drawn from different simulations. pared with a deficit of 0.73 percent of GDP or 1.95 percent of taxable payroll under the extended baseline scenario. CBO
- 15. SYSTEM FINANCES THE 2012 LONG-TERM PROJECTIONS FOR SOCIAL SECURITY: ADDITIONAL INFORMATION 12 Exhibit 7. The trust fund ratio—the balance in the Social Trust Fund Ratio, with Scheduled Benefits Security trust funds at the beginning of the year divided by the system’s projected outlays for that 10 year—indicates the proportion of a year’s cost that Actual Projected could be paid with the funds available. The trust fund ratio for 2011 was 3.5, and CBO projects that 5 it will fall to 3.4 this year. The rate of decline will accelerate in subsequent decades, and the ratio 0 will reach zero in 2034, CBO projects. At that point, payments to current and new beneficiaries -5 would need to be reduced to make the outlays and revenues equal. -10 The year in which the trust funds are exhausted could differ significantly from CBO’s projection, -15 however. In CBO’s simulations, in which most of the key demographic and economic factors in the analysis were varied on the basis of historical pat- -20 terns, the trust funds are exhausted in 2029 or earlier 10 percent of the time and in 2045 or later -25 10 percent of the time, (The shaded area in the fig- 1985 1995 2005 2015 2025 2035 2045 2055 2065 2075 2085 ure shows the 80 percent range of uncertainty. The Source: Congressional Budget Office. intersection between the shaded area and the hori- zontal line at zero, spanning the years between Note: The trust fund ratio is the ratio of the trust fund balance (the amount in the trust funds) at the beginning 2029 and 2045, corresponds to the 80 percent of a year to outlays in that year. Outlays consist of benefits and administrative costs. The trust funds are range of uncertainty about the year in which the exhausted when the trust fund ratio reaches zero. Under current law, the trust funds cannot incur negative trust funds will become exhausted.) The negative balances. The negative balances shown in this exhibit indicate a projected shortfall, reflecting the trust balances represent CBO’s estimates of the cumula- funds’ inability to pay scheduled benefits out of current-law revenues. The dark line indicates CBO’s projec- tive amount of scheduled benefits that cannot be tion of expected outcomes; the shaded area indicates the 80 percent range of uncertainty around the pro- paid from the program’s current-law revenues jection. (expressed as a ratio to outlays in each year). CBO
- 16. SYSTEM FINANCES THE 2012 LONG-TERM PROJECTIONS FOR SOCIAL SECURITY: ADDITIONAL INFORMATION 13 Exhibit 8. An alternative way to consider uncertainty is to Percentage of Simulations That Show the Social Security examine the percentage of simulations in which the trust funds are exhausted by a specific year. In those Trust Funds Exhausted by a Particular Year simulations, most of the key demographic and eco- nomic factors that underlie the analysis were varied 100 on the basis of historical patterns. In 19 percent of 90 CBO’s simulations, the funds are exhausted by 2030. In 81 percent of the simulations, the trust 80 funds are exhausted by 2040. 70 60 50 40 30 20 10 0 2012 2018 2024 2030 2036 2042 2048 2054 2060 2066 2072 2078 2084 Source: Congressional Budget Office. Note: The data are based on 500 simulations from CBO’s long-term model. CBO
- 17. Distribution of Benefits In the second part of this publication (Exhibits 9 through 16), CBO examines the program’s effects on people by grouping Social Security participants according to various characteristics and presenting the average taxes and benefits for those groups. In its analysis, CBO divided people into groups by the decade in which they were born and by the quintile of their lifetime household earnings.1 For example, one 10-year cohort consists of people born in the 1940s, and the highest earnings quintile consists of the top fifth of earners. CBO’s modeling approach produces estimates for individuals; household status is used only to place people into earnings groups. In this part of the analysis, benefits are calculated net of income taxes paid on benefits by higher-income recipients and credited to the Social Security trust funds.2 Median values are estimated for each group: Estimates for half of the people in the group are lower, and estimates for half are higher. Most retired and disabled workers receive Social Security benefits on the basis of their own work history. This publication first presents measures of those benefits that do not include benefits received by dependents or survivors who are entitled to them on the basis of another person’s work history. Then, for a more comprehensive perspective on the distribution of Social Security benefits, this analysis presents measures of the total amount of Social Security payroll taxes that each participant pays over his or her lifetime as well as the total Social Security benefits—including payments received as a worker’s dependent or as a survivor—that each receives over a lifetime. 1. Each person who lives at least to age 45 is ranked by lifetime household earnings. Lifetime earnings for someone who is single in all years equal the present value of his or her real (inflation-adjusted) earnings over a lifetime. In any year that a person is married, the earnings measure is a function of his or her earnings plus those of his or her spouse (adjusted for economies of scale in household consumption). A person’s lifetime earnings consist of the present value of those annual amounts. To compute present values in Social Security analyses, CBO uses a real discount rate of 3.0 percent, which equals the long-term rate used to compute interest for the Social Security trust funds. 2. In this part of the analysis, benefits are not reduced by the portion of those income taxes that is credited to Medicare’s Hospital Insurance Trust Fund.
- 18. DISTRIBUTION OF BENEFITS THE 2012 LONG-TERM PROJECTIONS FOR SOCIAL SECURITY: ADDITIONAL INFORMATION 15 Exhibit 9. Future retired workers are projected to receive Median Initial Benefits for Retired Workers, with higher initial annual Social Security benefits than today’s beneficiaries receive—whether those bene- Scheduled and Payable Benefits fits are scheduled or payable (net of income taxes (Thousands of 2012 dollars) paid on the benefits and adjusted for the effects of inflation). Lowest Quintile of Middle Quintile of Highest Quintile of 10-Year Lifetime Household Lifetime Household Lifetime Household CBO considered a hypothetical benefit amount: Birth All Retired Workers Earnings Earnings Earnings the median initial benefit among workers if every- Cohort Scheduled Payable Scheduled Payable Scheduled Payable Scheduled Payable one claimed benefits at age 65, based on earnings All through age 61. The median initial scheduled ben- 1940s 16 16 9 9 18 18 23 23 efit rises over time because of growth in average 1960s 18 18 11 11 20 20 29 29 earnings. However, the effect of growing earnings 1980s 22 19 14 12 24 20 37 32 will be partly offset for several cohorts by the sched- 2000s 30 23 18 15 32 26 50 40 uled rise in the full retirement age, from 65 for people born before 1938 to 67 for those born after Men 1959. The effect is equivalent to a reduction in 1940s 20 20 10 10 21 21 25 25 benefits at any age at which benefits are claimed. 1960s 21 21 11 11 22 22 31 31 Once the older retirement age is in place, the 1980s 25 21 15 13 26 23 39 34 median initial benefit will grow at about the same 2000s 33 27 20 16 35 28 53 42 rate as median earnings. Women When the trust funds are exhausted, payable bene- 1940s 13 13 8 8 13 13 18 18 fits will fall, but then they will rise again as earnings 1960s 15 15 10 10 17 17 25 25 (and therefore tax revenues) grow. Although pay- 1980s 19 16 13 11 21 18 33 28 able initial benefits are lower than scheduled initial 2000s 26 21 17 14 29 23 45 35 benefits for people born in 1970 and later, they will be higher than current initial benefits, CBO projects. Source: Congressional Budget Office. Note: Initial annual benefits are computed for all individuals who are eligible to claim retirement benefits at Projected benefits are lower for women than for age 62 and who have not yet claimed any other benefit. All workers are assumed to claim benefits at men in all cohorts (because women have lower age 65. All values are net of income taxes paid on benefits and credited to the Social Security trust funds. average earnings) although the gap narrows (as a share of men’s benefits) for later cohorts as men’s and women’s earnings become more equal. For the 1940s cohort, projected initial benefits for women are about 35 percent below those for men, but for the 1980s cohort and later groups, they are about 20 percent below those for men. CBO
- 19. DISTRIBUTION OF BENEFITS THE 2012 LONG-TERM PROJECTIONS FOR SOCIAL SECURITY: ADDITIONAL INFORMATION 16 Exhibit 10. Initial replacement rates—initial annual benefits Median Initial Replacement Rates for Retired Workers, with net of income taxes paid on those benefits as a percentage of average annual lifetime earnings— Scheduled and Payable Benefits provide a perspective on retired workers’ benefits (Percent) that is different from that provided by looking simply at dollar amounts. Lowest Quintile of Middle Quintile of Highest Quintile of 10-Year Lifetime Household Lifetime Household Lifetime Household Several factors affect the patterns. First, the progres- Birth All Retired Workers Earnings Earnings Earnings sive nature of Social Security’s benefit formula Cohort Scheduled Payable Scheduled Payable Scheduled Payable Scheduled Payable results in replacement rates that are higher for All workers within a birth cohort who have had lower 1940s 43 43 70 70 42 42 29 29 earnings. Second, with payable benefits, the 1960s 43 43 68 68 41 41 27 27 replacement rate will drop noticeably at all earnings 1980s 44 38 71 60 43 36 28 24 amounts for people in the cohorts that first receive 2000s 43 34 69 55 42 33 25 20 benefits after the trust funds are exhausted. Men Third, the scheduled increase in the full retirement 1940s 40 40 61 61 38 38 23 23 age will, in the absence of other changes, lower the 1960s 39 39 63 63 39 39 22 22 replacement rate for future beneficiaries (for any 1980s 41 35 66 56 40 34 23 19 chosen age for claiming benefits) compared with 2000s 41 32 65 51 39 32 21 17 the rate for people who are claiming benefits now. However, because of other factors, such as changes Women in the relative earnings levels of different groups, 1940s 48 48 77 77 47 47 39 39 the median replacement rates for the cohorts shown 1960s 47 47 72 72 44 44 34 34 in the exhibit are generally stable. People in later 1980s 48 41 72 62 46 39 34 29 cohorts, however, are expected to collect benefits 2000s 47 37 71 57 44 35 32 26 for a longer time as life expectancy increases. Fourth, because women tend to have lower lifetime Source: Congressional Budget Office. earnings, their average replacement rates are higher Note: The average initial replacement rate is a worker’s initial benefit as a percentage of a worker’s average than men’s are, especially for earlier birth cohorts. annual lifetime earnings. (To compute lifetime earnings, past earnings are adjusted for average growth The difference between the rates for women and in economywide earnings.) Replacement rates are computed for all individuals who are eligible to claim men in the highest quintile is large, in part because retirement benefits at age 62 and who have not yet claimed any other benefit. All workers are assumed that group includes many women who spend time to claim benefits at age 65. All values are net of income taxes paid on benefits and credited to the out of the labor force or who work part time. In Social Security trust funds. contrast, most men in households with high earn- ings are employed full time. CBO
- 20. DISTRIBUTION OF BENEFITS THE 2012 LONG-TERM PROJECTIONS FOR SOCIAL SECURITY: ADDITIONAL INFORMATION 17 Exhibit 11. CBO calculates lifetime retirement benefits as the Median Present Value of Lifetime Benefits for Retired Workers, with present value, discounted to the year in which the beneficiary turns 62, of all retired-worker bene- Scheduled and Payable Benefits fits that a worker receives from the program. CBO (Thousands of 2012 dollars) estimates that real median lifetime benefits (both scheduled and payable, adjusted for inflation) for Lowest Quintile of Middle Quintile of Highest Quintile of each birth cohort will be greater than those for the 10-Year Lifetime Household Lifetime Household Lifetime Household preceding cohort, because benefits increase with Birth All Retired Workers Earnings Earnings Earnings earnings and earnings are expected to continue to Cohort Scheduled Payable Scheduled Payable Scheduled Payable Scheduled Payable rise over time. For example, real median scheduled All lifetime benefits for people born in the 2000s will 1940s 141 140 63 63 167 165 280 278 be more than two-and-a-half times those for people 1960s 214 193 117 108 241 215 385 343 born in the 1940s; real median payable lifetime 1980s 273 225 157 131 299 246 507 421 benefits for the 2000s cohort will be more than 2000s 383 295 219 170 430 332 710 553 double. Men The projected trends in median lifetime retirement 1940s 142 142 55 55 195 195 333 331 benefits differ from the trends in median initial 1960s 239 216 122 112 270 242 432 383 benefits for two reasons. First, as life expectancy 1980s 297 244 165 137 320 264 560 466 increases, people will collect benefits for longer 2000s 415 320 230 179 460 355 760 597 periods, so scheduled lifetime benefits will grow faster than scheduled initial benefits. Second, Women although cohorts that begin to receive benefits 1940s 140 139 72 72 153 151 217 213 before the trust funds are exhausted will collect 1960s 194 174 113 103 217 194 323 289 their scheduled initial benefits, some members of 1980s 252 208 149 124 285 233 435 361 those cohorts will still be receiving benefits when 2000s 355 274 209 163 405 302 620 482 the trust funds are exhausted. At that point, pay- able benefits will decline, and the payable lifetime Source: Congressional Budget Office. benefits for those recipients will be less than their Note: Benefits are the present value of all retired-worker benefits received. To calculate their present value, scheduled lifetime benefits. benefits are adjusted for inflation (to produce constant dollars) and discounted to age 62. All values are Lifetime benefits are lower for women than for net of income taxes paid on benefits and credited to the Social Security trust funds. men, although the gap is smaller than it is for initial benefits because women live longer, on average, and thus tend to collect benefits for a longer time. CBO