SlideShare uma empresa Scribd logo
1 de 5
Baixar para ler offline
MAY 2012
                                              LOGISTICS MARKET SNAPSHOT
   Fueling Logistics Competitiveness                                                            Prepared: May 15, 2012


MULTIMODAL:
Dow Jones Transportation Index     Dow Jones Transportation index was up 0.9% during the month of April.
                                                                                                                                                      th            th
                                   (Stock performance of twenty large, well-known U.S. companies in the transportation industry, average of April 10 thru May 10 )

NASDAQ Transportation Index        NASDAQ Transportation Index decreased 3% in April.
                                                                                                                                                     th            th
                                   (Averaged share weights of NASDAQ-listed companies classified as transportation companies, average of April 10 thru May 10 )

                                   The USDOT's freight transportation services index fell 0.8% in March 2012 following an increase of 0.5% in
DOT Freight Transportation Index
                                   February. The index’s reading of 109.4 was 0.8% higher year-over-year. (Source: US DOT)
                                   The April shipments index rose 1.9% over the previous month and increased 0.2% year-over-year. The April
Cass Freight Index                 expenditures index increased 3.4% for the month, and increased 5.1% year over year.
                                   (Source: Cass Information Systems | Cassinfo.com)
                                   (Based upon transportation dollars and shipments of Cass clients comprised of over 400 shipping companies)
                                   In March, the U.S. imported about $238.6 billion of cargo, the highest on record. March U.S. imports have
Import Volumes
                                   increased 5.2% in terms of value over the previous month and grew 8.4% year-over-year. (Source: US Census)
                                   In March, the U.S. exported more than $186.8 billion of cargo, the highest on record. March U.S. exports
Export Volumes                     have increased 2.9% in terms of value over the previous month and grew 7.3% year-over-year. (Source: US
                                   Census)
                                   U.S. import prices decreased 0.5% in April, the first monthly decrease since a 0.4% decline in October 2011.
                                   Despite the April decline, import prices rose 0.5% over the past year. The price index for U.S. exports rose
Import & Export Price Index
                                   0.4% in April, following a 1.5% increase in the first quarter of 2012.
                                   (Source: Bureau of Labor Statistics)
                                      During the first quarter, intermodal traffic was up for all container sizes. Year-to-date, 53-foot container
Multimodal News Clips:                 traffic surged 15.9%, 40-footers were up 3.1%, and 20-footers increased by 2.8% year-over-year.
                                       (Source: Intermodal Association of North America |www.intermodal.org)
                                      Compared to 4Q-2011, 4Q-2012 jobs in the transportation and warehousing sectors are expected to
                                       increase at a rate of 1.4% in the U.S. and should increase by 2.2% in Georgia. Logistics industry jobs in the
                                       state of Georgia will grow the most in Valdosta with 13.1% growth, and Columbus with 10% growth.
                                       (Source: Moody’s Analytics)
                                      The U.S. Postal Service lost $3.2 billion in the fiscal second quarter, $1.1 billion more than the year
                                       before. The agency blamed much of the losses on having to pre-fund retiree health benefits, not being
                                       able to close thousands of post offices and mail process centers, and being restricted from cutting some
                                       120,000 workers and Saturday delivery. While revenue related to shipping and packages grew more than
                                       13% in the second quarter year-over-year, mailing service revenue fell 3%.
                                      Package delivery company UPS reported a 4.3% increase in first quarter revenue to $13.1 billion from
                                       $12.6 billion a year earlier. The company’s operating profit rose 6.3% to $1.6 billion year-over-year on a
                                       4.3% increase in packages delivered, to 1 billion packages.


RAIL:
                                   Railroad bulk carload freight in April 2012 decreased 2% from March 2012. Freight traffic in April fell 5.5%
                                   from April 2011. The decrease in freight rail traffic was mainly due to another decline in coal shipments.
U.S. Freight Rail Traffic
                                   Carloads excluding coal increased 3.2% over the previous year.
                                   (Source: AAR.org) (Report includes rail car-loadings by 19 different major commodity categories as well as intermodal units)
                                   Intermodal rail traffic in April 2012 was 3.6% higher than in April 2011 and 0.3% higher than March 2012
U.S. Intermodal Rail Traffic       totals. Intermodal loadings have experienced year-over-year gains for 29 straight months.
                                   (Source: AAR.org) (Report includes rail car-loadings by 19 different major commodity categories as well as intermodal units)

                                   The index of average railroad fuel prices in February was 659.6, up 4.2% from the previous month and 5.8%
Railroad Fuel Price Index          higher year-over-year. (Source: AAR.org)
                                   (Average monthly price for gallons purchased by freight railroads; Includes federal excise taxes, transportation, and handling expenses)

                                   The number of freight cars in storage has increased to 307,957 (20.1% of the fleet) on May 1, up 8,633 cars
Freight Cars in Storage            from a month earlier. (Source: AAR.org)
                                   (A freight car is "in storage" if it has had a loaded revenue move since 2005, but not in the past 60 days. Decrease here = more demand)
                                   Railroad employment in March 2012 increased by 1,295 employees to 160,523 employees, the highest
Class 1 Railroad Employment        since December 2008. Total Class 1 rail employment in March 2012 was 3% higher than it was in March
                                   2011. (Source: U.S. STB)


                                                                                1
MAY 2012
                                              LOGISTICS MARKET SNAPSHOT
  Fueling Logistics Competitiveness                                                               Prepared: May 15, 2012


                                  In April 2012, short line railroad shipments across North America fell 0.5% compared to the same month last
Short Line Rail Traffic           year. A sampling of about 408 small railroads in the U.S. and Canada loaded 510,679 railcars and intermodal
                                  units during the month of April. (Source: RMI RailConnect Index | rmiondemand.com)
                                     CSX recorded a record first quarter profit for 2012 as earning rose 13.7% year-over-year to $449 million.
Railroad News Clips:                  The company boosted first quarter revenue 6% to nearly $3 billion despite volume rising only 1%.
                                      Although coal traffic fell 14% year-over-year, the revenue per coal carload rose 10% in the same period.
                                     Norfolk Southern also reported record profit for the first quarter, as the railroad’s strong pricing raised
                                      earnings 26% year-over-year to $410 million. The company’s revenue rose 6% to a record $2.8 billion.
                                     Recent increases in auto sales have boosted rail traffic for CSX, Norfolk Southern, Kansas City Southern,
                                      and Union Pacific. During the last week in March, the Class I railroads hauled 17,283 carloads of
                                      automobiles, the most since June 2008. (Source: AAR.org)

TRUCKING:
                                  Over-the-Road Trucked Shipments rose 0.1% in April following a 0.3% increase in March and a 0.7% increase
Over-the-Road Trucked Shipments   in February. Overall trucked shipments decreased 1.9% on a year-over-year basis. (Source: Ceridianindex.com)
                                  (From the Ceridian-UCLA Pulse of Commerce Index which is based on real-time fuel consumption data for over the road trucking)
                                  The ATA’s seasonally adjusted cargo index rose 0.2% in March. The for-hire truck tonnage index rose 2.7%
Trucking Volume
                                  year-over-year. (Source: American Trucking Association | Trucking.org)
                                  The spot market for truckload freight in April rose 12% compared to the previous month, and was 12%
Truckload Freight                 higher year-over-year. Truck capacity rose 3% for the month, and was up 13% year-over-year.
                                  (Source: TransCore Freight Index | www.transcorefreightsolutions.com)
                                  U.S. average diesel prices fell last week to $4.00 per gallon, the fifth straight week of decline. Last week’s
Diesel Prices                     average diesel price was 5.3¢ lower than the previous week, and was 5.7¢ lower than the same week last
                                  year. The average price of diesel in the lower Atlantic states was $3.97 per gallon. (Source: U.S. DOE)
                                  (Reflects the costs and profits of the entire production and distribution chain.)

                                  The trucking industry added 1,800 jobs in April. The trucking workforce increased 0.14% from the previous
Trucking Employment
                                  month and rose 3% over the previous year. (Source: U.S. DOL)
                                  Orders for heavy-duty Class 8 trucks in North America are expected to total 17,200 units in April 2012 after
Truck Orders                      20,025 units were ordered in March. April’s projected Class 8 orders are 122% lower year-over-year.
                                  (Source: ACT Research | actresearch.net)
                                  Surface transport-related trade between the U.S. and its NAFTA partners, Canada and Mexico, was up 17.4%
                                                                                                                                    th
NAFTA Trade                       in February compared to the same month in 2011, reaching $78.1 billion. January was the 27 consecutive
                                  month of year-over-year increases. (Source: US DOT)
                                   Con-way more than tripled its net profit in the first quarter, increasing earnings to $25.6 million as
                                     revenue rose 9.7% to $1.37 billion. The company’s LTL unit, Con-way freight increased its operating profit
Trucking News Clips:
                                     69.6% year-over-year to $831 million on a 1.5% growth in tonnage. Menlo Worldwide Logistics, Con-way’s
                                     logistics division increased operating profit by 42.2%. Con-way Truckload’s operating profit rose 48.9%.
                                   Landstar System increased its net profit 30% to $26.8 million as truck transportation revenue rose 15.8%
                                     to $600.2 million in the first quarter. The truckload operator had the best first quarter in its history,
                                     increasing total revenue 13.5% to $649 million.
                                     Old Dominion Freight Line announced a record revenue growth of 17.6% that pushed profit up 44% year-
                                      over-year in the first quarter to $31.1 million. The company saw revenue rise to $497.1 million on a 9.5%
                                      increase in shipments and higher pricing.


AIR FREIGHT:
Air Cargo Traffic                 Global air freight traffic in March rose 0.3% from one year ago and was up 2.2% from the previous month.
                                  North American air freight in March rose 2% year-over-year. (Source: IATA.org)
                                  (Global air freight covers international and domestic scheduled air traffic. North American traffic includes only domestic freight traffic.)

                                  In March, Hartsfield-Jackson Atlanta International Airport transported 56,718 metric tons of cargo, a 12%
Atlanta Air Cargo Traffic
                                  increase over the previous month and a 2.24% decrease year-over-year. (Source: HJIA)


                                                                                2
MAY 2012
                                            LOGISTICS MARKET SNAPSHOT
  Fueling Logistics Competitiveness                                                            Prepared: May 15, 2012


                                 In March, average international air cargo prices rose 7.3% from the previous month. Average air freight rates
Air Freight Price Index          were up 2.8% year-over-year. (Source: Bureau of Labor Statistics)
                                 (The Drewry Air Freight Price Index is based on the average of rates ($US per kg) for cargoes of 100+kg to 1,000+kg cargoes from Shanghai
                                 to London, Moscow, Prague, New York, and Los Angeles.)


Jet Fuel Prices                  As of May 4, 2012, the global average jet fuel price was $130 per barrel; down 5.4% from the previous
                                 month, and 0.7% lower year-over-year. (Source: IATA.org, platts.com)
                                 (The weekly index and price data shows the global average price paid at the refinery for aviation jet fuel)
                                     Major Japanese international freight forwarder Kintetsu World Express reported that its group net profit
                                      rose a record 21.1% to $119.31 million in FY 2011, which ended on March 31. KWE also announced its
Air Freight News Clips:
                                      group revenue and profit forecasts for FY2012. Operating revenue is expected to increase 13.5% to $3.75
                                      billion, while operating profit should increase 8.5% to $187.5 million.
                                     Nippon Express, Japan’s largest international freight forwarder, said that its net profit surged 215.5% in
                                      FY2011, to $336.88 million. The Tokyo-based company’s group operating profit rose 18.6% to $468.75
                                      million.


OCEAN FREIGHT:
                                 Import shipment volume, in TEUs, at U.S. ports increased 9.2% in April from the previous month and rose
                                 7.2% over the previous year. YTD, April has shown the highest number of TEU imports, with over 1.52
Import Volumes                   million TEUs imported, and the second-largest number of shipments, with 756,000 processed. U.S. imports
                                 are expected to show further increases during the summer months with spikes in May, July, and August.
                                 (Source: Zepol Corporation | zepol.com)
                                              th
                                 The May 4 SCFI comprehensive reading was $1,501.46 per FEU; up 0.9% from the previous week, and
Shanghai Containerized           40.5% higher year-over-year. The spot rate for shipments to the U.S. East Coast was $3,579 per FEU, up
Freight Index                    0.6% from the previous year. (Source: Shanghai Shipping Exchange | www1.chineseshipping.com.cn/en)
                                 (The Shanghai Containerized Freight Index is a weekly reported average export spot rate from Shanghai for 15 different trade lanes.)

                                 The Baltic Dry Index increased 23.7% in April, ending at 1,155. The BDI has fallen 1.5% for the first half of
Ocean Bulk Freight Rates         May. (Source: www.bloomberg.com/quote/BDIY:IND)
                                 (The Baltic Dry Index is an index that tracks and averages worldwide international shipping prices of various dry bulk cargoes.)
                                 Average bunker fuel price fell 1.4% to end the month of April at $885.74/MT. By mid-May, bunker fuel prices
Bunker Fuel Price Index          had fallen 3.4% to $855.28/MT. (Source: bunkerindex.com)
                                 (The Bunker Index is the average global bunker fuel price from individual ports; measure in $US per MT or megaton)
                                 In March, the Georgia Ports Authority marked its highest monthly numbers ever, handling 2.37 million tons
                                 of freight, including 2.03 million tons of containerized cargo. Container traffic was 9.2% higher year-over-
Port of Savannah
                                 year, totaling 259,796 TEUs. 203 vessels called on the Port of Savannah in March, an increase of 10.9% over
                                 February’s vessel calls. (Source: GPA)
                                 In March, the Port of Brunswick handled 57,001 auto and machinery units, an increase of 30% from the
Port of Brunswick
                                 previous year and a 79% increase over March 2010. (Source: GPA)
                                     Last month, an additional $46.7 million was approved for the Savannah Harbor deepening project. The
Ocean Freight Business News:          new funds were passed by the General Assembly as a part of the Governor’s FY 2013 budget request,
                                      bringing the total of dedicated state dollars to $181.1 million.
                                     Import volume through major U.S. container ports is expected to increase 3.4% this year over 2011 to
                                      $2.53 trillion. In March, the latest month for which numbers are available, containerized imports at U.S.
                                      ports were up 14.1% from February and were 8.5% higher year-over-year. (Source: NRF/Hackett Associates)
                                     In 1956, the cost of shipping goods by ocean represented about 15% of their value; today it’s less than 1%
                                      on average. Freight rates today are less than they were 20 years ago, while vessel, fuel, terminal, and
                                      other costs have risen significantly.
                                     Norway’s Wilhelmsen boosted first quarter operating profit by 84% from a year ago to $106 million,
                                      driven by record earnings and revenue at its global car carrier and rolling cargo fleet. At the end of March,
                                      the operating companies in the group controlled 137 ships, up from 128 a year ago, accounting for 23% of
                                      the global market capacity.
                                     The active container ship fleet has soured to a record 15 million TEUs, driven by deliveries of new vessels
                                      and a sharp reduction in the number of laid-up ships. Sixty-two new container ships with a total capacity
                                      of 455,000 TEUs have been delivered since the beginning of the year, 23 of which exceeded 10,000 TEUs
                                      each.


                                                                              3
MAY 2012
                                             LOGISTICS MARKET SNAPSHOT
  Fueling Logistics Competitiveness                                                           Prepared: May 15, 2012


WAREHOUSING & DISTRIBUTION:
                                  The U.S. average industrial vacancy rate was 9.6% during Q1 2012, down from 10% in the previous quarter.
Industrial Vacancy                Overall vacancy was 10.4% in Atlanta and 12.5% in Savannah during the first quarter.
                                  (Source: Cushman & Wakefield)
                                  In Q1 2012, warehouse and distribution rental rates in the US averaged $4.27 per square foot. Rental rates
Warehouse Rent Rates              for warehouse space averaged $3.40/square foot in Atlanta and $3.71/square foot in Savannah.
                                  (Source: Cushman & Wakefield)
                                  Net absorption in the US during Q1 2012 totaled +23.5 million square feet. Absorption during the 1Q totaled
Industrial Absorption             nearly +620,000 square feet in Atlanta. (Source: Cushman & Wakefield)
                                  (Absorption is the net change in occupied space between two points in time. Positive absorption means that previously unoccupied space is
                                  being occupied.)
                                  The National PMI rose 1.4 points to 54.8 in April 2012. The April PMI has indicated expansion in the
                                                                  rd
                                  manufacturing sector for the 33 consecutive month. New orders increased 3.7 points to 58.2 and
Purchasing Managers Index         production rose 2.7 points to 61.0. (Source: Institute for Supply Management)
                                  (The PMI combines data on new orders, inventory, production, supplier deliveries, and employment. A reading above 50 indicates that the
                                  manufacturing economy is generally expanding.)
                                  Georgia’s PMI rose 3.1 points to 63.8 in April. New orders in Georgia increased 4.4 points to 72.9 and
Purchasing Managers Index         production was up 6.3 points to 72.9. Georgia’s PMI of 63.8 outperformed the national PMI by 9 points and
in Georgia                        has remained above 60 for the third consecutive month. (Source: Kennesaw State University)
                                  (The PMI combines data on new orders, inventory, production, supplier deliveries, and employment. A reading above 50 indicates that the
                                  manufacturing economy is generally expanding.)
                                     Baxter International will locate a new bio-pharmaceutical manufacturing facility near Interstate 20 east of
                                      Atlanta as well as plasma centers throughout Georgia that will employ approximately 1,500 people across
W&D Business News:
                                      the state. Total investment by the company will exceed $1 billion. Baxter’s new Georgia facility will
                                      manufacture plasma-based therapies that treat chronic and life-threatening illnesses.


U.S. MARKET:
                                  The U.S. GDP increased 2.2% in the first quarter of 2012 according to the preliminary estimate released by
Gross Domestic Product
                                  the Bureau of Economic Analysis. (Source: US BEA)
                                  The U.S. trade deficit increased by 14.1% in March to $51.8 billion. Exports increased 2.9 to $186.8 billion
U.S. Trade Deficit                and imports increased 5.2% to $238.6 billion. U.S. imports and exports in March were the highest on
                                  record. (Source: US DOC & Census Bureau)
                                  The Consumer Confidence Index decreased to 69.2 in April 2012 from 70.2 in March 2012.
Consumer Confidence               (Source: The Conference Board) (The consumer confidence index is based on a monthly survey of 5,000 U.S. households. It is designed
                                  to gauge the financial health, spending power, and confidence of the average U.S. consumer.)
                                  The unemployment rate in America fell to 8.1% in April 2012, the lowest level since January 2009.
Unemployment Rate                 Approximately 115,000 net new jobs were created in April, down from 154,000 new jobs created in March.
                                  (Source: US DOL)
                                  The Leading Economic Index for the U.S. increased 0.3% in March to 95.7 (2004=100), following a 0.7%
Leading Economic Index            increase in February and a 0.2% increase in January. (Source: Conference Board)
                                  (The LEI is a composite of 10 economic indicators that together create an analytic system designed to signal peaks and troughs in the
                                  business cycle. The LEI reveals patterns in economic data in a clearer and more convincing manner than any individual component alone.)

                                  Retail and food service sales rose in April to $408 billion, up 0.1% from the previous month, and up 6.4%
Retail Sales
                                  from April 2011. Non-store retailer sales were up 11% from last year. (Source: US Census)

                                  Total combined sales and manufacturing shipments totaled nearly $1.24 Trillion in March 2012, up 0.6%
Manufacturing & Trade Sales
                                  from February and up 5.8% from the previous year. (Source: US Census)
                                  Total value of inventory on hand is estimated at $1.58 Trillion in March 2012, up 0.3% from February and up
Manufacturing & Trade Inventory
                                  6.6% from March 2011. (Source: US Census)
                                  In April, housing starts increased 2.6% to an annual rate of 717,000 units, which is 30% higher than April
Housing Starts                    2011. Building permits (an indicator of future housing starts) fell 7.0% to an annual rate of 715,000, but still
                                  up 24% over April 2011. (Source: U.S. DOC)
                                  The consumer price index for all urban consumers increased 0.3% in April over the previous month. Over the
                                  last 12 months, the all items index increased 2.3%. The producer price index for finished goods fell 0.2% in
Consumer & Producer Price Index
                                  April from the previous month. Prices for finished goods increased 1.9% over the previous year.
                                  (Source: US Bureau of Labor Statistics)


                                                                              4
MAY 2012
                                    LOGISTICS MARKET SNAPSHOT
Fueling Logistics Competitiveness                    Prepared: May 15, 2012


 To sign-up to receive these free monthly snapshots, visit: snapshot.georgialogistics.org
      For more information about the Logistics Market Snapshot or the many other
 resources and activities of the Georgia Center of Innovation for Logistics please contact:
         Page Siplon, Executive Director – psiplon@georgia.org – 912.966.7867


                                             5

Mais conteúdo relacionado

Último

Flow Your Strategy at Flight Levels Day 2024
Flow Your Strategy at Flight Levels Day 2024Flow Your Strategy at Flight Levels Day 2024
Flow Your Strategy at Flight Levels Day 2024Kirill Klimov
 
Financial-Statement-Analysis-of-Coca-cola-Company.pptx
Financial-Statement-Analysis-of-Coca-cola-Company.pptxFinancial-Statement-Analysis-of-Coca-cola-Company.pptx
Financial-Statement-Analysis-of-Coca-cola-Company.pptxsaniyaimamuddin
 
APRIL2024_UKRAINE_xml_0000000000000 .pdf
APRIL2024_UKRAINE_xml_0000000000000 .pdfAPRIL2024_UKRAINE_xml_0000000000000 .pdf
APRIL2024_UKRAINE_xml_0000000000000 .pdfRbc Rbcua
 
8447779800, Low rate Call girls in Saket Delhi NCR
8447779800, Low rate Call girls in Saket Delhi NCR8447779800, Low rate Call girls in Saket Delhi NCR
8447779800, Low rate Call girls in Saket Delhi NCRashishs7044
 
MAHA Global and IPR: Do Actions Speak Louder Than Words?
MAHA Global and IPR: Do Actions Speak Louder Than Words?MAHA Global and IPR: Do Actions Speak Louder Than Words?
MAHA Global and IPR: Do Actions Speak Louder Than Words?Olivia Kresic
 
Kenya’s Coconut Value Chain by Gatsby Africa
Kenya’s Coconut Value Chain by Gatsby AfricaKenya’s Coconut Value Chain by Gatsby Africa
Kenya’s Coconut Value Chain by Gatsby Africaictsugar
 
Ten Organizational Design Models to align structure and operations to busines...
Ten Organizational Design Models to align structure and operations to busines...Ten Organizational Design Models to align structure and operations to busines...
Ten Organizational Design Models to align structure and operations to busines...Seta Wicaksana
 
Fordham -How effective decision-making is within the IT department - Analysis...
Fordham -How effective decision-making is within the IT department - Analysis...Fordham -How effective decision-making is within the IT department - Analysis...
Fordham -How effective decision-making is within the IT department - Analysis...Peter Ward
 
Traction part 2 - EOS Model JAX Bridges.
Traction part 2 - EOS Model JAX Bridges.Traction part 2 - EOS Model JAX Bridges.
Traction part 2 - EOS Model JAX Bridges.Anamaria Contreras
 
8447779800, Low rate Call girls in Uttam Nagar Delhi NCR
8447779800, Low rate Call girls in Uttam Nagar Delhi NCR8447779800, Low rate Call girls in Uttam Nagar Delhi NCR
8447779800, Low rate Call girls in Uttam Nagar Delhi NCRashishs7044
 
Annual General Meeting Presentation Slides
Annual General Meeting Presentation SlidesAnnual General Meeting Presentation Slides
Annual General Meeting Presentation SlidesKeppelCorporation
 
Call US-88OO1O2216 Call Girls In Mahipalpur Female Escort Service
Call US-88OO1O2216 Call Girls In Mahipalpur Female Escort ServiceCall US-88OO1O2216 Call Girls In Mahipalpur Female Escort Service
Call US-88OO1O2216 Call Girls In Mahipalpur Female Escort Servicecallgirls2057
 
(Best) ENJOY Call Girls in Faridabad Ex | 8377087607
(Best) ENJOY Call Girls in Faridabad Ex | 8377087607(Best) ENJOY Call Girls in Faridabad Ex | 8377087607
(Best) ENJOY Call Girls in Faridabad Ex | 8377087607dollysharma2066
 
Chapter 9 PPT 4th edition.pdf internal audit
Chapter 9 PPT 4th edition.pdf internal auditChapter 9 PPT 4th edition.pdf internal audit
Chapter 9 PPT 4th edition.pdf internal auditNhtLNguyn9
 
The-Ethical-issues-ghhhhhhhhjof-Byjus.pptx
The-Ethical-issues-ghhhhhhhhjof-Byjus.pptxThe-Ethical-issues-ghhhhhhhhjof-Byjus.pptx
The-Ethical-issues-ghhhhhhhhjof-Byjus.pptxmbikashkanyari
 
International Business Environments and Operations 16th Global Edition test b...
International Business Environments and Operations 16th Global Edition test b...International Business Environments and Operations 16th Global Edition test b...
International Business Environments and Operations 16th Global Edition test b...ssuserf63bd7
 
8447779800, Low rate Call girls in Tughlakabad Delhi NCR
8447779800, Low rate Call girls in Tughlakabad Delhi NCR8447779800, Low rate Call girls in Tughlakabad Delhi NCR
8447779800, Low rate Call girls in Tughlakabad Delhi NCRashishs7044
 
Independent Call Girls Andheri Nightlaila 9967584737
Independent Call Girls Andheri Nightlaila 9967584737Independent Call Girls Andheri Nightlaila 9967584737
Independent Call Girls Andheri Nightlaila 9967584737Riya Pathan
 
Cybersecurity Awareness Training Presentation v2024.03
Cybersecurity Awareness Training Presentation v2024.03Cybersecurity Awareness Training Presentation v2024.03
Cybersecurity Awareness Training Presentation v2024.03DallasHaselhorst
 

Último (20)

Flow Your Strategy at Flight Levels Day 2024
Flow Your Strategy at Flight Levels Day 2024Flow Your Strategy at Flight Levels Day 2024
Flow Your Strategy at Flight Levels Day 2024
 
Financial-Statement-Analysis-of-Coca-cola-Company.pptx
Financial-Statement-Analysis-of-Coca-cola-Company.pptxFinancial-Statement-Analysis-of-Coca-cola-Company.pptx
Financial-Statement-Analysis-of-Coca-cola-Company.pptx
 
APRIL2024_UKRAINE_xml_0000000000000 .pdf
APRIL2024_UKRAINE_xml_0000000000000 .pdfAPRIL2024_UKRAINE_xml_0000000000000 .pdf
APRIL2024_UKRAINE_xml_0000000000000 .pdf
 
8447779800, Low rate Call girls in Saket Delhi NCR
8447779800, Low rate Call girls in Saket Delhi NCR8447779800, Low rate Call girls in Saket Delhi NCR
8447779800, Low rate Call girls in Saket Delhi NCR
 
MAHA Global and IPR: Do Actions Speak Louder Than Words?
MAHA Global and IPR: Do Actions Speak Louder Than Words?MAHA Global and IPR: Do Actions Speak Louder Than Words?
MAHA Global and IPR: Do Actions Speak Louder Than Words?
 
Kenya’s Coconut Value Chain by Gatsby Africa
Kenya’s Coconut Value Chain by Gatsby AfricaKenya’s Coconut Value Chain by Gatsby Africa
Kenya’s Coconut Value Chain by Gatsby Africa
 
Ten Organizational Design Models to align structure and operations to busines...
Ten Organizational Design Models to align structure and operations to busines...Ten Organizational Design Models to align structure and operations to busines...
Ten Organizational Design Models to align structure and operations to busines...
 
Fordham -How effective decision-making is within the IT department - Analysis...
Fordham -How effective decision-making is within the IT department - Analysis...Fordham -How effective decision-making is within the IT department - Analysis...
Fordham -How effective decision-making is within the IT department - Analysis...
 
Traction part 2 - EOS Model JAX Bridges.
Traction part 2 - EOS Model JAX Bridges.Traction part 2 - EOS Model JAX Bridges.
Traction part 2 - EOS Model JAX Bridges.
 
8447779800, Low rate Call girls in Uttam Nagar Delhi NCR
8447779800, Low rate Call girls in Uttam Nagar Delhi NCR8447779800, Low rate Call girls in Uttam Nagar Delhi NCR
8447779800, Low rate Call girls in Uttam Nagar Delhi NCR
 
Annual General Meeting Presentation Slides
Annual General Meeting Presentation SlidesAnnual General Meeting Presentation Slides
Annual General Meeting Presentation Slides
 
Enjoy ➥8448380779▻ Call Girls In Sector 18 Noida Escorts Delhi NCR
Enjoy ➥8448380779▻ Call Girls In Sector 18 Noida Escorts Delhi NCREnjoy ➥8448380779▻ Call Girls In Sector 18 Noida Escorts Delhi NCR
Enjoy ➥8448380779▻ Call Girls In Sector 18 Noida Escorts Delhi NCR
 
Call US-88OO1O2216 Call Girls In Mahipalpur Female Escort Service
Call US-88OO1O2216 Call Girls In Mahipalpur Female Escort ServiceCall US-88OO1O2216 Call Girls In Mahipalpur Female Escort Service
Call US-88OO1O2216 Call Girls In Mahipalpur Female Escort Service
 
(Best) ENJOY Call Girls in Faridabad Ex | 8377087607
(Best) ENJOY Call Girls in Faridabad Ex | 8377087607(Best) ENJOY Call Girls in Faridabad Ex | 8377087607
(Best) ENJOY Call Girls in Faridabad Ex | 8377087607
 
Chapter 9 PPT 4th edition.pdf internal audit
Chapter 9 PPT 4th edition.pdf internal auditChapter 9 PPT 4th edition.pdf internal audit
Chapter 9 PPT 4th edition.pdf internal audit
 
The-Ethical-issues-ghhhhhhhhjof-Byjus.pptx
The-Ethical-issues-ghhhhhhhhjof-Byjus.pptxThe-Ethical-issues-ghhhhhhhhjof-Byjus.pptx
The-Ethical-issues-ghhhhhhhhjof-Byjus.pptx
 
International Business Environments and Operations 16th Global Edition test b...
International Business Environments and Operations 16th Global Edition test b...International Business Environments and Operations 16th Global Edition test b...
International Business Environments and Operations 16th Global Edition test b...
 
8447779800, Low rate Call girls in Tughlakabad Delhi NCR
8447779800, Low rate Call girls in Tughlakabad Delhi NCR8447779800, Low rate Call girls in Tughlakabad Delhi NCR
8447779800, Low rate Call girls in Tughlakabad Delhi NCR
 
Independent Call Girls Andheri Nightlaila 9967584737
Independent Call Girls Andheri Nightlaila 9967584737Independent Call Girls Andheri Nightlaila 9967584737
Independent Call Girls Andheri Nightlaila 9967584737
 
Cybersecurity Awareness Training Presentation v2024.03
Cybersecurity Awareness Training Presentation v2024.03Cybersecurity Awareness Training Presentation v2024.03
Cybersecurity Awareness Training Presentation v2024.03
 

Destaque

2024 State of Marketing Report – by Hubspot
2024 State of Marketing Report – by Hubspot2024 State of Marketing Report – by Hubspot
2024 State of Marketing Report – by HubspotMarius Sescu
 
Everything You Need To Know About ChatGPT
Everything You Need To Know About ChatGPTEverything You Need To Know About ChatGPT
Everything You Need To Know About ChatGPTExpeed Software
 
Product Design Trends in 2024 | Teenage Engineerings
Product Design Trends in 2024 | Teenage EngineeringsProduct Design Trends in 2024 | Teenage Engineerings
Product Design Trends in 2024 | Teenage EngineeringsPixeldarts
 
How Race, Age and Gender Shape Attitudes Towards Mental Health
How Race, Age and Gender Shape Attitudes Towards Mental HealthHow Race, Age and Gender Shape Attitudes Towards Mental Health
How Race, Age and Gender Shape Attitudes Towards Mental HealthThinkNow
 
AI Trends in Creative Operations 2024 by Artwork Flow.pdf
AI Trends in Creative Operations 2024 by Artwork Flow.pdfAI Trends in Creative Operations 2024 by Artwork Flow.pdf
AI Trends in Creative Operations 2024 by Artwork Flow.pdfmarketingartwork
 
PEPSICO Presentation to CAGNY Conference Feb 2024
PEPSICO Presentation to CAGNY Conference Feb 2024PEPSICO Presentation to CAGNY Conference Feb 2024
PEPSICO Presentation to CAGNY Conference Feb 2024Neil Kimberley
 
Content Methodology: A Best Practices Report (Webinar)
Content Methodology: A Best Practices Report (Webinar)Content Methodology: A Best Practices Report (Webinar)
Content Methodology: A Best Practices Report (Webinar)contently
 
How to Prepare For a Successful Job Search for 2024
How to Prepare For a Successful Job Search for 2024How to Prepare For a Successful Job Search for 2024
How to Prepare For a Successful Job Search for 2024Albert Qian
 
Social Media Marketing Trends 2024 // The Global Indie Insights
Social Media Marketing Trends 2024 // The Global Indie InsightsSocial Media Marketing Trends 2024 // The Global Indie Insights
Social Media Marketing Trends 2024 // The Global Indie InsightsKurio // The Social Media Age(ncy)
 
Trends In Paid Search: Navigating The Digital Landscape In 2024
Trends In Paid Search: Navigating The Digital Landscape In 2024Trends In Paid Search: Navigating The Digital Landscape In 2024
Trends In Paid Search: Navigating The Digital Landscape In 2024Search Engine Journal
 
5 Public speaking tips from TED - Visualized summary
5 Public speaking tips from TED - Visualized summary5 Public speaking tips from TED - Visualized summary
5 Public speaking tips from TED - Visualized summarySpeakerHub
 
ChatGPT and the Future of Work - Clark Boyd
ChatGPT and the Future of Work - Clark Boyd ChatGPT and the Future of Work - Clark Boyd
ChatGPT and the Future of Work - Clark Boyd Clark Boyd
 
Getting into the tech field. what next
Getting into the tech field. what next Getting into the tech field. what next
Getting into the tech field. what next Tessa Mero
 
Google's Just Not That Into You: Understanding Core Updates & Search Intent
Google's Just Not That Into You: Understanding Core Updates & Search IntentGoogle's Just Not That Into You: Understanding Core Updates & Search Intent
Google's Just Not That Into You: Understanding Core Updates & Search IntentLily Ray
 
Time Management & Productivity - Best Practices
Time Management & Productivity -  Best PracticesTime Management & Productivity -  Best Practices
Time Management & Productivity - Best PracticesVit Horky
 
The six step guide to practical project management
The six step guide to practical project managementThe six step guide to practical project management
The six step guide to practical project managementMindGenius
 
Beginners Guide to TikTok for Search - Rachel Pearson - We are Tilt __ Bright...
Beginners Guide to TikTok for Search - Rachel Pearson - We are Tilt __ Bright...Beginners Guide to TikTok for Search - Rachel Pearson - We are Tilt __ Bright...
Beginners Guide to TikTok for Search - Rachel Pearson - We are Tilt __ Bright...RachelPearson36
 

Destaque (20)

2024 State of Marketing Report – by Hubspot
2024 State of Marketing Report – by Hubspot2024 State of Marketing Report – by Hubspot
2024 State of Marketing Report – by Hubspot
 
Everything You Need To Know About ChatGPT
Everything You Need To Know About ChatGPTEverything You Need To Know About ChatGPT
Everything You Need To Know About ChatGPT
 
Product Design Trends in 2024 | Teenage Engineerings
Product Design Trends in 2024 | Teenage EngineeringsProduct Design Trends in 2024 | Teenage Engineerings
Product Design Trends in 2024 | Teenage Engineerings
 
How Race, Age and Gender Shape Attitudes Towards Mental Health
How Race, Age and Gender Shape Attitudes Towards Mental HealthHow Race, Age and Gender Shape Attitudes Towards Mental Health
How Race, Age and Gender Shape Attitudes Towards Mental Health
 
AI Trends in Creative Operations 2024 by Artwork Flow.pdf
AI Trends in Creative Operations 2024 by Artwork Flow.pdfAI Trends in Creative Operations 2024 by Artwork Flow.pdf
AI Trends in Creative Operations 2024 by Artwork Flow.pdf
 
Skeleton Culture Code
Skeleton Culture CodeSkeleton Culture Code
Skeleton Culture Code
 
PEPSICO Presentation to CAGNY Conference Feb 2024
PEPSICO Presentation to CAGNY Conference Feb 2024PEPSICO Presentation to CAGNY Conference Feb 2024
PEPSICO Presentation to CAGNY Conference Feb 2024
 
Content Methodology: A Best Practices Report (Webinar)
Content Methodology: A Best Practices Report (Webinar)Content Methodology: A Best Practices Report (Webinar)
Content Methodology: A Best Practices Report (Webinar)
 
How to Prepare For a Successful Job Search for 2024
How to Prepare For a Successful Job Search for 2024How to Prepare For a Successful Job Search for 2024
How to Prepare For a Successful Job Search for 2024
 
Social Media Marketing Trends 2024 // The Global Indie Insights
Social Media Marketing Trends 2024 // The Global Indie InsightsSocial Media Marketing Trends 2024 // The Global Indie Insights
Social Media Marketing Trends 2024 // The Global Indie Insights
 
Trends In Paid Search: Navigating The Digital Landscape In 2024
Trends In Paid Search: Navigating The Digital Landscape In 2024Trends In Paid Search: Navigating The Digital Landscape In 2024
Trends In Paid Search: Navigating The Digital Landscape In 2024
 
5 Public speaking tips from TED - Visualized summary
5 Public speaking tips from TED - Visualized summary5 Public speaking tips from TED - Visualized summary
5 Public speaking tips from TED - Visualized summary
 
ChatGPT and the Future of Work - Clark Boyd
ChatGPT and the Future of Work - Clark Boyd ChatGPT and the Future of Work - Clark Boyd
ChatGPT and the Future of Work - Clark Boyd
 
Getting into the tech field. what next
Getting into the tech field. what next Getting into the tech field. what next
Getting into the tech field. what next
 
Google's Just Not That Into You: Understanding Core Updates & Search Intent
Google's Just Not That Into You: Understanding Core Updates & Search IntentGoogle's Just Not That Into You: Understanding Core Updates & Search Intent
Google's Just Not That Into You: Understanding Core Updates & Search Intent
 
How to have difficult conversations
How to have difficult conversations How to have difficult conversations
How to have difficult conversations
 
Introduction to Data Science
Introduction to Data ScienceIntroduction to Data Science
Introduction to Data Science
 
Time Management & Productivity - Best Practices
Time Management & Productivity -  Best PracticesTime Management & Productivity -  Best Practices
Time Management & Productivity - Best Practices
 
The six step guide to practical project management
The six step guide to practical project managementThe six step guide to practical project management
The six step guide to practical project management
 
Beginners Guide to TikTok for Search - Rachel Pearson - We are Tilt __ Bright...
Beginners Guide to TikTok for Search - Rachel Pearson - We are Tilt __ Bright...Beginners Guide to TikTok for Search - Rachel Pearson - We are Tilt __ Bright...
Beginners Guide to TikTok for Search - Rachel Pearson - We are Tilt __ Bright...
 

Logistics Market Snapshot May 2012

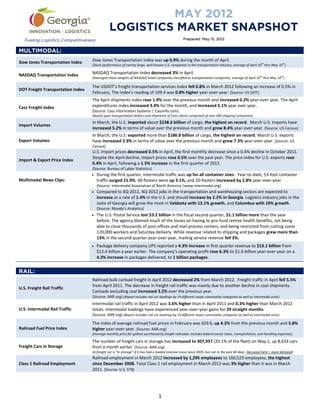
  • 1. MAY 2012 LOGISTICS MARKET SNAPSHOT Fueling Logistics Competitiveness Prepared: May 15, 2012 MULTIMODAL: Dow Jones Transportation Index Dow Jones Transportation index was up 0.9% during the month of April. th th (Stock performance of twenty large, well-known U.S. companies in the transportation industry, average of April 10 thru May 10 ) NASDAQ Transportation Index NASDAQ Transportation Index decreased 3% in April. th th (Averaged share weights of NASDAQ-listed companies classified as transportation companies, average of April 10 thru May 10 ) The USDOT's freight transportation services index fell 0.8% in March 2012 following an increase of 0.5% in DOT Freight Transportation Index February. The index’s reading of 109.4 was 0.8% higher year-over-year. (Source: US DOT) The April shipments index rose 1.9% over the previous month and increased 0.2% year-over-year. The April Cass Freight Index expenditures index increased 3.4% for the month, and increased 5.1% year over year. (Source: Cass Information Systems | Cassinfo.com) (Based upon transportation dollars and shipments of Cass clients comprised of over 400 shipping companies) In March, the U.S. imported about $238.6 billion of cargo, the highest on record. March U.S. imports have Import Volumes increased 5.2% in terms of value over the previous month and grew 8.4% year-over-year. (Source: US Census) In March, the U.S. exported more than $186.8 billion of cargo, the highest on record. March U.S. exports Export Volumes have increased 2.9% in terms of value over the previous month and grew 7.3% year-over-year. (Source: US Census) U.S. import prices decreased 0.5% in April, the first monthly decrease since a 0.4% decline in October 2011. Despite the April decline, import prices rose 0.5% over the past year. The price index for U.S. exports rose Import & Export Price Index 0.4% in April, following a 1.5% increase in the first quarter of 2012. (Source: Bureau of Labor Statistics)  During the first quarter, intermodal traffic was up for all container sizes. Year-to-date, 53-foot container Multimodal News Clips: traffic surged 15.9%, 40-footers were up 3.1%, and 20-footers increased by 2.8% year-over-year. (Source: Intermodal Association of North America |www.intermodal.org)  Compared to 4Q-2011, 4Q-2012 jobs in the transportation and warehousing sectors are expected to increase at a rate of 1.4% in the U.S. and should increase by 2.2% in Georgia. Logistics industry jobs in the state of Georgia will grow the most in Valdosta with 13.1% growth, and Columbus with 10% growth. (Source: Moody’s Analytics)  The U.S. Postal Service lost $3.2 billion in the fiscal second quarter, $1.1 billion more than the year before. The agency blamed much of the losses on having to pre-fund retiree health benefits, not being able to close thousands of post offices and mail process centers, and being restricted from cutting some 120,000 workers and Saturday delivery. While revenue related to shipping and packages grew more than 13% in the second quarter year-over-year, mailing service revenue fell 3%.  Package delivery company UPS reported a 4.3% increase in first quarter revenue to $13.1 billion from $12.6 billion a year earlier. The company’s operating profit rose 6.3% to $1.6 billion year-over-year on a 4.3% increase in packages delivered, to 1 billion packages. RAIL: Railroad bulk carload freight in April 2012 decreased 2% from March 2012. Freight traffic in April fell 5.5% from April 2011. The decrease in freight rail traffic was mainly due to another decline in coal shipments. U.S. Freight Rail Traffic Carloads excluding coal increased 3.2% over the previous year. (Source: AAR.org) (Report includes rail car-loadings by 19 different major commodity categories as well as intermodal units) Intermodal rail traffic in April 2012 was 3.6% higher than in April 2011 and 0.3% higher than March 2012 U.S. Intermodal Rail Traffic totals. Intermodal loadings have experienced year-over-year gains for 29 straight months. (Source: AAR.org) (Report includes rail car-loadings by 19 different major commodity categories as well as intermodal units) The index of average railroad fuel prices in February was 659.6, up 4.2% from the previous month and 5.8% Railroad Fuel Price Index higher year-over-year. (Source: AAR.org) (Average monthly price for gallons purchased by freight railroads; Includes federal excise taxes, transportation, and handling expenses) The number of freight cars in storage has increased to 307,957 (20.1% of the fleet) on May 1, up 8,633 cars Freight Cars in Storage from a month earlier. (Source: AAR.org) (A freight car is "in storage" if it has had a loaded revenue move since 2005, but not in the past 60 days. Decrease here = more demand) Railroad employment in March 2012 increased by 1,295 employees to 160,523 employees, the highest Class 1 Railroad Employment since December 2008. Total Class 1 rail employment in March 2012 was 3% higher than it was in March 2011. (Source: U.S. STB) 1
  • 2. MAY 2012 LOGISTICS MARKET SNAPSHOT Fueling Logistics Competitiveness Prepared: May 15, 2012 In April 2012, short line railroad shipments across North America fell 0.5% compared to the same month last Short Line Rail Traffic year. A sampling of about 408 small railroads in the U.S. and Canada loaded 510,679 railcars and intermodal units during the month of April. (Source: RMI RailConnect Index | rmiondemand.com)  CSX recorded a record first quarter profit for 2012 as earning rose 13.7% year-over-year to $449 million. Railroad News Clips: The company boosted first quarter revenue 6% to nearly $3 billion despite volume rising only 1%. Although coal traffic fell 14% year-over-year, the revenue per coal carload rose 10% in the same period.  Norfolk Southern also reported record profit for the first quarter, as the railroad’s strong pricing raised earnings 26% year-over-year to $410 million. The company’s revenue rose 6% to a record $2.8 billion.  Recent increases in auto sales have boosted rail traffic for CSX, Norfolk Southern, Kansas City Southern, and Union Pacific. During the last week in March, the Class I railroads hauled 17,283 carloads of automobiles, the most since June 2008. (Source: AAR.org) TRUCKING: Over-the-Road Trucked Shipments rose 0.1% in April following a 0.3% increase in March and a 0.7% increase Over-the-Road Trucked Shipments in February. Overall trucked shipments decreased 1.9% on a year-over-year basis. (Source: Ceridianindex.com) (From the Ceridian-UCLA Pulse of Commerce Index which is based on real-time fuel consumption data for over the road trucking) The ATA’s seasonally adjusted cargo index rose 0.2% in March. The for-hire truck tonnage index rose 2.7% Trucking Volume year-over-year. (Source: American Trucking Association | Trucking.org) The spot market for truckload freight in April rose 12% compared to the previous month, and was 12% Truckload Freight higher year-over-year. Truck capacity rose 3% for the month, and was up 13% year-over-year. (Source: TransCore Freight Index | www.transcorefreightsolutions.com) U.S. average diesel prices fell last week to $4.00 per gallon, the fifth straight week of decline. Last week’s Diesel Prices average diesel price was 5.3¢ lower than the previous week, and was 5.7¢ lower than the same week last year. The average price of diesel in the lower Atlantic states was $3.97 per gallon. (Source: U.S. DOE) (Reflects the costs and profits of the entire production and distribution chain.) The trucking industry added 1,800 jobs in April. The trucking workforce increased 0.14% from the previous Trucking Employment month and rose 3% over the previous year. (Source: U.S. DOL) Orders for heavy-duty Class 8 trucks in North America are expected to total 17,200 units in April 2012 after Truck Orders 20,025 units were ordered in March. April’s projected Class 8 orders are 122% lower year-over-year. (Source: ACT Research | actresearch.net) Surface transport-related trade between the U.S. and its NAFTA partners, Canada and Mexico, was up 17.4% th NAFTA Trade in February compared to the same month in 2011, reaching $78.1 billion. January was the 27 consecutive month of year-over-year increases. (Source: US DOT)  Con-way more than tripled its net profit in the first quarter, increasing earnings to $25.6 million as revenue rose 9.7% to $1.37 billion. The company’s LTL unit, Con-way freight increased its operating profit Trucking News Clips: 69.6% year-over-year to $831 million on a 1.5% growth in tonnage. Menlo Worldwide Logistics, Con-way’s logistics division increased operating profit by 42.2%. Con-way Truckload’s operating profit rose 48.9%.  Landstar System increased its net profit 30% to $26.8 million as truck transportation revenue rose 15.8% to $600.2 million in the first quarter. The truckload operator had the best first quarter in its history, increasing total revenue 13.5% to $649 million.  Old Dominion Freight Line announced a record revenue growth of 17.6% that pushed profit up 44% year- over-year in the first quarter to $31.1 million. The company saw revenue rise to $497.1 million on a 9.5% increase in shipments and higher pricing. AIR FREIGHT: Air Cargo Traffic Global air freight traffic in March rose 0.3% from one year ago and was up 2.2% from the previous month. North American air freight in March rose 2% year-over-year. (Source: IATA.org) (Global air freight covers international and domestic scheduled air traffic. North American traffic includes only domestic freight traffic.) In March, Hartsfield-Jackson Atlanta International Airport transported 56,718 metric tons of cargo, a 12% Atlanta Air Cargo Traffic increase over the previous month and a 2.24% decrease year-over-year. (Source: HJIA) 2
  • 3. MAY 2012 LOGISTICS MARKET SNAPSHOT Fueling Logistics Competitiveness Prepared: May 15, 2012 In March, average international air cargo prices rose 7.3% from the previous month. Average air freight rates Air Freight Price Index were up 2.8% year-over-year. (Source: Bureau of Labor Statistics) (The Drewry Air Freight Price Index is based on the average of rates ($US per kg) for cargoes of 100+kg to 1,000+kg cargoes from Shanghai to London, Moscow, Prague, New York, and Los Angeles.) Jet Fuel Prices As of May 4, 2012, the global average jet fuel price was $130 per barrel; down 5.4% from the previous month, and 0.7% lower year-over-year. (Source: IATA.org, platts.com) (The weekly index and price data shows the global average price paid at the refinery for aviation jet fuel)  Major Japanese international freight forwarder Kintetsu World Express reported that its group net profit rose a record 21.1% to $119.31 million in FY 2011, which ended on March 31. KWE also announced its Air Freight News Clips: group revenue and profit forecasts for FY2012. Operating revenue is expected to increase 13.5% to $3.75 billion, while operating profit should increase 8.5% to $187.5 million.  Nippon Express, Japan’s largest international freight forwarder, said that its net profit surged 215.5% in FY2011, to $336.88 million. The Tokyo-based company’s group operating profit rose 18.6% to $468.75 million. OCEAN FREIGHT: Import shipment volume, in TEUs, at U.S. ports increased 9.2% in April from the previous month and rose 7.2% over the previous year. YTD, April has shown the highest number of TEU imports, with over 1.52 Import Volumes million TEUs imported, and the second-largest number of shipments, with 756,000 processed. U.S. imports are expected to show further increases during the summer months with spikes in May, July, and August. (Source: Zepol Corporation | zepol.com) th The May 4 SCFI comprehensive reading was $1,501.46 per FEU; up 0.9% from the previous week, and Shanghai Containerized 40.5% higher year-over-year. The spot rate for shipments to the U.S. East Coast was $3,579 per FEU, up Freight Index 0.6% from the previous year. (Source: Shanghai Shipping Exchange | www1.chineseshipping.com.cn/en) (The Shanghai Containerized Freight Index is a weekly reported average export spot rate from Shanghai for 15 different trade lanes.) The Baltic Dry Index increased 23.7% in April, ending at 1,155. The BDI has fallen 1.5% for the first half of Ocean Bulk Freight Rates May. (Source: www.bloomberg.com/quote/BDIY:IND) (The Baltic Dry Index is an index that tracks and averages worldwide international shipping prices of various dry bulk cargoes.) Average bunker fuel price fell 1.4% to end the month of April at $885.74/MT. By mid-May, bunker fuel prices Bunker Fuel Price Index had fallen 3.4% to $855.28/MT. (Source: bunkerindex.com) (The Bunker Index is the average global bunker fuel price from individual ports; measure in $US per MT or megaton) In March, the Georgia Ports Authority marked its highest monthly numbers ever, handling 2.37 million tons of freight, including 2.03 million tons of containerized cargo. Container traffic was 9.2% higher year-over- Port of Savannah year, totaling 259,796 TEUs. 203 vessels called on the Port of Savannah in March, an increase of 10.9% over February’s vessel calls. (Source: GPA) In March, the Port of Brunswick handled 57,001 auto and machinery units, an increase of 30% from the Port of Brunswick previous year and a 79% increase over March 2010. (Source: GPA)  Last month, an additional $46.7 million was approved for the Savannah Harbor deepening project. The Ocean Freight Business News: new funds were passed by the General Assembly as a part of the Governor’s FY 2013 budget request, bringing the total of dedicated state dollars to $181.1 million.  Import volume through major U.S. container ports is expected to increase 3.4% this year over 2011 to $2.53 trillion. In March, the latest month for which numbers are available, containerized imports at U.S. ports were up 14.1% from February and were 8.5% higher year-over-year. (Source: NRF/Hackett Associates)  In 1956, the cost of shipping goods by ocean represented about 15% of their value; today it’s less than 1% on average. Freight rates today are less than they were 20 years ago, while vessel, fuel, terminal, and other costs have risen significantly.  Norway’s Wilhelmsen boosted first quarter operating profit by 84% from a year ago to $106 million, driven by record earnings and revenue at its global car carrier and rolling cargo fleet. At the end of March, the operating companies in the group controlled 137 ships, up from 128 a year ago, accounting for 23% of the global market capacity.  The active container ship fleet has soured to a record 15 million TEUs, driven by deliveries of new vessels and a sharp reduction in the number of laid-up ships. Sixty-two new container ships with a total capacity of 455,000 TEUs have been delivered since the beginning of the year, 23 of which exceeded 10,000 TEUs each. 3
  • 4. MAY 2012 LOGISTICS MARKET SNAPSHOT Fueling Logistics Competitiveness Prepared: May 15, 2012 WAREHOUSING & DISTRIBUTION: The U.S. average industrial vacancy rate was 9.6% during Q1 2012, down from 10% in the previous quarter. Industrial Vacancy Overall vacancy was 10.4% in Atlanta and 12.5% in Savannah during the first quarter. (Source: Cushman & Wakefield) In Q1 2012, warehouse and distribution rental rates in the US averaged $4.27 per square foot. Rental rates Warehouse Rent Rates for warehouse space averaged $3.40/square foot in Atlanta and $3.71/square foot in Savannah. (Source: Cushman & Wakefield) Net absorption in the US during Q1 2012 totaled +23.5 million square feet. Absorption during the 1Q totaled Industrial Absorption nearly +620,000 square feet in Atlanta. (Source: Cushman & Wakefield) (Absorption is the net change in occupied space between two points in time. Positive absorption means that previously unoccupied space is being occupied.) The National PMI rose 1.4 points to 54.8 in April 2012. The April PMI has indicated expansion in the rd manufacturing sector for the 33 consecutive month. New orders increased 3.7 points to 58.2 and Purchasing Managers Index production rose 2.7 points to 61.0. (Source: Institute for Supply Management) (The PMI combines data on new orders, inventory, production, supplier deliveries, and employment. A reading above 50 indicates that the manufacturing economy is generally expanding.) Georgia’s PMI rose 3.1 points to 63.8 in April. New orders in Georgia increased 4.4 points to 72.9 and Purchasing Managers Index production was up 6.3 points to 72.9. Georgia’s PMI of 63.8 outperformed the national PMI by 9 points and in Georgia has remained above 60 for the third consecutive month. (Source: Kennesaw State University) (The PMI combines data on new orders, inventory, production, supplier deliveries, and employment. A reading above 50 indicates that the manufacturing economy is generally expanding.)  Baxter International will locate a new bio-pharmaceutical manufacturing facility near Interstate 20 east of Atlanta as well as plasma centers throughout Georgia that will employ approximately 1,500 people across W&D Business News: the state. Total investment by the company will exceed $1 billion. Baxter’s new Georgia facility will manufacture plasma-based therapies that treat chronic and life-threatening illnesses. U.S. MARKET: The U.S. GDP increased 2.2% in the first quarter of 2012 according to the preliminary estimate released by Gross Domestic Product the Bureau of Economic Analysis. (Source: US BEA) The U.S. trade deficit increased by 14.1% in March to $51.8 billion. Exports increased 2.9 to $186.8 billion U.S. Trade Deficit and imports increased 5.2% to $238.6 billion. U.S. imports and exports in March were the highest on record. (Source: US DOC & Census Bureau) The Consumer Confidence Index decreased to 69.2 in April 2012 from 70.2 in March 2012. Consumer Confidence (Source: The Conference Board) (The consumer confidence index is based on a monthly survey of 5,000 U.S. households. It is designed to gauge the financial health, spending power, and confidence of the average U.S. consumer.) The unemployment rate in America fell to 8.1% in April 2012, the lowest level since January 2009. Unemployment Rate Approximately 115,000 net new jobs were created in April, down from 154,000 new jobs created in March. (Source: US DOL) The Leading Economic Index for the U.S. increased 0.3% in March to 95.7 (2004=100), following a 0.7% Leading Economic Index increase in February and a 0.2% increase in January. (Source: Conference Board) (The LEI is a composite of 10 economic indicators that together create an analytic system designed to signal peaks and troughs in the business cycle. The LEI reveals patterns in economic data in a clearer and more convincing manner than any individual component alone.) Retail and food service sales rose in April to $408 billion, up 0.1% from the previous month, and up 6.4% Retail Sales from April 2011. Non-store retailer sales were up 11% from last year. (Source: US Census) Total combined sales and manufacturing shipments totaled nearly $1.24 Trillion in March 2012, up 0.6% Manufacturing & Trade Sales from February and up 5.8% from the previous year. (Source: US Census) Total value of inventory on hand is estimated at $1.58 Trillion in March 2012, up 0.3% from February and up Manufacturing & Trade Inventory 6.6% from March 2011. (Source: US Census) In April, housing starts increased 2.6% to an annual rate of 717,000 units, which is 30% higher than April Housing Starts 2011. Building permits (an indicator of future housing starts) fell 7.0% to an annual rate of 715,000, but still up 24% over April 2011. (Source: U.S. DOC) The consumer price index for all urban consumers increased 0.3% in April over the previous month. Over the last 12 months, the all items index increased 2.3%. The producer price index for finished goods fell 0.2% in Consumer & Producer Price Index April from the previous month. Prices for finished goods increased 1.9% over the previous year. (Source: US Bureau of Labor Statistics) 4
  • 5. MAY 2012 LOGISTICS MARKET SNAPSHOT Fueling Logistics Competitiveness Prepared: May 15, 2012 To sign-up to receive these free monthly snapshots, visit: snapshot.georgialogistics.org For more information about the Logistics Market Snapshot or the many other resources and activities of the Georgia Center of Innovation for Logistics please contact: Page Siplon, Executive Director – psiplon@georgia.org – 912.966.7867 5