
Recomendados
Mais conteúdo relacionado
Mais procurados
Mais procurados (20)
Destaque
Último
Último (20)
OSDGB2
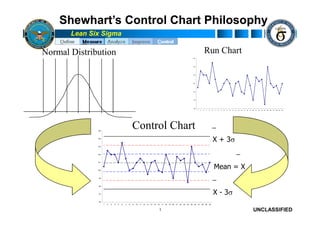
- 1. Shewhart’s Control Chart Philosophy Lean Six Sigma Normal Distribution Run Chart 104 103 102 101 100 99 98 1 2 3 4 5 6 7 8 9 10 11 12 13 14 15 16 17 18 19 20 21 22 23 24 25 26 27 28 29 30 Control Chart _ 105 104 X + 3s 103 102 _ Mean = X 101 100 99 _ 98 97 X - 3s 96 1 2 3 4 5 6 7 8 9 10 11 12 13 14 15 16 17 18 19 20 21 22 23 24 25 26 27 28 29 30 1 UNCLASSIFIED
- 2. Run Chart Lean Six Sigma Shows how the process varies over time Shifts, trends, intermittent problems and cyclic patterns can be detected Vertical-axis is the unit of measure; horizontal-axis is time A baseline average or current average line can be used as a point-of-reference to detect process changes When the Run Chart p-values are greater than alpha (e.g. .05), the characteristic of interest is not statistically significant. 2 UNCLASSIFIED
- 3. Run Chart Procedure Lean Six Sigma Gather data over time in sequence Create a graph with a vertical line and a horizontal line The vertical line should cover the full range of measurements The horizontal line should cover the time period which the data was collected Add a baseline (using prior data) or average (current data) line to indicate process location (mean) Plot the data on the graph connecting the points Interpret the chart Look for trends, patterns and/or unusual data points 3 UNCLASSIFIED
- 4. Run Chart Lean Six Sigma Go to the Stat menu: TASK: Create Run Chart for Cycle Time Go to Quality Tools Select Cycle Time as Single column box Select Run Chart Set Subgroup Size to 1 Click OK Alternate to Time Series Plots 4 UNCLASSIFIED
- 5. Run Chart Lean Six Sigma To create a run chart in EXCEL, highlight the data (sorted in P-Values less time order than the α-level sequence) then (.05) indicate select INSERT, statistical Line Chart, 2 significance. lines 5 UNCLASSIFIED
- 6. Exercise: Exercise: Run Chart Lean Six Sigma Using the data from Round 1 - create a Run Chart of your simulation data cycle time Results? 10 minutes 6 UNCLASSIFIED
- 7. Two Types of Variation Lean Six Sigma Two types of variation are visible in a Control Chart: Special Cause Common Cause Something different happening Always present to some at a certain time and place degree in the process 7 UNCLASSIFIED
- 8. Control Charts Lean Six Sigma Region of Non-Random Variation Upper Control Limit Process Average Lower Control Region of Non-Random Variation Limit Data Over Time 8 UNCLASSIFIED
- 9. Control Chart Lean Six Sigma UCL= 14380 LCL= 3351 UCL= 6775 LCL= 0 9 UNCLASSIFIED
- 10. Control Charts Lean Six Sigma Definition: A Time Series plot that shows control limits at both +3σ and -3σ from the mean Go back to the catapult data worksheet Go to Stat menu > Control Charts > Variables Charts for Individuals > Individuals Click inside the Variables dialog box > select T1-Distance 10 UNCLASSIFIED
- 11. Control Charts Lean Six Sigma RESULTS: I Chart of T1-Distance 170 UCL=167.20 160 150 Individual Value 140 _ X=133.75 130 120 110 100 LCL=100.30 1 3 5 7 9 11 13 15 17 19 Observation 11 UNCLASSIFIED
- 12. Control Charts Lean Six Sigma TASK: Remake plot with separate control limits for each team member: On the toolbar click the icon “Bring up last dialog box” (#9) or use “Control-E” Click on I Chart Options > Go to Stages tab Click on the Define Stages box > select Team Member Click OK twice 12 UNCLASSIFIED
- 13. Control Charts Lean Six Sigma RESULTS: I Chart of T1-Distance by Team Member 1 2 3 4 200 UCL=189.6 180 Individual Value 160 _ 140 X=140.4 120 100 LCL=91.2 1 3 5 7 9 11 13 15 17 19 Observation 13 UNCLASSIFIED
- 14. Control Charts Lean Six Sigma Control charts are simple run charts with Zone A 105 statistically generated limits! UCL 104 Zone B 103 Zone C 102 101 Center Line 100 Zone C 99 Zone B LCL 98 97 Zone A 96 1 2 3 4 5 6 7 8 9 10 11 12 13 14 15 16 17 18 19 20 21 22 23 24 25 26 27 28 29 30 14 UNCLASSIFIED
- 15. Out of Control Conditions: Extreme Points Lean Six Sigma Out of control conditions are frequently detected by the extreme point condition 2 Out of 3 Points on same side Extreme Point (1 Point Beyond UCL of average in Zone A or Beyond or LCL) UCL UCL A B C CL X C B A LCL LCL Note that the out of control point is always circled 15 UNCLASSIFIED
- 16. Out of Control Conditions: Extreme Points Lean Six Sigma 4 Out of 5 Points on the same side of the average in Zone B or Beyond UCL A B C X C B A LCL 16 UNCLASSIFIED
- 17. Out of Control Conditions: Trends & Shifts Lean Six Sigma Trend (6 Points in a Row Process Shift (9 Points in a Steadily Increasing or Row on one side of the Decreasing) average) UCL UCL CL CL LCL LCL 17 UNCLASSIFIED
- 18. Out of Control Conditions: Oscillation Lean Six Sigma 15 Successive Points Alternating Oscillation Up and Down in Zone C (above (14 Successive Points and below the average) Alternating Up and Down) UCL UCL A B C CL X C B A LCL LCL Possible Cause(s): Overcontrol of the process, e.g., adjusting the machine after almost every piece. Two different processes occurring simultaneously, two different machines, two different operators, etc. 18 UNCLASSIFIED
- 19. Control Charts Lean Six Sigma For Variable data, three basic pairs of charts exist: 1. I,MR: Individual and Moving Range 2. Xbar,R: Average and Range 3. Xbar,S: Average and Standard Deviation If the Range/Moving Range chart is in control, you can then use the Xbar chart. For Attributes data, four basic charts exist: 1. nP: Number chart Control Charts can be 2. P: Proportions chart produced in EXCEL using 3. C: Count chart Control Chart templates posted to DEPMS. 4. U: Rate 19 UNCLASSIFIED
- 20. Continuous Data Control Charts Lean Six Sigma Measurement (Continuous/Variable Data) Subgroup Size of 1 Subgroup Size 3-9 Subgroup Size > 9 I-MR Xbar-R Xbar-S •Process with few data points •Monitors repetitive Similar to Xbar-R Chart •Sampling is very expensive processes Larger sample sizes •Sampling is by destructive testing •Practictioners frequently •Building data to begin another choose subgroups of 5 chart type Stat > Control Charts > Variable Stat > Control Charts > Variable Charts for Subgroups Charts for Individuals > I-MR, Xbar-R, Enter variable Xbar-S , Enter variable Enter variable and subgroup size and subgroup size 20 UNCLASSIFIED
- 21. What do you do first? Lean Six Sigma Since Moving Range Chart is out of control, investigate these out of control points first to determine cause. 21 UNCLASSIFIED
- 22. Attribute Control Charts Lean Six Sigma Yes/No Are the Data Count Yes/No or count? Is the area Is sample of opportunity size constant? constant from sample to sample? yes no yes no Choose Choose np chart or p chart p chart Choose c chart or u chart Choose 5 n p 50 5 n p 50 u chart 5 c 50 and and or 5 n u 50 5 n u 50 5 n ( 1 p ) 50 5 n ( 1 p ) 50 MINITAB: Stat > Control Charts > Attribute Charts > Select Type of Chart Enter variable of interest and subgroup size, Click OK 22 UNCLASSIFIED
- 23. Exercise: Exercise: Control Chart Lean Six Sigma What type of Control Chart should you use to assess the Round 1 simulation ? Using the data from Round 1 - create a Control Chart of your simulation data cycle time Results? 10 minutes 23 UNCLASSIFIED
- 24. Takeaways Lean Six Sigma When a process is “in control” This implies a stable, predictable amount of variation (common cause variation) This does not mean a “good” or desirable amount of variation When a process is “out-of-control” This implies an unstable, unpredictable amount of variation It is subject to both common AND special causes of variation A process can be in statistical control and not capable of consistently producing good output within specification limit. 24 UNCLASSIFIED
- 25. Process Capability Lean Six Sigma Once a process is in statistical control, you want to determine if it is Capable -- Is it meeting specification limits and producing “good” or satisfactory services or deliverables? You can determine capability by computing the # of Defects per Unit, Defects Per Opportunity and Defects Per Million Opportunities, and Rolled Throughput Yield. You can also determine capability by comparing the width of the Process Variation (Voice of the Process) with the width of the specification limits (Voice of the Customer). Measure the # of standard deviations that fit between the Process mean and the closest specification limit to derive the sigma level. 25 UNCLASSIFIED
- 26. Exercise 1A Lean Six Sigma Purchase Requests Processed Navy Army What can we Mon 89 91 say about the Tue 70 102 performance Wed 100 103 of these two Services with Thur 121 105 respect to their Fri 120 99 means? X 26 UNCLASSIFIED
- 27. Exercise 1A Lean Six Sigma Purchase Requests Processed Navy Army The Services Mon 89 91 are equal in Tue 70 102 performance, but is there Wed 100 103 more to the Thur 121 105 story? Fri 120 99 X 100 100 27 UNCLASSIFIED
- 28. Exercise 1B Lean Six Sigma Purchase Requests Processed What can we say Navy Army about the Mon 89 91 performance variation Tue 70 102 of these two Wed 100 103 Services? Thur 121 105 Fri 120 99 28 UNCLASSIFIED
- 29. Exercise 1B Lean Six Sigma Purchase Requests Processed Navy Army Navy is much more Mon 89 91 varied. What are Tue 70 102 the implications? Wed 100 103 Thur 121 105 Fri 120 99 21.6 5.5 29 UNCLASSIFIED
- 30. Measures of Performance Lean Six Sigma If we know the process mean and the process sigma, then we can describe the performance of the process. But: How do we know if the process performance is good or bad? Who should determine if performance is good enough? ? 30 UNCLASSIFIED
- 31. Customer Specifications Lean Six Sigma • The specification limits represent the parameters of LSL Target USL performance desired by the customer. • The Upper Spec Limit (USL) & Lower Spec Limit (LSL) represent the level of tolerance around this desired target. • Together, they represent what the customer wants! Not what the process does. 31 UNCLASSIFIED
- 32. Sigma Level Lean Six Sigma Sigma Level (or Z-value): the number of Sigma between the process mean and the nearest specification limit If we know: The Mean of the process + The s of the process + The Specifications set by Mean Target the customer -3 -2 -1 1 2 3 4 5 Then: We can determine the Sigma Level of the process 32 UNCLASSIFIED
- 33. A 3s Process 3s Lean Six Sigma -6s -5s -4s -3s -2s -1s Mean 1s 2s 3s 4s 5s 6s LSL Mean USL 33 UNCLASSIFIED
- 34. A 6s Process 6s Lean Six Sigma -6s -5s -4s -3s -2s -1s Mean 1s 2s 3s 4s 5s 6s LSL Mean USL 34 UNCLASSIFIED
- 35. Sigma Level Example Lean Six Sigma What is the sigma level of this process? -3 -2 -1 1 2 3 4 5 6 7 8 9 LSL Mean USL 35 UNCLASSIFIED
- 36. Sigma Level Example Lean Six Sigma -3 -2 -1 1 2 3 4 5 6 7 8 9 LSL Mean USL USL - Mean = 9 36 UNCLASSIFIED
- 37. Sigma Level Example Lean Six Sigma -3 -2 -1 1 2 3 4 5 6 7 8 9 LSL Mean USL Mean - LSL = 3 37 UNCLASSIFIED
- 38. Sigma Level Example Lean Six Sigma -3 -2 -1 1 2 3 4 5 6 7 8 9 LSL Mean USL • The “Process Sigma” is: • The lesser of (USL-Mean) & (Mean-LSL) stated in units of s 38 UNCLASSIFIED
- 39. Sigma Level Formula Lean Six Sigma The Sigma level of a process is the lesser of: or USL X X LSL 39 UNCLASSIFIED
- 40. Measures of Performance Lean Six Sigma Recall the Army and Navy processing rates Purchase Requests Processed Navy Army Assume: Mon 89 91 o LSL = 70 documents per day to keep up with incoming rate Tue 70 102 o USL = 130 documents per day Wed 100 103 To keep from “overfeeding” the processor which would result in Thur 121 105 a higher error rate Fri 120 99 What are the sigma levels for 21.6 5.5 each of these? What are the implications? 40 UNCLASSIFIED
- 41. Measures of Performance Lean Six Sigma NAVY ARMY Upper Sigma Level: Upper Sigma Level: USL X 130 100 USL X 130 100 1.4 5 .5 21.6 5.5 Lower Sigma Level: Lower Sigma Level: X LSL 100 70 X LSL 100 70 1 .4 5.5 21.6 5.5 Sigma Level: 1.4 Sigma Level: 5.5 41 UNCLASSIFIED
- 42. Which would you prefer? Lean Six Sigma -6s -5s -4s -3s -2s -1s Mean 1s 2s 3s 4s 5s 6s NAVY The target is missed more than 15% of the time LSL Mean USL -6s -5s -4s -3s -2s -1s Mean 1s 2s 3s 4s 5s 6s ARMY The target is usually never missed? 42 LSL Mean USL UNCLASSIFIED
- 43. Different Sigma Process Levels Lean Six Sigma 3s Process -6s-5s-4s-3s-2s-1s 1s 2s 3s 4s 5s 6s LSL Mean USL 6s Process -6s-5s-4s-3s-2s-1s 1s 2s 3s 4s 5s 6s LSL Mean USL 43 UNCLASSIFIED
- 44. Importance of Reducing Variation Lean Six Sigma • To increase a process sigma level, you have to decrease variation. Too early Too late Too early Too late Defects Defects Reduce variation Delivery Time Delivery Time Spread of variation Spread of variation too wide compared narrow compared to to specifications specifications • Less variation provides: Greater reliability in the process Less waste and rework, which lowers costs Products and services that perform better and last longer Happier customers 44 UNCLASSIFIED
- 45. Improvement- Improvement-Focused Scale Lean Six Sigma DPMO s Increase in Sigma 308,537 2 requires exponential 66,807 3 defect reduction 6,210 4 233 5 3.4 6 Defects per Process Million Capability Opportunities “trim the fat” (distribution shifted ±1.5s) 45 UNCLASSIFIED
- 46. Additional Metrics of Six Sigma Lean Six Sigma In addition to Sigma Level, four other performance metrics are of interest: Defects Per Unit (DPU) Process Capability Defects Per Million Opportunities (DPMO) Rolled Throughput Yield If you know one… you can determine the others Suduko 46 UNCLASSIFIED
- 47. Defectives & Defects Lean Six Sigma A defective unit is that which fails to meet customer requirements or standards Late order, incorrect invoice, short-count, etc. A defect is any reason for such a failure Not filed correctly, incorrect line item, transposed numbers, etc. A defective unit can have more than one defect 47 UNCLASSIFIED
- 48. Process Capability - DPU Lean Six Sigma Defects Per Unit (DPU) – the average number of defects, of all types, over the total number of units produced Unit is the item being processed o (order, invoice, form, plate, etc.) DPU = Total Number Defects Total Number Units Processed 48 UNCLASSIFIED
- 49. DPU Example Lean Six Sigma In one month, 220 reports were sampled after being sent to customers Among the 220 reports, 344 line items were found incorrect (defects) Unit = Report DPU = 344 incorrect line items / 220 Reports = 1.56 49 UNCLASSIFIED
- 50. Process Capability – DPO, DPMO, SL Lean Six Sigma If you were checking 4 fields on each report, and each field DPO =Total Number Defects represented an opportunity for a Total Number Opportunities for Defect defect, then the Defects Per Opportunity (DPO) would be 344 / (220 * 4) = 344/880= .39 Convert DPO to Defects per Million Opportunities by DPMO = DPO * 1,000,000 multiplying DPO by a million. DPMO = 390,000 Convert DPMO to Sigma Level SL = NORMSINV(1-(DPMO/1000000))+1.5 (SL) using chart or formula or Sigma Level = 1.78 SL= NORMSINV(1 – DPO)+1.5 50 UNCLASSIFIED
- 51. Process Capability - RTY Lean Six Sigma Rolled Throughput Yield Process A has 4 steps: (RTY) is the probability that Step 1, 100 units enter, 10 are a single unit can pass scrapped and 5 are reworked to get through a series of process 90. Yield = (100- (10+5)) / 100 = .85 steps free of defects. Step 2, 90 units in from Step 1, 10 scrapped and 7 are reworked to get 5 rework 80. (90-(10+7))/90 = .81 100 Step 1 Step 3, 80 units in from Step 2, 5 7 rework scrapped and 3 reworked to get 75. 90 Step 2 (80-(5+3))/80 = .9 3 rework Step 4, 75 units in, 5 scrapped and 80 Step 3 10 rework 10 reworked to get 70. (75-(5+10)/75 10 10 = .8 5 75 Step 4 RTY = .85 * .81 * .9 * .8 = .49572 5 SCRAP 70 = 50% yield 51 UNCLASSIFIED
- 52. Process Capability Lean Six Sigma - Example - Process Capability of Delivery Time P otential (Within) C apability 266 data points Cp 1.16 LSL Target USL collected between 11/1/04 C PL 2.22 C PU 0.10 thru 11/30/04 Within C pk 0.10 Ov erall Mean 29 days, St. Dev. C C pk 1.16 2.9 days, CP is 1.16 O v erall C apability indicating process needs Pp 1.24 PPL 2.37 centering to the LSL of 10 PPU 0.11 and USL of 30 days. Cpk P pk 0.11 is .1 indicating that the C pm 0.35 process is exceeding the P rocess Data LS L 10 USL. Target 20 With an overall PPM of USL 30 S ample M ean 29.1203 371,895 defects per S ample N 266 million opportunity, the S tDev (Within) 2.87033 current process has a S tDev (O v erall) 2.69154 Sigma Quality Level of 1.8 12 16 20 24 28 32 36 or a 62% yield O bserv ed P erformance E xp. Within P erformance E xp. O v erall P erformance P P M < LS L 0.00 PPM < LS L 0.00 P P M < LS L 0.00 P P M > U S L 281954.89 PPM > U S L 379619.67 P P M > U S L 371895.18 P P M Total 281954.89 PPM Total 379619.67 P P M Total 371895.18 52 Required Deliverable UNCLASSIFIED
- 53. Class Exercise Lean Six Sigma What measure(s) would you use to compute process capability for the simulation? How capable is Round 1 Simulation? 10 minutes 53 UNCLASSIFIED
- 54. Process Map or Flowchart Lean Six Sigma A Pictorial Representation of a Process Identifies Inputs (X) and Outputs (Y) Identifies Current Data Collection Points Categorizes Inputs (X) Defines Process Boundaries Identifies customers and suppliers Points out discrepancies in the process Points out inefficiencies in the process Determines Value-Added and Non-Value-Added Steps Initiates standardization of procedures 54 UNCLASSIFIED
- 55. Why Map the Current State? Lean Six Sigma To show process simply and visually To clarify organization’s understanding of how the current process actually operates To create baseline for future improvements to be made and measured A current state map is a pictorial view showing how material and information currently flow. 55 UNCLASSIFIED
- 56. Process Mapping - Basic Steps Lean Six Sigma 1: SIPOC 2: BOUNDARIES See the 3: VOICE OF THE CUSTOMER Process … 4: GATHER APPROPIATE INFORMATION 5: WALK THE PROCESS See the 6: CREATE CURRENT STATE MAP Waste … 7: SPAGHETTI MAP / CIRCLE DIAGRAM 8: VALUE ANALYSIS Visualize the Perfect 9: CREATE IDEAL STATE MAP State … 10: DEVELOP FUTURE STATE MAP Lead the Way 11: DEVELOP ACTION PLAN toward it … 12: IMPLEMENT THE PLAN Photo source: Raytheon 56 UNCLASSIFIED
- 57. Process Map Procedure Lean Six Sigma Symbols to know: Process Start/End Decision Flow Step Determine the start and finish of the process you are charting Define how the process actually works, step by step, in detail Use observation, recorders, etc. Add inputs and outputs 57 UNCLASSIFIED
- 58. Simple Process Map Lean Six Sigma • Describes the high-level steps followed day in and day out Start Step 1 Decision Step 2 Yes No End 58 UNCLASSIFIED
- 59. Always Keep in Mind… Lean Six Sigma There are usually 3 versions of each Process Map What you Believe it is... What it Actually is... What you Want it to be... 59 UNCLASSIFIED
- 60. SIPOC Lean Six Sigma SIPOC: The starting point for any process map S I P O C Suppliers Inputs Process Outputs Customers Process Map 60 UNCLASSIFIED
- 61. Walk the Process Lean Six Sigma Visualize yourself in the place of the product / information Walk the process backwards (from last step to first) OR forwards (from first step to last) Interview personnel who touch the process (look for problems that may be occurring) Measure people and/or product travel distances Look for constraints in the system (shared resources) Look for 8 types of wastes 61 UNCLASSIFIED
- 62. Creating a Useful Process Map Lean Six Sigma Step 1: At an actionable level, define the boundaries of the process you need to improve Step 2: Identify all operations needed in the production of a product or service. At each step include: Cycle time Quality levels Step 3: Identify each operation above as value-added or non-value- added. A value-added operation “transforms the product in a way meaningful to the customer” Step 4: List both internal and external Ys at each process step (continued) 62 UNCLASSIFIED
- 63. Creating a Useful Process Map Lean Six Sigma Step 5: List both internal and external Xs at each process step Step 6: Classify all Xs as one or more of the following: Controllable (C): Inputs you can adjust or control while the process is running o Examples: Speed, feed rate, temperature, pressure Standard Operating Procedures (SOPs): Common sense things you always do because they make sense o Just because it is in a procedure --does not mean it is an SOP o Procedures can be used to specify set-points of controllable parameters o Examples: Cleaning, safety, loading components, setup Noise (N): Things you cannot control or do not want to control (too expensive or too difficult) o Examples: Ambient temperature, humidity, operator (continued) 63 UNCLASSIFIED
- 64. Creating a Useful Process Map Lean Six Sigma Step 7: Document any known operating specification for each input and output What are the operational requirements of the process? Examples: Obligation Rate 8% per month EOD (End of Day) +/- 1 day Recon Imagery Resolution +/- 1 meter Step 8: Clearly identify all process data collection points What are the DPUs of the various process steps? What is the Rolled Throughput Yield (RTY) of the Process? RTY = FPY Step 1 x FPY Step 2 x FPY Step 3 …. x FPY Step n 64 UNCLASSIFIED
- 65. Mapping Tips Lean Six Sigma Use Post-it® notes on butcher paper. Place top of process boxes just below the middle of the page. Leave enough room between process boxes to show inventory. Decide whether to count all parts or just a sample part – make the assumptions up front. Draw only one to three main suppliers/supplied items. Title and date map. 65 UNCLASSIFIED
- 66. Current State Maps Lean Six Sigma Value Stream Map Circle Diagram Spaghetti Diagram Main Material Tech W/C 51A/B CRANE ISEA Technician 51E SUPPLY Paint PAINT C.O. Booth BOOTH N OFFICE DAAS D TOOL I NDI NDI ROOM Office Strip DEPT Tank SNAP AWP/RMS HEAD STRIP ROOM STOCK SK POINT SAFETY BO1 DOCKSIDE 520 PEO SUPV P.C.PC PC IWS2 51D 66 UNCLASSIFIED
- 67. Data Blocks Lean Six Sigma Place a data block under each step in the process. step number: Process Description: Demand: How many items the customer wants per ___ Trigger: What tells you to begin this step? Done: What tells you the step is finished? Flow Time Entire time it takes to complete step? (8 hours @ day & FLOW TIME) Touch TIme: Meets all three Criteria for VA People: Number of people required to complete the step? Shifts: How many places this step is performed No. Defects: Number of defects per unit time (% defective may also be accepted) WIP: How many items have been started but not completed WIQ: How many items waiting to start Use standard method for all data blocks. This could be Personnel Distance Traveled: Product travel. or Changeover: Time between last step of current job to first step of next job Flow Stoppers: Problems that keep you from doing your job 67 UNCLASSIFIED
- 68. Exercise Lean Six Sigma Draw a current process map based upon Round 1 simulation. Annotate data blocks 18 minutes 68 UNCLASSIFIED
- 69. Measure Tollgate Questions Lean Six Sigma Has an overarching Value Stream Map been completed with data to better understand the process and problem, and show where root causes might reside? Has the team conducted a value-added and cycle time analysis, identifying areas where time and resources are devoted to tasks not critical to the customer? Has the team identified specific input, process and output measures needing to be collected for both effectiveness and efficiency categories? Has the team developed clear, unambiguous operational definitions for each measurement and tested them with others to ensure clarity and consistency? Has a clear, reasonable choice been made between gathering new data or taking advantage of existing data already collected by the organization? Has an appropriate sample size and sampling frequency been established to ensure valid representation of the process we are measuring? Has the measurement system been checked for repeatability and reproducibility, potentially including training data collectors? Has the team developed and tested data collection forms or check sheets? Has baseline performance and process capability been established? How large is the gap between current performance and customer requirements? 69 UNCLASSIFIED
- 70. What We Have Covered Lean Six Sigma Data – types, collection plans Data measures – mean, median, standard deviation Minitab familiarization Sampling – reasons, types, computing sample size Measurement System Analysis - purpose, components Normality of data Run Charts Control Charts Process Capability Process Mapping 70 UNCLASSIFIED
- 71. Lean Six Sigma Define Measure Analyze Improve Analyze Control 71 UNCLASSIFIED
- 72. Learning Objectives Lean Six Sigma Learn and apply analytical and graphical techniques for identifying the potential root causes of a problem 72 UNCLASSIFIED
- 73. Searching for Xs Lean Six Sigma The primary focus of the analyze phase is to separate the Critical Few from the Trivial Many In short: What is driving our deficiency or variation? All Possible Xs Probable Xs 73 UNCLASSIFIED
- 74. Root Cause Lean Six Sigma Why find the root cause of a defect? Eliminate the root cause, not the symptom Problem doesn't show up again Corrective action must: Ensure that the error is physically prevented from occurring again Prevents a defect loop 74 UNCLASSIFIED
- 75. Root Cause Analysis Lean Six Sigma Cause and Effect may be separated by Time, Logical Flow and Location. A Cause/Effect relationship is one-way. The Effect is not the Cause! Cause Effect Time - Logical Flow - Location 75 UNCLASSIFIED
- 76. Root Cause Analysis Lean Six Sigma EFFECT A single Cause can have multiple Effects. CAUSE EFFECT EFFECT CAUSE CAUSE EFFECT A single Effect can have multiple Causes. CAUSE 76 UNCLASSIFIED
- 77. Tools for Root Cause Lean Six Sigma Process: Five Whys Fishbone / Ishakawa / Cause and Effect Diagram XY Matrix Failure Modes and Effects Analysis (FMEA) Graphical: Pareto Charts Scatter Diagram Box Plots 77 UNCLASSIFIED
- 78. 5 Whys Lean Six Sigma Technique to get from symptom to root cause Asking “Why?” as many as five times to get to root cause By identifying root cause we can take action to prevent recurrence 78 UNCLASSIFIED
- 79. Root Cause Analysis – 5 Why’s Lean Six Sigma Why? Why? Root Cause Why? EFFECT CAUSE Why? EFFECT CAUSE Why? EFFECT CAUSE EFFECT CAUSE EFFECT CAUSE 79 UNCLASSIFIED
- 80. Root Cause Lean Six Sigma Granite on the Jefferson Memorial is deteriorating. Why? Use of harsh chemicals Why? To clean pigeon droppings Why? Lots of spiders at monument Why? Lots of gnats to eat Why? Gnats are attracted to the light at dusk Solution: Turn on the lights at a iSixSigma.com later time. 80 UNCLASSIFIED
- 81. 5 Whys: Late UFRs Lean Six Sigma Late BRC Charts WHY? Incomplete Late UFRs Software UFRs problem WHY? WHY? Handling Written with Did Not Damage Bug Did Not Late Receipt Follow Read from Field Directions Directions WHY? WHY? WHY? WHY? Untested Not Written Typo Operational Ambitious program Clearly WHY? Mission Schedule No Format WHY? Packaging Error No One Assigned to WHY? Develop 81 UNCLASSIFIED
- 82. Fishbone Diagram Procedure Lean Six Sigma Write the problem (effect or “Y”) in a box on the right side with an arrow entering from the left Generate a list of causes that potentially create the problem Organize the causes into categories Place causes on the fishbone by category Breakdown the causes into smaller components by asking “Why?” Add to fishbone Examine for patterns, root causes, data needs 82 UNCLASSIFIED
- 83. Cause and Effect Diagram Lean Six Sigma Look for causes Repeat for Each Main Cause that appear Suggested Causes: repeatedly across major cause Man categories. Main Cause I Method Machine Main Cause II Material Measurement Mother Nature B C Problem A A Main Cause III Main Cause V Main Cause IV 83 UNCLASSIFIED
- 84. Fishbone Diagrams Lean Six Sigma Pick one main cause and ask “Why did cause A occur?” Results in causes A1, A2, A3, etc. Work one Main Cause I category at a time… please! Why did cause “A” occur? A A1 Problem A2 A3 84 UNCLASSIFIED
- 85. Fishbone Diagrams Lean Six Sigma Pick one cause and ask “Why?” 5 times. End result is a probable cause Main Cause I Ask “Why?” 5 times? Why A? A Why A2A1? A2A1A A2A Probable Problem A2 A2A1A1 Cause Why A2A? A2A1 Why A2A1A? Repeat Cycle of Questions for Each Main Cause 85 UNCLASSIFIED
- 86. Identify Root Causes Lean Six Sigma Main Cause I Main Cause II If one probable cause repeats… Root Cause C B Problem A A Main Cause V Main Cause IV Main Cause III Root Cause 86 UNCLASSIFIED
- 87. Exercise – Root Cause Analysis Lean Six Sigma Using the simulation, determine what the effect of interest is then brainstorm causes using the 5 Whys Create Cause and Effect Diagram that concentrates on reducing variation in the Simulation process 10 minutes 87 UNCLASSIFIED
- 88. XY Matrix Lean Six Sigma XY matrix is used to: Identify and subjectively rank "sub-Ys" Relate Xs to Ys Take the first crack at: Y = f(X) 88 UNCLASSIFIED
- 89. Why Do We Need an XY Matrix? Lean Six Sigma To allow everyone involved with a process to agree on outputs critical to the product and/or customer Through numerical ranking, an XY matrix enables your team to assign a level of importance to each output variable Through association, an XY matrix enables a team to numerically assess the effect of each X on each Y It provides the team its first stab at determining Y = f(X) It leads the way to an area of focus on the process “Failure Modes and Effects Analysis” (FMEA) 89 UNCLASSIFIED
- 90. How to Create a Useful XY Matrix Lean Six Sigma Step 1: Use available information sources like process maps and fishbones to aid you in your identification of inputs and outputs. Step 2: List the output variables (Ys) along the top section of the matrix. These are outputs that the team and/or customer deem important. These may be a subset of the list of Ys identified on the process map. Step 3: Rank each output numerically using an arbitrary scale (possibly 1 to 10). The most important output receives the highest number. Enter these rankings in the Output Ranking row of the matrix. 90 UNCLASSIFIED
- 91. How to Create a Useful XY Matrix Lean Six Sigma Step 4: Identify all potential inputs or causes (Xs) that can impact the various Ys and list these along the left side of the matrix. Step 5: Numerically rate the effect of each X on each Y within the body of the matrix. Step 6: Use the results page to analyze and prioritize where to focus your effort when creating the preliminary FMEA. The XY matrix is a great team brainstorming tool. It can also facilitate future team activities. 91 UNCLASSIFIED
- 92. BRC Process Map Lean Six Sigma Step 1 Use available N-HHQ Schedule N-HHQ Fiscal Guidance information sources like process maps and Fishbones to aid you in your identification of inputs and outputs. VA BVA C- Schedule C-Guidance NVA 92 UNCLASSIFIED
- 93. XY Matrix Lean Six Sigma Step 2 List the important XY Matrix output variables along the top Project: section of the matrix. Date: DEMO 1 2 3 Step 3 Rank each output View Results numerically using an Variables (Y's) Justification Delete arbitrary scale. A scale of 1 Com plete M eet Due Analysis to 10 is often used. Output Effort Date Instructions Step 4 Identify potential causes (failed Xs) that can Output Ranking 6 9 8 impact various outputs, and list Input Variables (X's) Association Table Rank % Rank each one along the left side of 1 Schedule 3 8 9 162 18.71% the matrix. 2 Training 8 7 1 119 13.74% Step 5 Numerically rate the SOP 7 7 1 113 13.05% effect of each X on each Y 3 Resource within the body of the matrix. 1 6 1 4 Guidance 68 7.85% 1 5 1 Step 6 Use the resulting ranks to 5 Fiscal Code 59 6.81% analyze and prioritize future 7 Security Class 6 1 1 53 6.12% team activities. 8 Manual Process 6 7 5 139 16.05% 93 UNCLASSIFIED
- 94. In- In-Class Exercise Lean Six Sigma Break into your groups Use your Simulation Round 1 Results Use the 6-step methodology to create an XY matrix (XYMatrix.xls) for the process Use the Xs and Ys from your process map as key information Be prepared to report your results 10 minutes 94 UNCLASSIFIED
- 95. FMEA Defined Lean Six Sigma Failure Modes and Effects Analysis (FMEA) is a detailed document that identifies ways a process or product can fail to meet critical customer requirements (Ys) (failure modes) A living document that lists all possible causes (Xs) of failure From this, list of items for the control plan can be generated A document that allows the team to track and prioritize the actions required to improve the process FMEA is used to reduce risk, and therefore unintended consequences, in the implementation. In short, a FMEA will: Ultimately capture the entire process Identify ways the product or process failed because of these Xs Facilitate the documentation of a plan to prevent those failures 95 UNCLASSIFIED
- 96. When to Conduct a FMEA Lean Six Sigma Early in the process design or improvement development. When new systems, products, and processes are being designed. When existing designs or processes are being changed. When carry-over designs are used in new applications. After system, product, or process functions are defined, but before beginning detailed final design. When the design concept has been decided. 96 UNCLASSIFIED
- 97. Types of FMEA Lean Six Sigma System - Analyzes systems and subsystems in early concept and design stages Design – Analyzes new process, product or service design before rollout Process – Used to improve existing transactional and operational processes 97 UNCLASSIFIED
- 98. FMEA Form Lean Six Sigma Process or Prepared by: Page ____ of ____ Product Name: Responsible: FMEA Date (Orig) ______________ (Rev) _____________ ANALYZE PHASE IMPROVE PHASE Process O O Potential Failure Potential Failure D Actions D Step / S Potential Causes C Current Controls Resp. Actions Taken S C Mode Effects E Recommended E Input E C E C T T What is the In what ways does What is the impact V What causes the U What are the existing What are the What are the V U E R E R process the Key Input go on the Key Output E Key Input to go R controls and actions for completed E R C P C P step and wrong? Variables R wrong? R procedures (inspection reducing the actions taken R R T N T N Input under (Customer I E and test) that prevent occurrence of the with the I E I I investiga- Requirements)? T N either the cause or the cause, or recalculated T N O O tion? Y C Failure Mode? improving RPN? Y C N N E detection? E 0 0 0 0 98 UNCLASSIFIED
- 99. Sample FMEA Rating Scale Lean Six Sigma LIKELIHOOD OF RATING DEGREE OF SEVERITY OCCURRENCE ABILITY TO DETECT 1 Customer will not notice Likelihood of occurrence is Sure that the potential the adverse effect or it is remote failure will be found or insignificant prevented before reaching the next customer 2 Customer will probably Low failure rate with Almost certain that the experience slight supporting documentation potential failure will be annoyance found or prevented before reaching the next customer 3 Customer will experience Low failure rate without Low likelihood that the annoyance due to the supporting documentation potential failure will reach slight degradation of the next customer performance undetected 4 Customer dissatisfaction Occasional failures Controls may detect or due to reduced prevent the potential performance failure from reaching the next customer 5 Customer is made Relatively moderate failure Moderate likelihood that uncomfortable or their rate with supporting the potential failure will productivity is reduced by documentation reach the next customer the continued degradation of the effect 99 UNCLASSIFIED
- 100. Sample FMEA Rating Scale – Cont Lean Six Sigma RATING DEGREE OF SEVERITY LIKELIHOOD OF OCCURRENCE ABILITY TO DETECT 6 Warranty repair or significant Moderate failure rate without Controls are unlikely to detect or manufacturing or assembly complaint supporting documentation prevent the potential failure from reaching the next customer 7 High degree of customer Relatively high failure rate with Poor likelihood that the dissatisfaction due to component supporting documentation potential failure will be detected failure without complete loss of or prevented before reaching function. Productivity impacted by the next customer high scrap or rework levels. 8 Very high degree of dissatisfaction High failure rate without Very poor likelihood that the due to the loss of function without a supporting documentation potential failure will be detected negative impact on safety or or prevented before reaching governmental regulations the next customer 9 Customer endangered due to the Failure is almost certain based Current controls probably will adverse effect on safe system on warranty data or significant not even detect the potential performance with warning before DV testing failure failure or violation of governmental regulations 10 Customer endangered due to the Assured of failure based on Absolute certainty that the adverse effect on safe system warranty data or significant DV current controls will not detect performance without warning before testing the potential failure failure or violation of governmental regulations 100 UNCLASSIFIED
- 101. Example: Budget Review FMEA Lean Six Sigma Process or Budget Review Prepared by: Susan Product Name: Committee UFR Wheeler process Responsible: Susan Wheeler FMEA Date (Orig) ___1 Oct 2009______ (Rev O Process Step / Potential Failure Potential Failure D S Potential Causes C Current Controls Input Mode Effects E E C T What is the In what ways What is the impact V What causes the U What are the existing E process step does the Key on the Key Output E Key Input to go R controls and C RPN and Input Input go wrong? Variables R wrong? R procedures T under (Customer I E (inspection and test) I investiga-tion? Requirements)? T N that prevent either O Y C the cause or the N E Failure Mode? Each activity is Activity doesn’t assigned a budget 8 understand 5 ombudsman to 2 80 UFRs can't be instructions UFRs assist activity recommended incomplete for funding BRC Panels Low Activity Calendar and email convened 8 priority to submit 7 reminders; 6 336 quality UFR template for UFRs UFR not Panel reviewed by Functional Expert Members not functional 9 TDY or on leave 4 Backup SME 6 216 present expert 101 UNCLASSIFIED
- 102. Exercise - FMEA Lean Six Sigma Create a FMEA for one process step of the Simulation 15 minutes 102 UNCLASSIFIED
- 103. Graphical Tools Lean Six Sigma The primary graphical tools available to help characterize and learn about the process are: Pareto Charts Histograms and Dot Plots Run Charts / Control Charts / Time Series Plots Scatter Plots Box Plots 103 UNCLASSIFIED
- 104. Pareto Chart Lean Six Sigma The Pareto Chart is a bar chart that displays the relative frequency of factors or causes that contribute to the problem. The Pareto Chart is used to: Separate the critical few areas from the trivial many Focus and refine the problem statement Pareto Effect: 80% of the problem is due to 20% of the potential causes TIP: Data collected over a short time period, especially from an unstable process, can lead to incorrect conclusions. Examine the data for stratification or changes over time. Ensure that categories (X axis) are meaningful. 104 UNCLASSIFIED
- 105. Pareto Chart Lean Six Sigma LQA – Living Quarters Allowance PD - Per Diem TQSA – Temporary Quarters Subsistence Allowance AoP - Advice of Payment MEA – Miscellaneous Expense Allowance PA - Per Annum 105 UNCLASSIFIED
- 106. Pareto Charts Lean Six Sigma TASK: Create a Pareto Chart using the Defect and Frequency data Go to Stat menu > Quality Tools > Pareto Chart Click inside the “Chart defects table:” selection box and enter Defects in Labels and Frequency in Frequency boxes Click OK 106 UNCLASSIFIED
- 107. Pareto Charts Lean Six Sigma RESULTS: To create a Pareto Chart in EXCEL, summarize the count of Defects by type, sort the sums in order of frequency, highlight the data and click Insert Chart, Column. You can create the percent/cumulative percent chart separately and affix underneath the Column charts. 107 UNCLASSIFIED
- 108. Correlation Lean Six Sigma (Response) (Factor) Identify dependency relationships between two or more variables (Xs and Y). Y X y1 x1 It is customary to call X the y2 x2 input variable (independent) and Y the output variable y3 x3 (dependent). y4 x4 y5 x5 y_nth x_nth 108 UNCLASSIFIED
- 109. Scatter Diagram Lean Six Sigma Good for finding and/or confirming relationships between measures Will not prove that a cause-and-effect relationship exists Can assist in identifying which process inputs impact the process output Add evidence to opinion regarding cause and effect Can identify clues for improvement Enables teams to test hunches between two factors Examples: Ice Cream Sales as they relate to outside temperature Demand for gasoline as it relates to the price at the pump 109 UNCLASSIFIED
- 110. Scatter Diagram Lean Six Sigma Scatter Diagram for Cycle Time vs Number of Inv. Skids 12.0 Hours to Perform 10.0 Inventory 8.0 6.0 4.0 2.0 0.0 0 1000 2000 3000 4000 Number of Inventory Skids 110 UNCLASSIFIED
- 111. Scatter Diagrams Patterns Lean Six Sigma (Dependent Variable) X and Y appear to be unrelated Y is more variable as X increases (Dependent Variable) Y Y X (Independent Variable) X (Independent Variable) Y Decreases as X Increases Y Increases as X Increases (negative linear trend) (positive linear trend) (Dependent Variable) (Dependent Variable) Y Y X (Independent Variable) X (Independent Variable) 111 UNCLASSIFIED
- 112. Examples of Variable Relationships Lean Six Sigma 55 No Relationship Strong Linear 54 60 53 52 51 50 50 49 48 47 40 46 45 46.5 47.5 48.5 49.5 50.5 51.5 52.5 53.5 60 70 80 X1 Strong Non-Linear 55 ModerateXLinear 6.0 54 53 52 5.5 51 50 49 5.0 48 47 46 4.5 45 0 10 20 30 40 50 60 70 80 90 100 46 47 48 49 50 51 52 53 54 55 112 UNCLASSIFIED
- 113. Abuse & Misuse of Correlation Lean Six Sigma If we establish a correlation between X1 and Y, that does NOT necessarily mean variation in X1 caused variation in Y A third variable that is associated with both X1 and Y may be “lurking.” Relationship could be coincidental To conclude that there is a relationship between two variables does NOT mean that there is a cause and effect relationship. Correlation Does NOT Determine Causation! A study conducted in New York indicated there was a proportional rise in ice cream sales and murder rates during summer months. Correlation or coincidence? 113 UNCLASSIFIED
- 114. Scatter Plots Lean Six Sigma Definition: Shows relationships between numerical variables (NOT non-numeric variables!) To create scatter plots we need to related numerical variables. Therefore we need to add the Variation data for Teams 2 and 3: Go to the worksheet and click on the first cell of column C8 (T2-Variation) Input the data as shown in the picture to the right Do the same for column C11 (T3-Variation) 114 UNCLASSIFIED
- 115. Scatter Plots Lean Six Sigma TASK: Create a graph showing the relationship between the Distance and the Variation for Statapult Teams 2 and 3: • Go to Graph menu > Scatterplot • Select Simple • Select X and Y variables • Click on Multiple Graphs 115 UNCLASSIFIED
- 116. Scatter Plots (Cont...) Six Sigma Lean Select Overlaid on the same RESULTS: graph Scatterplot of T2-Variation vs T2-Distance, T3-Variation vs T3-Distanc Variable 6 T2-Variation * T2-Distance T3-Variation * T3-Distance 5 4 Y-Data 3 2 1 0 20 30 40 50 60 70 80 90 100 110 X-Data 116 UNCLASSIFIED
- 117. Scatter Plots Lean Six Sigma To create the Scatter Plot in EXCEL, highlight the X then Y variables for the first team and click Insert Chart, Scatter Plot. Repeat for the second team. Adjust the X and Y matrix scales to match the larger dimensions. T2-Variation T-3 Variation 7.00 7.00 6.00 6.00 5.00 5.00 4.00 4.00 3.00 T2-Variation 3.00 T-3 Variation 2.00 2.00 1.00 1.00 0.00 0.00 -10 10 30 50 70 90 110 130 150 0 50 100 150 117 UNCLASSIFIED
- 118. Boxplot Distribution Lean Six Sigma Maximum Length Interquartile Range 75th Percentile Middle 50% of 50th Percentile (Median) Data 25th Percentile Outliers 118 UNCLASSIFIED
- 119. Boxplots Lean Six Sigma Definition: Box plots summarize data in percentages (%) using the Median (not the Mean!) * 50 * Outliers Top wisker (76 - 100%) Top whisker (76-100%) 40 Third quartile Top box (51 - 75%) 30 Median 20 Bottom box (26 - 50%) First quartile 10 Bottom whisker (0 - 25%) 0 Series 119 UNCLASSIFIED
- 120. Boxplots Lean Six Sigma TASK: Make Box Plots of T1-Distance, T2-Distance, T3-Distance, T4-Distance, and T5-Distance: Go to Graph menu > Boxplot Select Multiple Ys Simple > Click OK Click in the Variables box and select T1-Distance, T2-Distance,T3- Distance, T4-Distance, and T5-Distance Click OK twice 120 UNCLASSIFIED
- 121. Boxplots Lean Six Sigma RESULTS: EXCEL does not have a Boxplot template – but it can be created, although the process is far more cumbersome. Instructions and a sample are provided in the OSD LSSTools section of the DEPMS Sandbox work tree. 121 UNCLASSIFIED