Analysis of positional aspects in the variation of real estate values in an Italian Southern Metropolitan area - Carmelo Maria Torre - Silvestro Montrone, Paola Perchinunno
•Download as PPT, PDF•
0 likes•442 views

Analysis of positional aspects in the variation of real estate values in an Italian Southern Metropolitan area - Carmelo Maria Torre Department of Architecture and Urban Planning, Polytechnic of Bari, - Silvestro Montrone, Paola Perchinunno Department of Statistical Science, University of Bari,

Recommended
Recommended
More Related Content
Viewers also liked
Viewers also liked (10)
More from Beniamino Murgante
More from Beniamino Murgante (20)
Analysis of positional aspects in the variation of real estate values in an Italian Southern Metropolitan area - Carmelo Maria Torre - Silvestro Montrone, Paola Perchinunno
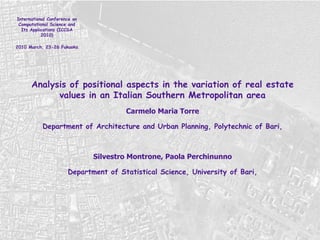
- 1. International Conference on Computational Science and Its Applications (ICCSA 2010) 2010 March, 23-26 Fukuoka Analysis of positional aspects in the variation of real estate values in an Italian Southern Metropolitan area Carmelo Maria Torre Department of Architecture and Urban Planning, Polytechnic of Bari, Silvestro Montrone, Paola Perchinunno Department of Statistical Science, University of Bari,
- 2. Analysis of positional aspects in the variation of real estate values in an Italian Southern Metropolitan area Montrone, Torre, Perchinunno Why this job? Property value appraisal and recapture is the “ chimera ” of all Italian Researcher sin real estate market Main limitation are: - Cadastral system does not provide real and proper on property market of soils and buldings roperty. - Contracts of sales do not contain usually the true price of property But: Property value can be considered as indirect effect of quality of market and availability to residential services International Conference on Computational Science and Its Applications (ICCSA 2010) 2010 March, 23-26 Fukuoka
- 3. Analysis of positional aspects in the variation of real estate values in an Italian Southern Metropolitan area Montrone, Torre, Perchinunno Why this job? Property value can be identified indirectly by the use of a fuzzy parameter, by the use of a measure of stability of a fuzzy function, measuring the stability of property value-differential among different areas inside the city But: Property value can be considered as indirect effect of quality of market and availability to residential services, therefore is possible to rank different market segmentation inside the city International Conference on Computational Science and Its Applications (ICCSA 2010) 2010 March, 23-26 Fukuoka
- 4. Analysis of positional aspects in the variation of real estate values in an Italian Southern Metropolitan area Montrone, Torre, Perchinunno Analyzing the Stability of “Distance” of property value for each quarter of the city Preliminary analysis of stability of data 0 Palermo
- 5. Analysis of positional aspects in the variation of real estate values in an Italian Southern Metropolitan area Montrone, Torre, Perchinunno Analyzing the Stability of “Distance” of property value for each quarter of the city Preliminary analysis of stability of data 0 Napoli
- 6. Analysis of positional aspects in the variation of real estate values in an Italian Southern Metropolitan area Montrone, Torre, Perchinunno Analyzing the Stability of “Distance” of property value for each quarter of the city Preliminary analysis of stability of data 0 Bari
- 7. Analysis of positional aspects in the variation of real estate values in an Italian Southern Metropolitan area Montrone, Torre, Perchinunno Analyzing the Stability of “Distance” of property value for each quarter of the city Preliminary analysis of stability of data 0 Fuzzy value of property - Palermo
- 8. Analysis of positional aspects in the variation of real estate values in an Italian Southern Metropolitan area Montrone, Torre, Perchinunno Analyzing the Stability of “Distance” of property value for each quarter of the city Preliminary analysis of stability of data 0 Fuzzy value of property - Napoli
- 9. Analysis of positional aspects in the variation of real estate values in an Italian Southern Metropolitan area Montrone, Torre, Perchinunno Analyzing the Stability of “Distance” of property value for each quarter of the city Preliminary analysis of stability of data 0 Fuzzy value of property - Palermo
- 10. Analysis of positional aspects in the variation of real estate values in an Italian Southern Metropolitan area Montrone, Torre, Perchinunno Analyzing the Stability of “Distance” of property value for each quarter of the city 1 ° i 2 ° ° ° 3 ° ° ° n Espected Value (euros/square meters) Preliminary analysis of stability of data 0
- 11. Analysis of positional aspects in the variation of real estate values in an Italian Southern Metropolitan area Montrone, Torre, Perchinunno Analyzing the Stability of “Distance” of property value for each quarter of the city 1 ° i 2 ° ° ° 3 ° ° ° n Semantic Distance Euros/(square meters) Preliminary analysis of stability of data 0
- 12. Analysis of positional aspects in the variation of real estate values in an Italian Southern Metropolitan area Montrone, Torre, Perchinunno Analyzing the Stability of “Distance” of property value for each quarter of the city 1 ° i 2 ° ° ° 3 ° ° ° n ° ° ° ° ° ° ° ° ° ° ° ° Stability index =expected value/semantic distance =1 ± ε Preliminary analysis of stability of data 0
- 13. Analysis of positional aspects in the variation of real estate values in an Italian Southern Metropolitan area Montrone, Torre, Perchinunno Analyzing the Stability of “Distance” of property value for each quarter of the city Stability index =expected value/semantic distance =1 ± ε Preliminary analysis of stability of data 0
- 14. Analysis of positional aspects in the variation of real estate values in an Italian Southern Metropolitan area Montrone, Torre, Perchinunno Analyzing the Stability of “Distance” of property value for each quarter of the city Stability index =expected value/semantic distance =1 ± ε Preliminary analysis of stability of data 0
- 15. Analysis of positional aspects in the variation of real estate values in an Italian Southern Metropolitan area Montrone, Torre, Perchinunno Analyzing the Stability of “Distance” of property value for each quarter of the city Stability index =expected value/semantic distance =1 ± ε Preliminary analysis of stability of data 0
- 16. Analysis of positional aspects in the variation of real estate values in an Italian Southern Metropolitan area Montrone, Torre, Perchinunno Analyzing the Stability of “Distance” of property value for each quarter of the city Stability index =expected value/semantic distance =1 ± ε Preliminary analysis of stability of data 0 Stability of differential value of property Palermo Fuzzy value of property - Palermo
- 17. Analysis of positional aspects in the variation of real estate values in an Italian Southern Metropolitan area Montrone, Torre, Perchinunno Analyzing the Stability of “Distance” of property value for each quarter of the city Stability index =expected value/semantic distance =1 ± ε Preliminary analysis of stability of data 0 Stability of differential value of property Napoli
- 18. Analysis of positional aspects in the variation of real estate values in an Italian Southern Metropolitan area Montrone, Torre, Perchinunno Analyzing the Stability of “Distance” of property value for each quarter of the city Stability index =expected value/semantic distance =1 ± ε Preliminary analysis of stability of data 0 Stability of differential value of property Bari
- 19. Property value Data (FIAIP) Value for each quarter of the city of Bari, in the South of Italy 1 Quarters New/refurbished( € /m 2 ) Good state ( € /m 2 ) Degraded ( € /m 2 ) min estate value max estate value min estate value max estate value min estate value max estate value Carbonara-Ceglie 2.200 2.500 1.900 2.200 1.300 1.700 Carrassi 2.600 3.800 2.200 3.300 1.500 2.600 Japigia 2.400 2.600 2.300 2.500 2.100 2.300 Libert à 2.700 3.500 2.200 2.800 1.800 2.200 Madonnella 2.400 3.500 2.350 3.200 2.300 2.600 S.Girolamo F. 2.200 4.500 2.000 3.000 1.800 2.400 Murat 3.700 5.500 3.200 4.500 3.000 3.500 Palese 2.000 2.600 1.400 1.750 800 1.000 Picone Poggiofr. 2.000 3.500 1.500 2.800 1.100 2.000 S.Nicola 1.500 4.200 1.100 3.000 1.000 2.200 S.Paolo 1.800 2.200 1.400 1.800 1.000 1.400 S.Pasquale 2.600 3.800 2.200 3.300 1.500 2.600 S.Spirito 1.900 2.400 1.300 1.600 800 1.000 Stanic 2.000 2.500 1.500 2.000 1.300 1.800 Torre M. S.Giorgio 1.400 2.500 1.050 1.500 810 1.250
- 20. Analysis of urban difficulty distribution Identification of target areas for urban renewal programmes Total fuzzy and relative approach 2 Varied range of definitions on Urban-social exclusion – Housing unavailability Total Fuzzy and Relative Use of Fuzzy Set to obtain a measurement of the incidence of relative difficulty within a population Analysis of positional aspects in the variation of real estate values in an Italian Southern Metropolitan area Montrone, Torre, Perchinunno
- 21. The fuzzy TFR approach consists in the definition of the measurement of a degree of membership of an individual to the fuzzy totality of the difficulty conditions, in the range (0,1) Mathematically such a method consists of the construction of a function of membership to "the fuzzy totality of difficulty" The function subdividing in clusters of difficulty indicates a distribution rule of urban difficulty inside different urban realities Analysis of positional aspects in the variation of real estate values in an Italian Southern Metropolitan area Montrone, Torre, Perchinunno
- 22. Supposing the observation of k indicators of poverty for every family, the function of membership of i-th family to the fuzzy subset of the poor may be defined thus: The values wj in the function of membership are just a weighting system, whose explication is: Analysis of positional aspects in the variation of real estate values in an Italian Southern Metropolitan area Montrone, Torre, Perchinunno
- 24. Distribution of intrinsic and positional quality of housing Neighbourhoods 0,0 - 0,2 property non-decay 0,2 - 0,4 slightly property decay 0,4 - 0,6 almost property decay 0,6 - 0,8 property decay 0,8 - 1,0 Unquestionably property decay Carbonara 49 40 52 7 4 Carrassi 76 9 6 10 0 Ceglie 13 12 18 2 4 Japigia 51 16 6 3 2 Libert à 23 14 30 25 16 Roseto 5 3 4 1 0 Madonnella 20 6 8 4 11 S.Girolamo F. 21 28 15 6 2 Murat 106 15 5 2 0 Palese 28 16 15 0 1 Picone - Poggiofranco 106 16 13 4 3 S.Nicola 6 8 9 24 27 S.Paolo 12 32 27 11 3 S.Pasquale 40 14 5 7 2 S.Spirito 28 10 16 3 4 Stanic 5 8 6 1 1 Torre a Mare 17 18 14 2 0 Bari 606 265 249 112 80
- 25. After indicators-based clustering, by the imposition of spatial constraints (Patil and Taillie 2004), the approach suggested by Kulldorff (1997 ), has been used: “ Sat Scan” locating a circular window of arbitrary radius, and calculating the probability of poverty (risk) p 1 , inside the circle, or the probability of poverty (risk ) p 2 , outside the circle. Of all windows, the minimum p- value (probability of critical region referring to the test) corresponds to the most important cluster. The identification of a special area can be based on the intensity of a statistical attribute, instead of the number of attribute-characterised elements. Comparison among different census sections difficulty distribution Graduation of target areas for real estate funding Sat scan approach 3
- 26. Nearest Neighbor Index (Chou et al., 2003) use the analysis of average among close and similar conditions: if average is higher than the teorethical one: scattered conditions if average is lower than the teorethical one: concentrated conditions Analysis of positional aspects in the variation of real estate values in an Italian Southern Metropolitan area Montrone, Torre, Perchinunno
- 27. SAT SCAN – BARI Almost Critical Analysis of positional aspects in the variation of real estate values in an Italian Southern Metropolitan area Montrone, Torre, Perchinunno Cluster Number of cases inside Mean outside Mean Standard deviation p -value Nearest Neighbour Index 1 59 1,900 2,880 1.04 0.0010 0.41555 2 212 1,970 3,000 0.99 0.0010 0.46437 3 210 2,070 2,980 1.01 0.0010 0.40666 4 114 5,020 2,630 0.82 0.0010 0.15294 Total 595
- 28. Analysis of positional aspects in the variation of real estate values in an Italian Southern Metropolitan area Montrone, Torre, Perchinunno Final Remarks High instability of real estate data Good Possibility of predict data indirectly: Some open questions: How to predict change in investor preference, when data about property character do not change, but market trends are shocking varying?
- 29. Analysis of positional aspects in the variation of real estate values in an Italian Southern Metropolitan area Montrone, Torre, Perchinunno GRAZIE
Editor's Notes
- RSA - Working Regions November 28, 2008, London
- RSA - Working Regions November 28, 2008, London
- RSA - Working Regions November 28, 2008, London
- RSA - Working Regions November 28, 2008, London
- RSA - Working Regions November 28, 2008, London
- RSA - Working Regions November 28, 2008, London
- RSA - Working Regions November 28, 2008, London
- RSA - Working Regions November 28, 2008, London
- RSA - Working Regions November 28, 2008, London
- RSA - Working Regions November 28, 2008, London
- RSA - Working Regions November 28, 2008, London
- RSA - Working Regions November 28, 2008, London
- RSA - Working Regions November 28, 2008, London
- RSA - Working Regions November 28, 2008, London
- RSA - Working Regions November 28, 2008, London
- RSA - Working Regions November 28, 2008, London
- RSA - Working Regions November 28, 2008, London
- RSA - Working Regions November 28, 2008, London
- RSA - Working Regions November 28, 2008, London
- RSA - Working Regions November 28, 2008, London
- RSA - Working Regions November 28, 2008, London
- RSA - Working Regions November 28, 2008, London
- RSA - Working Regions November 28, 2008, London