SlideShare uma empresa Scribd logo
1 de 6
Baixar para ler offline
OPPENHEIMER ASSET MANAGEMENT
The Consulting Group

Benchmark Returns through November 2010
                                      1 Month 3 Months YTD    1 year   3 years   5 years   7 years   10 years 15 years
BarCap Municipal 5 Yr 4-6 TR USD      -0.59   -0.89   4.46    4.41     6.03      5.32      4.30      5.08       4.96
BarCap Municipal 7 Yr 6-8 TR USD      -0.90   -1.45   6.11    5.52     6.24      5.60      4.71      5.50       5.36
BarCap Municipal TR USD               -2.00   -2.42   4.40    4.76     4.86      4.67      4.47      5.30       5.37
BarCap US Agg Bond TR USD             -0.57   -0.11   7.70    6.02     6.39      6.23      5.42      6.15       6.22
BarCap US Govt/Credit Interm TR USD   -0.67   0.27    7.23    5.67     5.94      5.93      4.92      5.84       5.87
BarCap US Govt/Credit Long TR USD     -1.35   -4.23   12.56   8.85     7.53      6.84      6.74      7.59       7.27
BarCap US Govt/Credit TR USD          -0.79   -0.52   8.11    6.19     6.17      6.06      5.26      6.19       6.17
BofAML US HY Master II TR USD         -1.08   4.29    13.20   16.75    9.59      8.63      8.31      8.66       7.30
BofAML US Treasuries 1-3 Yr TR USD    -0.17   0.20    2.54    1.73     3.37      4.29      3.46      4.06       4.65
Citi Treasury Bill 3 Mon USD          0.01    0.04    0.12    0.12     0.79      2.36      2.25      2.31       3.27
DJ Industrial Average TR USD          -0.61   10.63   8.29    9.33     -3.51     3.08      4.31      2.98       7.61
DJ UBS Commodity TR USD               -0.35   12.21   5.55    7.64     -5.46     -0.23     4.52      5.10       5.98
FTSE NAREIT Equity REITs TR           -1.96   7.24    22.25   30.99    -2.55     2.06      7.83      11.01      10.60
MSCI EAFE GR USD                      -4.79   8.35    0.10    1.55     -9.63     2.27      6.81      3.49       4.82
MSCI EAFE Growth GR USD               -3.20   10.64   4.40    6.47     -8.59     3.33      6.78      2.44       3.38
MSCI EAFE Value GR USD                -6.45   5.96    -4.20   -3.33    -10.73    1.13      6.75      4.41       6.11
MSCI EM Asia GR USD                   -1.91   12.01   12.29   17.42    -2.77     13.36     15.54     14.14      4.50
MSCI EM GR USD                        -2.64   11.35   11.24   15.65    -2.19     12.85     17.76     15.71      8.80
MSCI EM Latin America GR USD          -3.40   10.20   8.01    10.23    2.88      18.61     27.29     21.23      16.05
MSCI World Ex USA GR USD              -4.21   8.76    1.26    2.90     -8.82     2.88      7.39      3.97       5.28
MSCI World GR USD                     -2.11   11.07   4.61    6.52     -6.93     1.99      5.50      2.25       5.66
MSCI World Growth GR USD              -1.04   14.03   7.60    10.42    -5.46     2.95      5.42      1.24       4.92
MSCI World Value GR USD               -3.22   8.09    1.62    2.69     -8.48     0.92      5.46      3.03       6.11
Nasdaq Composite                      -0.20   18.49   11.06   17.58    -1.17     4.69      3.33      2.32
Russell 1000 Growth TR USD            1.16    17.28   10.62   14.04    -2.35     2.58      4.04      -0.84      5.39
Russell 1000 TR USD                   0.33    13.81   8.83    11.48    -4.66     1.30      4.06      1.29       6.65
Russell 1000 Value TR USD             -0.53   10.40   7.06    8.95     -7.11     -0.13     3.90      2.98       7.26
Russell 2000 Growth TR USD            4.36    24.26   19.98   30.25    -0.07     3.74      5.33      3.64       4.53
Russell 2000 TR USD                   3.47    21.12   17.52   26.98    -0.37     2.79      5.51      6.40       7.28
Russell 2000 Value TR USD             2.54    17.95   14.95   23.66    -0.78     1.72      5.51      8.66       9.44
Russell 2500 Growth TR USD            4.03    22.24   19.91   29.16    -0.24     4.24      6.15      4.07       6.37
Russell 2500 TR USD                   2.81    18.96   17.77   26.26    -0.19     3.38      6.36      7.08       8.85
Russell 2500 Value TR USD             1.74    16.13   15.90   23.75    -0.22     2.30      6.23      8.77       10.05
Russell 3000 TR USD                   0.58    14.37   9.51    12.63    -4.33     1.42      4.18      1.66       6.65
Russell Mid Cap Growth TR USD         3.28    20.29   18.97   26.33    -0.96     3.85      6.59      3.02       7.36
Russell Mid Cap TR USD                1.82    16.94   17.35   24.04    -1.28     3.48      7.31      6.61       9.37
Russell Mid Cap Value TR USD          0.51    14.03   16.00   22.07    -1.78     2.78      7.42      8.20       9.91
S&P 500 Growth TR                     0.47    16.19   9.34    11.66    -2.12     2.51      3.88      0.04       6.44
S&P 500 TR                            0.01    13.08   7.86    9.94     -5.15     0.98      3.65      0.81       6.44
S&P 500 Value TR                      -0.46   10.02   6.35    8.23     -8.31     -0.66     3.29      1.36       6.10
S&P MidCap 400 Growth TR              4.51    22.04   23.77   30.62    2.94      5.76      8.18      7.10       12.96
S&P MidCap 400 TR                     2.97    18.56   18.85   26.31    1.29      4.55      7.45      7.27       10.92
S&P MidCap 400 Value TR               1.37    15.08   14.06   22.03    -0.39     3.22      6.64      7.31       8.92
S&P 500 Sector/Cons Disc TR           2.61    20.12   22.55   28.11    3.12      3.30      3.91      3.44       7.39
S&P 500 Sector/Cons Staples TR        -1.17   7.76    9.48    9.19     1.75      6.77      6.81      4.92       7.69
S&P 500 Sector/Energy TR              5.49    21.71   10.52   9.50     -4.19     6.58      15.20     9.61       12.01
  OAM112210CM4                                                                                       Page 1 of 6
S&P 500 Sector/Financials TR                     -0.67       6.88        1.26         -0.31       -20.55       -12.41      -6.23        -3.85       4.10
S&P 500 Sector/Health Care TR                    -2.87       8.15        -1.51        0.53        -4.08        1.63        2.67         -0.41       7.63
S&P 500 Sector/Industrials TR                    1.11        15.61       17.63        19.15       -5.29        1.72        4.96         1.98        7.11
S&P 500 Sector/Information Technology TR         -1.64       17.44       4.68         10.56       -0.77        3.34        3.71         -2.65       7.17
S&P 500 Sector/Materials TR                      1.12        16.21       10.73        12.51       -3.32        5.99        7.80         9.07        6.47
S&P 500 Sector/Telecom Services TR               -1.43       7.69        10.36        15.49       -4.83        4.28        6.73         -1.90       2.65
S&P 500 Sector/Utilities TR                      -3.03       0.94        2.30         7.97        -6.58        3.50        8.94         1.40        6.01
Wilshire 5000 Total Mkt TR USD                   0.53        14.16       9.66         12.61       -4.26        1.57        4.38         2.01        6.67

Data Source: Morningstar
All index performance marked as “TR” is “Total Return” and is calculated based on the daily reinvestment of dividends on the ex-dividend date. Indices
marked “GR”, which stands for “Gross Return”, also use the Total Return calculation described. The information and statistical data contained herein have
been obtained from sources we believe to be reliable. Indices are not available for direct investment and do not reflect the costs of buying or selling
securities or investment management fees. Please read the following Glossary of Indexes for important information about each index.


   OAM112210CM4                                                                                                                         Page 2 of 6
Glossary of Indexes

Indices are unmanaged, hypothetical portfolios of securities that are often used as a benchmark in evaluating the relative performance of a
particular investment. An index should only be compared with a mandate that has a similar investment objective. An Index is not available for
direct investment, and does not reflect any of the costs associated with buying and selling individual securities or management fees.

BofA Merrill Lynch US Treasuries 1-3 Year Index – A subset of the BofA Merrill Lynch US Treasury Index including all securities with a
remaining term to final maturity less than 3 years. The BofA Merrill Lynch US Treasury Index tracks the performance of US dollar
denominated US Treasury debt issued in the US domestic market. Qualifying securities must have an investment grade rating (based on an
average of Moody’s, S&P and Fitch).

Barclays Capital U.S. Government/Credit Bond Index - The U.S. Government/Credit Bond Index is the non-securitized component of the
U.S. Aggregate Index . Specifically, the Government/Credit Index includes treasuries (i.e., public obligations of the US Treasury that have
remaining maturities of more than 1 year), Government-Related issues (i.e. agency, sovereign, supranational, and local authority debt) and
Corporates ( publicly issued US corporate and Yankee debentures and secured notes that meet specified maturity, liquidity, and quality
requirements). All issues in the Government/Credit Index are rated Baaa3/BBB-/BBB- or higher (using the middle rating of Moody’s, S&P,
and Fitch, respectively) and have at least one year to maturity and have an outstanding par value of at least $250 million.

Barclays Capital U.S. Government/Credit Intermediate Bond Index - A subgroup of the Barclays Government/Credit Bond Index that is
based on maturity with greater than 1 to 10 years.

Barclays Capital U.S. Govt/Credit Long Index - A subset of the Barclays US Government/Credit Index that is based on maturity with at least
10 years.

Barclays Capital U.S. Aggregate Bond Index - The U.S. Aggregate Index covers the USD-denominated, investment-grade, fixed-rate,
taxable bond market of SEC-registered securities. The Index includes bonds from the Treasury, Government-Related, Corporate, MBS (agency
fixed-rate and hybrid ARM pass throughs), ABS, and CMBS sectors. The U.S. Aggregate Index is a component of the U.S. Universal Index in
its entirety. The index was created in 1986 with index history backfilled to January 1, 1976. All issues in the Aggregate Index are rated
Baaa3/BBB-/BBB- or higher (using the middle rating of Moody’s, S&P, and Fitch, respectively) and have at least one year to maturity and have
an outstanding par value of at least $250 million.


Barclays Capital U.S. Municipal Bond - The U.S. Municipal Indices cover the USD-denominated long-term tax exempt bond market. The
index has four main sectors: state and local general obligation bonds, revenue bonds, insured bonds and prerefunded bonds. It is generally
representative of the broad market for tax-exempt bonds. The Index is comprised of investment-grade, tax-exempt, and fixed-rate bonds. All
issues in the Barclays Muni Index are rated Baa or higher, have at least one year to maturity and an outstanding par value of at least $7 million..


Barclays Capital U.S 5-Year Municipal Bond Index (Barclays Muni 5yr): The Index, representing a subset of the Barclays Muni, is
comprised of investment-grade, tax-exempt and fixed-rate bonds with a minimum credit rating of Baa and a maturity range typically between 4
to 6 years. All issues in the Barclays Muni 5yr Index have at least one year to maturity and an outstanding par value of at least $5 million. The
Barclays Muni 5 yr may have a shorter maturity and duration than the Barclays Muni Index.

Barclays Capital U.S. 7-Year Municipal Bond Index - The Index, representing a subset of the Barclays Muni, is comprised of investment-
grade, tax-exempt and fixed-rate bonds with a minimum credit rating of Baa and a maturity range typically between 6 to 8 years. All issues in
the Barclays Muni 7yr Index have at least one year to maturity and an outstanding par value of at least $5 million. The Barclays Muni 7yr may
have a shorter maturity and duration than the Barclays Muni Index.


Citigroup 3-month T-bill Index - This is an unmanaged index of three-month Treasury bills that measures monthly return equivalents of yield
averages that are not marked to market. The Three-Month Treasury Bill Indexes consist of the last three three-month Treasury bill issues.

Dow Jones Industrial Average Index - The oldest continuing US market Index, includes 30 “blue-chip” US stocks selected for their history of
successful growth and wide interest among investors. It is called an average because it originally was computed by adding up stock prices and
dividing by the number of stocks. This methodology remains the same today, but the devisor has been changed to preserve historical
continuity.
Dow Jones AIG Commodity Index - A futures commodity index listing 19 different commodities in the United States. It is designed to be a
diversified and liquid index tracking the performance of physical commodities in the United States. It weights the commodities listed according
to liquidity and dollar-adjusted production data. However, unlike other commodity indices, the DJ-AIGCI sets limits on its weighting so as to
maintain its own diversification. It is a rolling index, which means that futures near their delivery dates must be sold so as to avoid delivery of
the underlying.
   OAM112210CM4                                                                                                               Page 3 of 6
BofA ML High-Yield Master Index - A capitalization-weighted Index that provides a broad measure of the performance of the non-
investment grade US domestic bond market. The Index is limited to US domestic and Yankee markets. Bonds must have greater than 1 year
remaining to final maturity, at least $100 million face outstanding, be US dollar pay, have a fixed coupon schedule with a credit rating below
investment grade not in default.


FTSE National Association of Real Estate Investment Trusts (NAREIT) Equity Index - An Index consisting of all tax qualified real estate
investment trusts whose common shares are listed on the NYSE, AMEX and the NASDAQ. The Index is capitalization-weighted and all REITs
must have at least 75% of their gross invested book assets invested directly or indirectly in the equity ownership of real estate.


Morgan Stanley Capital International, Europe, Australasia, Far East Index (MSCI EAFE) - An Index in US dollars based on the share
price of companies listed on stock exchanges in 21 developed countries outside of North America. This Index is created by aggregating the 21
different country Indices, all of which are created separately. It is considered to be generally representative of overseas stock markets.

MSCI EAFE Value Index - An Index in US dollars representing approximately half of the total market capitalization of the MSCI EAFE
Index. The companies in this Index tend to have lower price-to-book ratios than the MSCI EAFE Growth Index. The MSCI EAFE Value is
calculated using the constituents of the Value Indices of the 21 developed countries outside of North America composing the MSCI EAFE
Index.
MSCI EAFE Growth Index - An Index in US dollars representing approximately half of the total market capitalization of the MSCI EAFE
Index. The companies in this Index tend to have higher price-to-book ratios than the MSCI EAFE Value Index. The MSCI EAFE Growth Index
is calculated using the constituents of the Growth Indices of the 21 developed countries outside of North America composing the MSCI EAFE
Index.


Morgan Stanley Capital International, World Index (MSCI World) - An Index in US dollars based on the share price of companies listed
on stock exchanges in 23 developed countries including the US and Canada. This Index is created by aggregating the 23 different country
Indices, all of which are created separately. It is considered to be generally representative of domestic and overseas stock markets.

MSCI World Value Index - An Index in US dollars representing approximately half of the total market capitalization of the MSCI World
Index. The companies in this Index tend to have lower price-to-book ratios than the MSCI World Growth Index. The MSCI World Value is
calculated using the constituents of the Value Indices of the 23 developed countries including the US and Canada that compose the MSCI
World Index.

MSCI World Growth Index - An Index in US dollars representing approximately half of the total market capitalization of the MSCI World
Index. The companies in this Index tend to have higher price-to-book ratios than the MSCI World Value Index. The MSCI World Growth is
calculated using the constituents of the Growth Indices of the 23 developed countries including the US and Canada that compose the MSCI
World Index.
Morgan Stanley Capital International, World ex-US Index (World ex-US) - An Index in US dollars based on the share price of companies
listed on stock exchanges in 22 developed countries excluding the US. This Index is created by aggregating the 22 different country Indices, all
of which are created separately. It is considered to be generally representative of overseas stock markets.

MSCI Emerging Markets Free Index (MSCI EMF) - A market capitalization weighted Index in US dollars representing 26 emerging
markets in the world. This Index is created by aggregating the 26 different country Indices, all of which are created separately. It is considered
to be generally representative of emerging markets.

MSCI EM Asia Index - The MSCI Emerging Markets Asia Index is a free float-adjusted market capitalization index that is designed to
measure equity market performance of emerging markets. As of May 27, 2010 the MSCI Emerging Markets Index consisted of the following
21 emerging market country indices: China, India, Indonesia, Korea, Malasya, Philippines, Taiwan, Thailand.

NASDAQ Composite - A market-value weighted index of all common stocks listed on Nasdaq. The index is used mainly to track technology
stocks, and thus it is not a good indicator of the market as a whole.
Russell 1000 Index - Measures the performance of the 1,000 largest companies in the Russell 3000 Index. Frank Russell Co. ranks the US
common stocks from largest to smallest market capitalization at each annual reconstitution period. The Russell 1000 Index represents the vast
majority of the total market capitalization of the Russell 3000 Index. It is considered to be generally representative of US Equity Large Cap
performance.
Russell 1000 Growth Index - Measures the performance of the Russell 1000 companies with higher price-to-book ratios and higher forecasted
growth values.

Russell 1000 Value Index - Measures the performance of the Russell 1000 companies with lower price-to-book ratios and lower forecasted
growth values.
   OAM112210CM4                                                                                                              Page 4 of 6
Russell 2000 Index - Measures the performance of the 2,000 smallest companies in the Russell 3000 Index. Frank Russell Co. ranks the US
common stocks from largest to smallest market capitalization at each annual reconstitution period. The Russell 2000 Index represents a very
small percentage of the total market capitalization of the Russell 3000 Index. It is considered to be generally representative of US Equity Small
and Mid Cap performance.

Russell 2000 Growth Index - Measures the performance of those Russell 2000 companies with higher price-to-book ratios and higher
forecasted growth values.
Russell 2000 Value Index - Measures the performance of those Russell 2000 companies with lower price-to-book ratios and lower forecasted
growth values.

Russell 2500 Index - Measures the performance of the 2,500 smallest companies in the Russell 3000 Index. Frank Russell Co. ranks the US
common stocks from largest to smallest market capitalization at each annual reconstitution period. The Russell 2500 Index represents a small
percentage of the total market capitalization of the Russell 3000 Index. It is considered to be generally representative of US Equity Small and
Mid Cap performance.

Russell 2500 Growth Index - Measures the performance of those Russell 2500 companies with higher price-to-book ratios and higher
forecasted growth values than those in the Russell 2500 Value Index.
Russell 2500 Value Index - Measures the performance of those Russell 2500 companies with lower price-to-book ratios and lower forecasted
growth values than those in the Russell 2500 Growth Index.

Russell 3000 Index - Measures the performance of the 3,000 largest US companies based on total market capitalization, which represents
nearly the entire market capitalization of the investable US equity market. Frank Russell Co. ranks the US common stocks from largest to
smallest market capitalization at each annual reconstitution period.

Russell Midcap Index - Measures the performance of the mid-cap segment of the US equity universe. The Russell Midcap Index includes the
smallest 800 securities in the Russell 1000.

Russell Midcap Growth Index - Contains those Russell Midcap (800) securities with a greater-than-average growth orientation. Companies in
this index tend to exhibit higher price-to-book and price-earnings ratios, lower dividend yields and higher forecasted growth values than the
Value universe.
Russell Midcap Value Index - Contains those Russell Midcap (800) securities with a less-than-average growth orientation. Securities in this
index generally have lower price-to-book and price-earnings ratios, higher dividend yields and lower forecasted growth values than the Growth
universe.
S&P 500 Index - The S&P 500 Index consists of 500 stocks chosen for market size, liquidity, and industry group representation. It is a market
value weighted Index (stock price times number of shares outstanding), with each stock’s weight in the Index proportionate to its market value.
The Index is one of the most widely used benchmarks of US Equity Large Cap performance.

S&P 500/Citigroup Growth Index - Companies in the S&P 500 Index are split into two groups based on price-to-book ratios to create growth
and value Indices. The Growth Index contains those with higher price-to-book ratios and represents approximately 50% of the total market
capitalization of the Index.

S&P 500/Citigroup Value Index - Companies in the S&P 500 Index are split into two groups based on price-to-book ratios to create growth
and value Indices. The Value Index contains those with lower price-to-book ratios and represents approximately 50% of the total market
capitalization of the Index.

S&P Midcap 400 Index (S&P Midcap): Portfolio characteristics of the S&P Midcap 400 Index consist of 400 domestic stocks chosen for
market size, liquidity, and industry group representation. It is a market value weighted Index and measures the performance of the mid-size
company segment of the U.S market.
S&P Midcap 400/Citigroup Growth Index - Constructed by dividing the stocks in the S&P Midcap 400 Index according to price-to-book
ratios. The Growth Index contains stocks with higher price-to-book ratios than the Value Index.

S&P Midcap 400/Citigroup Value Index - Constructed by dividing the stocks in the S&P Midcap 400 Index according to price-to-book
ratios. The Value Index contains stocks with lower price-to-book ratios than the Growth Index.
S&P 500 Sector/Consumer Discretionary Index - The S&P 500 Sector/Consumer Discretionary Index consists of stocks chosen for their
representation in the Consumer Discretionary industry. The companies in the index tend to be the most sensitive to economic cycles.
Manufacturing companies include automative, household durable goods, textiles and apparel, and leisure equipment. Service companies
include hotels, restaurants/leisure facilities, media production and services, consumer retailing and services and education services. It is a
market value weighted Index (stock price times number of shares outstanding), with each stock’s weight in the Index proportionate to its market
value.

   OAM112210CM4                                                                                                             Page 5 of 6
S&P 500 Sector/Consumer Staples Index - The S&P 500 Sector/Consumer Staples Index consists of stocks chosen for their representation in
the Consumer Staples industry. The companies in the index tend to be the less sensitive to economic cycles. They include manufacturers and
distributors of food, beverages and tobacco, and producers of non-durable household goods and personal products; also food and drug retailing
companies. It is a market value weighted Index (stock price times number of shares outstanding), with each stock’s weight in the Index
proportionate to its market value.

S&P 500 Sector/Energy Index - The S&P 500 Sector/Energy Index consists of stocks chosen for their representation in the Energy industry.
The companies in the index are dominated by either the construction ofr provision of oil rigs, drilling equipment and other energy-related
service and equipment or the exploration, production, marketing, refining and/or transportation of oil and gas products, coal and consumable
fuels. It is a market value weighted Index (stock price times number of shares outstanding), with each stock’s weight in the Index proportionate
to its market value.

S&P 500 Sector/Financials TR Index - The S&P 500 Sector/Financials Index consists of stocks chosen for their representation in the
Financials industry. The companies in the index are involved in activities such as banking, consumer finance, investment banking and
brokerage, asset management, insurance and investments, and real estate, including REITs. It is a market value weighted Index (stock price
times number of shares outstanding), with each stock’s weight in the Index proportionate to its market value.

S&P 500 Sector/Healthcare TR Index - The S&P 500 Sector/Healthcare Index consists of stocks chosen for their representation in the
Healthcare industry. The companies in the index are involved in health care equpiment and supplies, health care-related services, or in the
research, development, production and marketing of pharmaceuticals and biotechnology products. It is a market value weighted Index (stock
rice times number of shares outstanding), with each stock’s weight in the Index proportionate to its market value.

S&P 500 Sector/Industrials TR Index - The S&P 500 Sector/Industrials Index consists of stocks chosen for their representation in the
Industrials industry. Companies include those that manufacture and distribute capital goods (i.e. aerospace/defense, construction, engineering
and building products, electrical equipment and industrial machinery); provide commercial services and supplies (i.e. printing, employment,
environmental/office services); or provide transportation services (i.e. airlines, couriers, marine, road/rail and transportation infrastructure). It
is a market value weighted Index (stock rice times number of shares outstanding), with each stock’s weight in the Index proportionate to its
market value.

S&P 500 Sector/Information Technology TR Index - The S&P 500 Sector/Information Technology Index consists of stocks chosen for their
representation in the Info Tech industry. Companies considered are involved in technology software and services amd technology hardware
and equipment. It is a market value weighted Index (stock rice times number of shares outstanding), with each stock’s weight in the Index
proportionate to its market value.

S&P 500 Sector/Materials TR Index - The S&P 500 Sector/Materials Index consists of stocks chosen for their representation in the Materials
industry. These include companies that manufacture chemicals, construction materials, glass, paper, forest products and related packaging
products, metals, minerals and minig companies, including steel producers. It is a market value weighted Index (stock rice times number of
shares outstanding), with each stock’s weight in the Index proportionate to its market value.


S&P 500 Sector/Telecommunication Services TR Index - The S&P 500 Sector/Telecom Services Index consists of stocks chosen for their
representation in the Telecom industry. The companies in the index are involved in health care equpiment and supplies, health care-related
services, or in the research, development, production and marketing of pharmaceuticals and biotechnology products. It is a market value
weighted Index (stock rice times number of shares outstanding), with each stock’s weight in the Index proportionate to its market value.
S&P 500 Sector/Utilities TR Index - The S&P 500 Sector/Utilities Index consists of stocks chosen for their representation in the Utilities
industry. Companies considered include electric, gas or water utilities, or companies that operate as independent prducers and/or distributors of
power. It is a market value weighted Index (stock rice times number of shares outstanding), with each stock’s weight in the Index proportionate
to its market value.

Wilshire 5000 - A comprehensive market-capitalization-weighted index composed of over 6,500 stocks. Stocks traded on the New York Stock
Exchange represent approximately 77% of the value of the index.
This report is intended for informational purposes only. The information and statistical data contained herein have been obtained from
sources we believe to be reliable. No part of this report may be reproduced in any manner without the written permission of Oppenheimer
Asset Management or any of its affiliates. Any securities discussed should not be construed as a recommendation to buy or sell and there is
no guarantee that these securities will be held for a client’s account nor should it be assumed that they were or will be profitable. The
Consulting Group is a division of Oppenheimer Asset Management. Oppenheimer Asset Management is the name by which Oppenheimer
Asset Management Inc. (“OAM”) does business. OAM is an indirect, wholly owned subsidiary of Oppenheimer Holdings Inc., which is also
the indirect parent of Oppenheimer & Co. Inc. (“Oppenheimer”). Oppenheimer is a registered investment adviser and broker dealer.
Securities are offered through Oppenheimer. OAM112210CM4


   OAM112210CM4                                                                                                                 Page 6 of 6

Mais conteúdo relacionado

Mais procurados

Weekly Reversal Levels for May 23, 2015
Weekly Reversal Levels for May 23, 2015Weekly Reversal Levels for May 23, 2015
Weekly Reversal Levels for May 23, 2015LunaticTrader
 
Weekly Reversal Levels for March 28, 2015
Weekly Reversal Levels for March 28, 2015Weekly Reversal Levels for March 28, 2015
Weekly Reversal Levels for March 28, 2015LunaticTrader
 
Dividend weekly 21 2013 By http://long-term-investments.blogspot.com
Dividend weekly 21 2013 By http://long-term-investments.blogspot.comDividend weekly 21 2013 By http://long-term-investments.blogspot.com
Dividend weekly 21 2013 By http://long-term-investments.blogspot.comDividend Yield
 
Weekly Reversal Levels for April 18, 2015
Weekly Reversal Levels for April 18, 2015Weekly Reversal Levels for April 18, 2015
Weekly Reversal Levels for April 18, 2015LunaticTrader
 
Dividend weekly 31 2013 By http://long-term-investments.blogspot.com
Dividend weekly 31 2013 By http://long-term-investments.blogspot.comDividend weekly 31 2013 By http://long-term-investments.blogspot.com
Dividend weekly 31 2013 By http://long-term-investments.blogspot.comDividend Yield
 
Lincoln crowne copper gold weekly 08072013 : AUD impact on Sector
Lincoln crowne copper gold weekly  08072013 :  AUD impact on SectorLincoln crowne copper gold weekly  08072013 :  AUD impact on Sector
Lincoln crowne copper gold weekly 08072013 : AUD impact on SectorLincoln Crowne & Company
 
Weekly Reversal Levels for April 11, 2015
Weekly Reversal Levels for April 11, 2015Weekly Reversal Levels for April 11, 2015
Weekly Reversal Levels for April 11, 2015LunaticTrader
 
Weekly Reversal Levels for March 21, 2015
Weekly Reversal Levels for March 21, 2015Weekly Reversal Levels for March 21, 2015
Weekly Reversal Levels for March 21, 2015LunaticTrader
 
Weekly Reversal Levels for April 4, 2015
Weekly Reversal Levels for April 4, 2015Weekly Reversal Levels for April 4, 2015
Weekly Reversal Levels for April 4, 2015LunaticTrader
 
Mejares chap2lab3
Mejares chap2lab3Mejares chap2lab3
Mejares chap2lab3aiz_muah
 
Weekly Reversal Levels for May 16, 2015
Weekly Reversal Levels for May 16, 2015Weekly Reversal Levels for May 16, 2015
Weekly Reversal Levels for May 16, 2015LunaticTrader
 
Weekly Reversal Levels for February 28, 2015
Weekly Reversal Levels for February 28, 2015Weekly Reversal Levels for February 28, 2015
Weekly Reversal Levels for February 28, 2015LunaticTrader
 
Dividend Weekly Stock52 2012 By Thanks to http://long-term-investments.blogsp...
Dividend Weekly Stock52 2012 By Thanks to http://long-term-investments.blogsp...Dividend Weekly Stock52 2012 By Thanks to http://long-term-investments.blogsp...
Dividend Weekly Stock52 2012 By Thanks to http://long-term-investments.blogsp...Dividend Yield
 
Weekly Reversal Levels for February 21, 2015
Weekly Reversal Levels for February 21, 2015Weekly Reversal Levels for February 21, 2015
Weekly Reversal Levels for February 21, 2015LunaticTrader
 
Weekly Reversal Levels for March 14, 2015
Weekly Reversal Levels for March 14, 2015Weekly Reversal Levels for March 14, 2015
Weekly Reversal Levels for March 14, 2015LunaticTrader
 
The Randomness of Returns
The Randomness of ReturnsThe Randomness of Returns
The Randomness of ReturnsRoy Wiley
 
20140501
2014050120140501
20140501paolho
 
Weekly Reversal Levels for January 10, 2015
Weekly Reversal Levels for January 10, 2015Weekly Reversal Levels for January 10, 2015
Weekly Reversal Levels for January 10, 2015LunaticTrader
 
All that Glitters may not be worth it: Gold, A Comparitive Analysis of Gold I...
All that Glitters may not be worth it: Gold, A Comparitive Analysis of Gold I...All that Glitters may not be worth it: Gold, A Comparitive Analysis of Gold I...
All that Glitters may not be worth it: Gold, A Comparitive Analysis of Gold I...CapitalVia Global Research Limited
 

Mais procurados (20)

Weekly Reversal Levels for May 23, 2015
Weekly Reversal Levels for May 23, 2015Weekly Reversal Levels for May 23, 2015
Weekly Reversal Levels for May 23, 2015
 
Weekly Reversal Levels for March 28, 2015
Weekly Reversal Levels for March 28, 2015Weekly Reversal Levels for March 28, 2015
Weekly Reversal Levels for March 28, 2015
 
Dividend weekly 21 2013 By http://long-term-investments.blogspot.com
Dividend weekly 21 2013 By http://long-term-investments.blogspot.comDividend weekly 21 2013 By http://long-term-investments.blogspot.com
Dividend weekly 21 2013 By http://long-term-investments.blogspot.com
 
Weekly Reversal Levels for April 18, 2015
Weekly Reversal Levels for April 18, 2015Weekly Reversal Levels for April 18, 2015
Weekly Reversal Levels for April 18, 2015
 
Dividend weekly 31 2013 By http://long-term-investments.blogspot.com
Dividend weekly 31 2013 By http://long-term-investments.blogspot.comDividend weekly 31 2013 By http://long-term-investments.blogspot.com
Dividend weekly 31 2013 By http://long-term-investments.blogspot.com
 
Lincoln crowne copper gold weekly 08072013 : AUD impact on Sector
Lincoln crowne copper gold weekly  08072013 :  AUD impact on SectorLincoln crowne copper gold weekly  08072013 :  AUD impact on Sector
Lincoln crowne copper gold weekly 08072013 : AUD impact on Sector
 
EPF Fund Performance
EPF Fund PerformanceEPF Fund Performance
EPF Fund Performance
 
Weekly Reversal Levels for April 11, 2015
Weekly Reversal Levels for April 11, 2015Weekly Reversal Levels for April 11, 2015
Weekly Reversal Levels for April 11, 2015
 
Weekly Reversal Levels for March 21, 2015
Weekly Reversal Levels for March 21, 2015Weekly Reversal Levels for March 21, 2015
Weekly Reversal Levels for March 21, 2015
 
Weekly Reversal Levels for April 4, 2015
Weekly Reversal Levels for April 4, 2015Weekly Reversal Levels for April 4, 2015
Weekly Reversal Levels for April 4, 2015
 
Mejares chap2lab3
Mejares chap2lab3Mejares chap2lab3
Mejares chap2lab3
 
Weekly Reversal Levels for May 16, 2015
Weekly Reversal Levels for May 16, 2015Weekly Reversal Levels for May 16, 2015
Weekly Reversal Levels for May 16, 2015
 
Weekly Reversal Levels for February 28, 2015
Weekly Reversal Levels for February 28, 2015Weekly Reversal Levels for February 28, 2015
Weekly Reversal Levels for February 28, 2015
 
Dividend Weekly Stock52 2012 By Thanks to http://long-term-investments.blogsp...
Dividend Weekly Stock52 2012 By Thanks to http://long-term-investments.blogsp...Dividend Weekly Stock52 2012 By Thanks to http://long-term-investments.blogsp...
Dividend Weekly Stock52 2012 By Thanks to http://long-term-investments.blogsp...
 
Weekly Reversal Levels for February 21, 2015
Weekly Reversal Levels for February 21, 2015Weekly Reversal Levels for February 21, 2015
Weekly Reversal Levels for February 21, 2015
 
Weekly Reversal Levels for March 14, 2015
Weekly Reversal Levels for March 14, 2015Weekly Reversal Levels for March 14, 2015
Weekly Reversal Levels for March 14, 2015
 
The Randomness of Returns
The Randomness of ReturnsThe Randomness of Returns
The Randomness of Returns
 
20140501
2014050120140501
20140501
 
Weekly Reversal Levels for January 10, 2015
Weekly Reversal Levels for January 10, 2015Weekly Reversal Levels for January 10, 2015
Weekly Reversal Levels for January 10, 2015
 
All that Glitters may not be worth it: Gold, A Comparitive Analysis of Gold I...
All that Glitters may not be worth it: Gold, A Comparitive Analysis of Gold I...All that Glitters may not be worth it: Gold, A Comparitive Analysis of Gold I...
All that Glitters may not be worth it: Gold, A Comparitive Analysis of Gold I...
 

Destaque

Year end tax issues 2010 cl approved
Year end tax issues 2010 cl approvedYear end tax issues 2010 cl approved
Year end tax issues 2010 cl approvedBennett Jay-Gordon
 
Values Session3 Table C
Values Session3 Table CValues Session3 Table C
Values Session3 Table CArtur Moustafa
 
9 Things You Didn't Know You Could Do with Your Blog WPSLC
9 Things You Didn't Know You Could Do with Your Blog WPSLC9 Things You Didn't Know You Could Do with Your Blog WPSLC
9 Things You Didn't Know You Could Do with Your Blog WPSLCChris Reynolds
 
Benh hoc ung thu
Benh hoc ung thuBenh hoc ung thu
Benh hoc ung thudoctorviet
 

Destaque (7)

Year end tax issues 2010 cl approved
Year end tax issues 2010 cl approvedYear end tax issues 2010 cl approved
Year end tax issues 2010 cl approved
 
Professionals Alliance Group
Professionals Alliance GroupProfessionals Alliance Group
Professionals Alliance Group
 
Max and Jake Gordon
Max and Jake GordonMax and Jake Gordon
Max and Jake Gordon
 
Values Session3 Table C
Values Session3 Table CValues Session3 Table C
Values Session3 Table C
 
9 Things You Didn't Know You Could Do with Your Blog WPSLC
9 Things You Didn't Know You Could Do with Your Blog WPSLC9 Things You Didn't Know You Could Do with Your Blog WPSLC
9 Things You Didn't Know You Could Do with Your Blog WPSLC
 
January Newsletter
January NewsletterJanuary Newsletter
January Newsletter
 
Benh hoc ung thu
Benh hoc ung thuBenh hoc ung thu
Benh hoc ung thu
 

Semelhante a Various Market Returns

Taylor Frigon core growth versus other equity managers through 2 q2010
Taylor Frigon core growth versus other equity managers through 2 q2010Taylor Frigon core growth versus other equity managers through 2 q2010
Taylor Frigon core growth versus other equity managers through 2 q2010dmathisen
 
Presentación Dunas Capital en Valencia (9 de marzo)
Presentación Dunas Capital en Valencia (9 de marzo) Presentación Dunas Capital en Valencia (9 de marzo)
Presentación Dunas Capital en Valencia (9 de marzo) Rankia
 
Performance Watch - Indian Equity & Debt Markets, Mutual Funds (August 2014)
Performance Watch - Indian Equity & Debt Markets, Mutual Funds (August 2014)Performance Watch - Indian Equity & Debt Markets, Mutual Funds (August 2014)
Performance Watch - Indian Equity & Debt Markets, Mutual Funds (August 2014)mintster.in
 
Kedia daily bullion report as on 08052020
Kedia daily bullion report as on 08052020Kedia daily bullion report as on 08052020
Kedia daily bullion report as on 08052020Ajay Kedia
 
Destinations 20 year calendar performance
Destinations 20 year calendar performanceDestinations 20 year calendar performance
Destinations 20 year calendar performanceDon McNeill, ChFC
 
Cibc weekly market insight 1105
Cibc weekly market insight  1105Cibc weekly market insight  1105
Cibc weekly market insight 1105Leo Lee
 
Fundamental Equity Analysis - QMS Global Agriculture FlexIndex - The QMS Advi...
Fundamental Equity Analysis - QMS Global Agriculture FlexIndex - The QMS Advi...Fundamental Equity Analysis - QMS Global Agriculture FlexIndex - The QMS Advi...
Fundamental Equity Analysis - QMS Global Agriculture FlexIndex - The QMS Advi...BCV
 
Fundamental Equity Analysis - S&P 100 Index Components (OEX Index)
Fundamental Equity Analysis - S&P 100 Index Components (OEX Index)Fundamental Equity Analysis - S&P 100 Index Components (OEX Index)
Fundamental Equity Analysis - S&P 100 Index Components (OEX Index)BCV
 
Natural Resource Financing Book
Natural Resource Financing BookNatural Resource Financing Book
Natural Resource Financing BookEquities.com Smith
 
Weekly newsletter equity 14 jan2013
Weekly newsletter equity 14 jan2013Weekly newsletter equity 14 jan2013
Weekly newsletter equity 14 jan2013TheEquicom Advisory
 

Semelhante a Various Market Returns (20)

Taylor Frigon core growth versus other equity managers through 2 q2010
Taylor Frigon core growth versus other equity managers through 2 q2010Taylor Frigon core growth versus other equity managers through 2 q2010
Taylor Frigon core growth versus other equity managers through 2 q2010
 
Presentación Dunas Capital en Valencia (9 de marzo)
Presentación Dunas Capital en Valencia (9 de marzo) Presentación Dunas Capital en Valencia (9 de marzo)
Presentación Dunas Capital en Valencia (9 de marzo)
 
Daily marketstats15apr2013
Daily marketstats15apr2013Daily marketstats15apr2013
Daily marketstats15apr2013
 
Performance Watch - Indian Equity & Debt Markets, Mutual Funds (August 2014)
Performance Watch - Indian Equity & Debt Markets, Mutual Funds (August 2014)Performance Watch - Indian Equity & Debt Markets, Mutual Funds (August 2014)
Performance Watch - Indian Equity & Debt Markets, Mutual Funds (August 2014)
 
06 01 2010 Fx Report
06 01 2010 Fx Report06 01 2010 Fx Report
06 01 2010 Fx Report
 
Daily marketstats14apr2013
Daily marketstats14apr2013Daily marketstats14apr2013
Daily marketstats14apr2013
 
Kedia daily bullion report as on 08052020
Kedia daily bullion report as on 08052020Kedia daily bullion report as on 08052020
Kedia daily bullion report as on 08052020
 
Destinations 20 year calendar performance
Destinations 20 year calendar performanceDestinations 20 year calendar performance
Destinations 20 year calendar performance
 
Super Commodity
Super CommoditySuper Commodity
Super Commodity
 
Cibc weekly market insight 1105
Cibc weekly market insight  1105Cibc weekly market insight  1105
Cibc weekly market insight 1105
 
83841885
8384188583841885
83841885
 
Fundamental Equity Analysis - QMS Global Agriculture FlexIndex - The QMS Advi...
Fundamental Equity Analysis - QMS Global Agriculture FlexIndex - The QMS Advi...Fundamental Equity Analysis - QMS Global Agriculture FlexIndex - The QMS Advi...
Fundamental Equity Analysis - QMS Global Agriculture FlexIndex - The QMS Advi...
 
Fundamental Equity Analysis - S&P 100 Index Components (OEX Index)
Fundamental Equity Analysis - S&P 100 Index Components (OEX Index)Fundamental Equity Analysis - S&P 100 Index Components (OEX Index)
Fundamental Equity Analysis - S&P 100 Index Components (OEX Index)
 
2pager tail
2pager tail2pager tail
2pager tail
 
PSG Asset management
PSG Asset managementPSG Asset management
PSG Asset management
 
Daily marketstats16apr2013
Daily marketstats16apr2013Daily marketstats16apr2013
Daily marketstats16apr2013
 
Natural Resource Financing Book
Natural Resource Financing BookNatural Resource Financing Book
Natural Resource Financing Book
 
lcc asia pacific weekly report 460
lcc asia pacific weekly report 460lcc asia pacific weekly report 460
lcc asia pacific weekly report 460
 
Weekly newsletter equity 14 jan2013
Weekly newsletter equity 14 jan2013Weekly newsletter equity 14 jan2013
Weekly newsletter equity 14 jan2013
 
Daily marketstats24may2013
Daily marketstats24may2013Daily marketstats24may2013
Daily marketstats24may2013
 

Último

project management information system lecture notes
project management information system lecture notesproject management information system lecture notes
project management information system lecture notesongomchris
 
Unveiling Business Expansion Trends in 2024
Unveiling Business Expansion Trends in 2024Unveiling Business Expansion Trends in 2024
Unveiling Business Expansion Trends in 2024Champak Jhagmag
 
SBP-Market-Operations and market managment
SBP-Market-Operations and market managmentSBP-Market-Operations and market managment
SBP-Market-Operations and market managmentfactical
 
Call Girls Near Golden Tulip Essential Hotel, New Delhi 9873777170
Call Girls Near Golden Tulip Essential Hotel, New Delhi 9873777170Call Girls Near Golden Tulip Essential Hotel, New Delhi 9873777170
Call Girls Near Golden Tulip Essential Hotel, New Delhi 9873777170Sonam Pathan
 
Overview of Inkel Unlisted Shares Price.
Overview of Inkel Unlisted Shares Price.Overview of Inkel Unlisted Shares Price.
Overview of Inkel Unlisted Shares Price.Precize Formely Leadoff
 
PMFBY , Pradhan Mantri Fasal bima yojna
PMFBY , Pradhan Mantri  Fasal bima yojnaPMFBY , Pradhan Mantri  Fasal bima yojna
PMFBY , Pradhan Mantri Fasal bima yojnaDharmendra Kumar
 
Stock Market Brief Deck FOR 4/17 video.pdf
Stock Market Brief Deck FOR 4/17 video.pdfStock Market Brief Deck FOR 4/17 video.pdf
Stock Market Brief Deck FOR 4/17 video.pdfMichael Silva
 
Kempen ' UK DB Endgame Paper Apr 24 final3.pdf
Kempen ' UK DB Endgame Paper Apr 24 final3.pdfKempen ' UK DB Endgame Paper Apr 24 final3.pdf
Kempen ' UK DB Endgame Paper Apr 24 final3.pdfHenry Tapper
 
government_intervention_in_business_ownership[1].pdf
government_intervention_in_business_ownership[1].pdfgovernment_intervention_in_business_ownership[1].pdf
government_intervention_in_business_ownership[1].pdfshaunmashale756
 
GOODSANDSERVICETAX IN INDIAN ECONOMY IMPACT
GOODSANDSERVICETAX IN INDIAN ECONOMY IMPACTGOODSANDSERVICETAX IN INDIAN ECONOMY IMPACT
GOODSANDSERVICETAX IN INDIAN ECONOMY IMPACTharshitverma1762
 
AnyConv.com__FSS Advance Retail & Distribution - 15.06.17.ppt
AnyConv.com__FSS Advance Retail & Distribution - 15.06.17.pptAnyConv.com__FSS Advance Retail & Distribution - 15.06.17.ppt
AnyConv.com__FSS Advance Retail & Distribution - 15.06.17.pptPriyankaSharma89719
 
magnetic-pensions-a-new-blueprint-for-the-dc-landscape.pdf
magnetic-pensions-a-new-blueprint-for-the-dc-landscape.pdfmagnetic-pensions-a-new-blueprint-for-the-dc-landscape.pdf
magnetic-pensions-a-new-blueprint-for-the-dc-landscape.pdfHenry Tapper
 
Bladex 1Q24 Earning Results Presentation
Bladex 1Q24 Earning Results PresentationBladex 1Q24 Earning Results Presentation
Bladex 1Q24 Earning Results PresentationBladex
 
Call Girls Near Delhi Pride Hotel, New Delhi|9873777170
Call Girls Near Delhi Pride Hotel, New Delhi|9873777170Call Girls Near Delhi Pride Hotel, New Delhi|9873777170
Call Girls Near Delhi Pride Hotel, New Delhi|9873777170Sonam Pathan
 
Market Morning Updates for 16th April 2024
Market Morning Updates for 16th April 2024Market Morning Updates for 16th April 2024
Market Morning Updates for 16th April 2024Devarsh Vakil
 
《加拿大本地办假证-寻找办理Dalhousie毕业证和达尔豪斯大学毕业证书的中介代理》
《加拿大本地办假证-寻找办理Dalhousie毕业证和达尔豪斯大学毕业证书的中介代理》《加拿大本地办假证-寻找办理Dalhousie毕业证和达尔豪斯大学毕业证书的中介代理》
《加拿大本地办假证-寻找办理Dalhousie毕业证和达尔豪斯大学毕业证书的中介代理》rnrncn29
 
Role of Information and technology in banking and finance .pptx
Role of Information and technology in banking and finance .pptxRole of Information and technology in banking and finance .pptx
Role of Information and technology in banking and finance .pptxNarayaniTripathi2
 
Governor Olli Rehn: Dialling back monetary restraint
Governor Olli Rehn: Dialling back monetary restraintGovernor Olli Rehn: Dialling back monetary restraint
Governor Olli Rehn: Dialling back monetary restraintSuomen Pankki
 
原版1:1复刻堪萨斯大学毕业证KU毕业证留信学历认证
原版1:1复刻堪萨斯大学毕业证KU毕业证留信学历认证原版1:1复刻堪萨斯大学毕业证KU毕业证留信学历认证
原版1:1复刻堪萨斯大学毕业证KU毕业证留信学历认证jdkhjh
 
212MTAMount Durham University Bachelor's Diploma in Technology
212MTAMount Durham University Bachelor's Diploma in Technology212MTAMount Durham University Bachelor's Diploma in Technology
212MTAMount Durham University Bachelor's Diploma in Technologyz xss
 

Último (20)

project management information system lecture notes
project management information system lecture notesproject management information system lecture notes
project management information system lecture notes
 
Unveiling Business Expansion Trends in 2024
Unveiling Business Expansion Trends in 2024Unveiling Business Expansion Trends in 2024
Unveiling Business Expansion Trends in 2024
 
SBP-Market-Operations and market managment
SBP-Market-Operations and market managmentSBP-Market-Operations and market managment
SBP-Market-Operations and market managment
 
Call Girls Near Golden Tulip Essential Hotel, New Delhi 9873777170
Call Girls Near Golden Tulip Essential Hotel, New Delhi 9873777170Call Girls Near Golden Tulip Essential Hotel, New Delhi 9873777170
Call Girls Near Golden Tulip Essential Hotel, New Delhi 9873777170
 
Overview of Inkel Unlisted Shares Price.
Overview of Inkel Unlisted Shares Price.Overview of Inkel Unlisted Shares Price.
Overview of Inkel Unlisted Shares Price.
 
PMFBY , Pradhan Mantri Fasal bima yojna
PMFBY , Pradhan Mantri  Fasal bima yojnaPMFBY , Pradhan Mantri  Fasal bima yojna
PMFBY , Pradhan Mantri Fasal bima yojna
 
Stock Market Brief Deck FOR 4/17 video.pdf
Stock Market Brief Deck FOR 4/17 video.pdfStock Market Brief Deck FOR 4/17 video.pdf
Stock Market Brief Deck FOR 4/17 video.pdf
 
Kempen ' UK DB Endgame Paper Apr 24 final3.pdf
Kempen ' UK DB Endgame Paper Apr 24 final3.pdfKempen ' UK DB Endgame Paper Apr 24 final3.pdf
Kempen ' UK DB Endgame Paper Apr 24 final3.pdf
 
government_intervention_in_business_ownership[1].pdf
government_intervention_in_business_ownership[1].pdfgovernment_intervention_in_business_ownership[1].pdf
government_intervention_in_business_ownership[1].pdf
 
GOODSANDSERVICETAX IN INDIAN ECONOMY IMPACT
GOODSANDSERVICETAX IN INDIAN ECONOMY IMPACTGOODSANDSERVICETAX IN INDIAN ECONOMY IMPACT
GOODSANDSERVICETAX IN INDIAN ECONOMY IMPACT
 
AnyConv.com__FSS Advance Retail & Distribution - 15.06.17.ppt
AnyConv.com__FSS Advance Retail & Distribution - 15.06.17.pptAnyConv.com__FSS Advance Retail & Distribution - 15.06.17.ppt
AnyConv.com__FSS Advance Retail & Distribution - 15.06.17.ppt
 
magnetic-pensions-a-new-blueprint-for-the-dc-landscape.pdf
magnetic-pensions-a-new-blueprint-for-the-dc-landscape.pdfmagnetic-pensions-a-new-blueprint-for-the-dc-landscape.pdf
magnetic-pensions-a-new-blueprint-for-the-dc-landscape.pdf
 
Bladex 1Q24 Earning Results Presentation
Bladex 1Q24 Earning Results PresentationBladex 1Q24 Earning Results Presentation
Bladex 1Q24 Earning Results Presentation
 
Call Girls Near Delhi Pride Hotel, New Delhi|9873777170
Call Girls Near Delhi Pride Hotel, New Delhi|9873777170Call Girls Near Delhi Pride Hotel, New Delhi|9873777170
Call Girls Near Delhi Pride Hotel, New Delhi|9873777170
 
Market Morning Updates for 16th April 2024
Market Morning Updates for 16th April 2024Market Morning Updates for 16th April 2024
Market Morning Updates for 16th April 2024
 
《加拿大本地办假证-寻找办理Dalhousie毕业证和达尔豪斯大学毕业证书的中介代理》
《加拿大本地办假证-寻找办理Dalhousie毕业证和达尔豪斯大学毕业证书的中介代理》《加拿大本地办假证-寻找办理Dalhousie毕业证和达尔豪斯大学毕业证书的中介代理》
《加拿大本地办假证-寻找办理Dalhousie毕业证和达尔豪斯大学毕业证书的中介代理》
 
Role of Information and technology in banking and finance .pptx
Role of Information and technology in banking and finance .pptxRole of Information and technology in banking and finance .pptx
Role of Information and technology in banking and finance .pptx
 
Governor Olli Rehn: Dialling back monetary restraint
Governor Olli Rehn: Dialling back monetary restraintGovernor Olli Rehn: Dialling back monetary restraint
Governor Olli Rehn: Dialling back monetary restraint
 
原版1:1复刻堪萨斯大学毕业证KU毕业证留信学历认证
原版1:1复刻堪萨斯大学毕业证KU毕业证留信学历认证原版1:1复刻堪萨斯大学毕业证KU毕业证留信学历认证
原版1:1复刻堪萨斯大学毕业证KU毕业证留信学历认证
 
212MTAMount Durham University Bachelor's Diploma in Technology
212MTAMount Durham University Bachelor's Diploma in Technology212MTAMount Durham University Bachelor's Diploma in Technology
212MTAMount Durham University Bachelor's Diploma in Technology
 

Various Market Returns

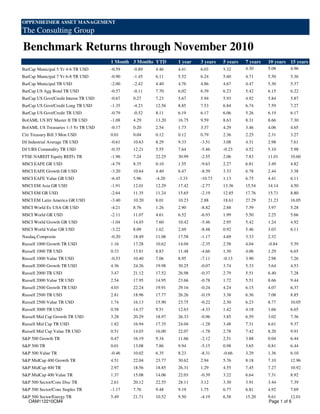
  • 1. OPPENHEIMER ASSET MANAGEMENT The Consulting Group Benchmark Returns through November 2010 1 Month 3 Months YTD 1 year 3 years 5 years 7 years 10 years 15 years BarCap Municipal 5 Yr 4-6 TR USD -0.59 -0.89 4.46 4.41 6.03 5.32 4.30 5.08 4.96 BarCap Municipal 7 Yr 6-8 TR USD -0.90 -1.45 6.11 5.52 6.24 5.60 4.71 5.50 5.36 BarCap Municipal TR USD -2.00 -2.42 4.40 4.76 4.86 4.67 4.47 5.30 5.37 BarCap US Agg Bond TR USD -0.57 -0.11 7.70 6.02 6.39 6.23 5.42 6.15 6.22 BarCap US Govt/Credit Interm TR USD -0.67 0.27 7.23 5.67 5.94 5.93 4.92 5.84 5.87 BarCap US Govt/Credit Long TR USD -1.35 -4.23 12.56 8.85 7.53 6.84 6.74 7.59 7.27 BarCap US Govt/Credit TR USD -0.79 -0.52 8.11 6.19 6.17 6.06 5.26 6.19 6.17 BofAML US HY Master II TR USD -1.08 4.29 13.20 16.75 9.59 8.63 8.31 8.66 7.30 BofAML US Treasuries 1-3 Yr TR USD -0.17 0.20 2.54 1.73 3.37 4.29 3.46 4.06 4.65 Citi Treasury Bill 3 Mon USD 0.01 0.04 0.12 0.12 0.79 2.36 2.25 2.31 3.27 DJ Industrial Average TR USD -0.61 10.63 8.29 9.33 -3.51 3.08 4.31 2.98 7.61 DJ UBS Commodity TR USD -0.35 12.21 5.55 7.64 -5.46 -0.23 4.52 5.10 5.98 FTSE NAREIT Equity REITs TR -1.96 7.24 22.25 30.99 -2.55 2.06 7.83 11.01 10.60 MSCI EAFE GR USD -4.79 8.35 0.10 1.55 -9.63 2.27 6.81 3.49 4.82 MSCI EAFE Growth GR USD -3.20 10.64 4.40 6.47 -8.59 3.33 6.78 2.44 3.38 MSCI EAFE Value GR USD -6.45 5.96 -4.20 -3.33 -10.73 1.13 6.75 4.41 6.11 MSCI EM Asia GR USD -1.91 12.01 12.29 17.42 -2.77 13.36 15.54 14.14 4.50 MSCI EM GR USD -2.64 11.35 11.24 15.65 -2.19 12.85 17.76 15.71 8.80 MSCI EM Latin America GR USD -3.40 10.20 8.01 10.23 2.88 18.61 27.29 21.23 16.05 MSCI World Ex USA GR USD -4.21 8.76 1.26 2.90 -8.82 2.88 7.39 3.97 5.28 MSCI World GR USD -2.11 11.07 4.61 6.52 -6.93 1.99 5.50 2.25 5.66 MSCI World Growth GR USD -1.04 14.03 7.60 10.42 -5.46 2.95 5.42 1.24 4.92 MSCI World Value GR USD -3.22 8.09 1.62 2.69 -8.48 0.92 5.46 3.03 6.11 Nasdaq Composite -0.20 18.49 11.06 17.58 -1.17 4.69 3.33 2.32 Russell 1000 Growth TR USD 1.16 17.28 10.62 14.04 -2.35 2.58 4.04 -0.84 5.39 Russell 1000 TR USD 0.33 13.81 8.83 11.48 -4.66 1.30 4.06 1.29 6.65 Russell 1000 Value TR USD -0.53 10.40 7.06 8.95 -7.11 -0.13 3.90 2.98 7.26 Russell 2000 Growth TR USD 4.36 24.26 19.98 30.25 -0.07 3.74 5.33 3.64 4.53 Russell 2000 TR USD 3.47 21.12 17.52 26.98 -0.37 2.79 5.51 6.40 7.28 Russell 2000 Value TR USD 2.54 17.95 14.95 23.66 -0.78 1.72 5.51 8.66 9.44 Russell 2500 Growth TR USD 4.03 22.24 19.91 29.16 -0.24 4.24 6.15 4.07 6.37 Russell 2500 TR USD 2.81 18.96 17.77 26.26 -0.19 3.38 6.36 7.08 8.85 Russell 2500 Value TR USD 1.74 16.13 15.90 23.75 -0.22 2.30 6.23 8.77 10.05 Russell 3000 TR USD 0.58 14.37 9.51 12.63 -4.33 1.42 4.18 1.66 6.65 Russell Mid Cap Growth TR USD 3.28 20.29 18.97 26.33 -0.96 3.85 6.59 3.02 7.36 Russell Mid Cap TR USD 1.82 16.94 17.35 24.04 -1.28 3.48 7.31 6.61 9.37 Russell Mid Cap Value TR USD 0.51 14.03 16.00 22.07 -1.78 2.78 7.42 8.20 9.91 S&P 500 Growth TR 0.47 16.19 9.34 11.66 -2.12 2.51 3.88 0.04 6.44 S&P 500 TR 0.01 13.08 7.86 9.94 -5.15 0.98 3.65 0.81 6.44 S&P 500 Value TR -0.46 10.02 6.35 8.23 -8.31 -0.66 3.29 1.36 6.10 S&P MidCap 400 Growth TR 4.51 22.04 23.77 30.62 2.94 5.76 8.18 7.10 12.96 S&P MidCap 400 TR 2.97 18.56 18.85 26.31 1.29 4.55 7.45 7.27 10.92 S&P MidCap 400 Value TR 1.37 15.08 14.06 22.03 -0.39 3.22 6.64 7.31 8.92 S&P 500 Sector/Cons Disc TR 2.61 20.12 22.55 28.11 3.12 3.30 3.91 3.44 7.39 S&P 500 Sector/Cons Staples TR -1.17 7.76 9.48 9.19 1.75 6.77 6.81 4.92 7.69 S&P 500 Sector/Energy TR 5.49 21.71 10.52 9.50 -4.19 6.58 15.20 9.61 12.01 OAM112210CM4 Page 1 of 6
  • 2. S&P 500 Sector/Financials TR -0.67 6.88 1.26 -0.31 -20.55 -12.41 -6.23 -3.85 4.10 S&P 500 Sector/Health Care TR -2.87 8.15 -1.51 0.53 -4.08 1.63 2.67 -0.41 7.63 S&P 500 Sector/Industrials TR 1.11 15.61 17.63 19.15 -5.29 1.72 4.96 1.98 7.11 S&P 500 Sector/Information Technology TR -1.64 17.44 4.68 10.56 -0.77 3.34 3.71 -2.65 7.17 S&P 500 Sector/Materials TR 1.12 16.21 10.73 12.51 -3.32 5.99 7.80 9.07 6.47 S&P 500 Sector/Telecom Services TR -1.43 7.69 10.36 15.49 -4.83 4.28 6.73 -1.90 2.65 S&P 500 Sector/Utilities TR -3.03 0.94 2.30 7.97 -6.58 3.50 8.94 1.40 6.01 Wilshire 5000 Total Mkt TR USD 0.53 14.16 9.66 12.61 -4.26 1.57 4.38 2.01 6.67 Data Source: Morningstar All index performance marked as “TR” is “Total Return” and is calculated based on the daily reinvestment of dividends on the ex-dividend date. Indices marked “GR”, which stands for “Gross Return”, also use the Total Return calculation described. The information and statistical data contained herein have been obtained from sources we believe to be reliable. Indices are not available for direct investment and do not reflect the costs of buying or selling securities or investment management fees. Please read the following Glossary of Indexes for important information about each index. OAM112210CM4 Page 2 of 6
  • 3. Glossary of Indexes Indices are unmanaged, hypothetical portfolios of securities that are often used as a benchmark in evaluating the relative performance of a particular investment. An index should only be compared with a mandate that has a similar investment objective. An Index is not available for direct investment, and does not reflect any of the costs associated with buying and selling individual securities or management fees. BofA Merrill Lynch US Treasuries 1-3 Year Index – A subset of the BofA Merrill Lynch US Treasury Index including all securities with a remaining term to final maturity less than 3 years. The BofA Merrill Lynch US Treasury Index tracks the performance of US dollar denominated US Treasury debt issued in the US domestic market. Qualifying securities must have an investment grade rating (based on an average of Moody’s, S&P and Fitch). Barclays Capital U.S. Government/Credit Bond Index - The U.S. Government/Credit Bond Index is the non-securitized component of the U.S. Aggregate Index . Specifically, the Government/Credit Index includes treasuries (i.e., public obligations of the US Treasury that have remaining maturities of more than 1 year), Government-Related issues (i.e. agency, sovereign, supranational, and local authority debt) and Corporates ( publicly issued US corporate and Yankee debentures and secured notes that meet specified maturity, liquidity, and quality requirements). All issues in the Government/Credit Index are rated Baaa3/BBB-/BBB- or higher (using the middle rating of Moody’s, S&P, and Fitch, respectively) and have at least one year to maturity and have an outstanding par value of at least $250 million. Barclays Capital U.S. Government/Credit Intermediate Bond Index - A subgroup of the Barclays Government/Credit Bond Index that is based on maturity with greater than 1 to 10 years. Barclays Capital U.S. Govt/Credit Long Index - A subset of the Barclays US Government/Credit Index that is based on maturity with at least 10 years. Barclays Capital U.S. Aggregate Bond Index - The U.S. Aggregate Index covers the USD-denominated, investment-grade, fixed-rate, taxable bond market of SEC-registered securities. The Index includes bonds from the Treasury, Government-Related, Corporate, MBS (agency fixed-rate and hybrid ARM pass throughs), ABS, and CMBS sectors. The U.S. Aggregate Index is a component of the U.S. Universal Index in its entirety. The index was created in 1986 with index history backfilled to January 1, 1976. All issues in the Aggregate Index are rated Baaa3/BBB-/BBB- or higher (using the middle rating of Moody’s, S&P, and Fitch, respectively) and have at least one year to maturity and have an outstanding par value of at least $250 million. Barclays Capital U.S. Municipal Bond - The U.S. Municipal Indices cover the USD-denominated long-term tax exempt bond market. The index has four main sectors: state and local general obligation bonds, revenue bonds, insured bonds and prerefunded bonds. It is generally representative of the broad market for tax-exempt bonds. The Index is comprised of investment-grade, tax-exempt, and fixed-rate bonds. All issues in the Barclays Muni Index are rated Baa or higher, have at least one year to maturity and an outstanding par value of at least $7 million.. Barclays Capital U.S 5-Year Municipal Bond Index (Barclays Muni 5yr): The Index, representing a subset of the Barclays Muni, is comprised of investment-grade, tax-exempt and fixed-rate bonds with a minimum credit rating of Baa and a maturity range typically between 4 to 6 years. All issues in the Barclays Muni 5yr Index have at least one year to maturity and an outstanding par value of at least $5 million. The Barclays Muni 5 yr may have a shorter maturity and duration than the Barclays Muni Index. Barclays Capital U.S. 7-Year Municipal Bond Index - The Index, representing a subset of the Barclays Muni, is comprised of investment- grade, tax-exempt and fixed-rate bonds with a minimum credit rating of Baa and a maturity range typically between 6 to 8 years. All issues in the Barclays Muni 7yr Index have at least one year to maturity and an outstanding par value of at least $5 million. The Barclays Muni 7yr may have a shorter maturity and duration than the Barclays Muni Index. Citigroup 3-month T-bill Index - This is an unmanaged index of three-month Treasury bills that measures monthly return equivalents of yield averages that are not marked to market. The Three-Month Treasury Bill Indexes consist of the last three three-month Treasury bill issues. Dow Jones Industrial Average Index - The oldest continuing US market Index, includes 30 “blue-chip” US stocks selected for their history of successful growth and wide interest among investors. It is called an average because it originally was computed by adding up stock prices and dividing by the number of stocks. This methodology remains the same today, but the devisor has been changed to preserve historical continuity. Dow Jones AIG Commodity Index - A futures commodity index listing 19 different commodities in the United States. It is designed to be a diversified and liquid index tracking the performance of physical commodities in the United States. It weights the commodities listed according to liquidity and dollar-adjusted production data. However, unlike other commodity indices, the DJ-AIGCI sets limits on its weighting so as to maintain its own diversification. It is a rolling index, which means that futures near their delivery dates must be sold so as to avoid delivery of the underlying. OAM112210CM4 Page 3 of 6
  • 4. BofA ML High-Yield Master Index - A capitalization-weighted Index that provides a broad measure of the performance of the non- investment grade US domestic bond market. The Index is limited to US domestic and Yankee markets. Bonds must have greater than 1 year remaining to final maturity, at least $100 million face outstanding, be US dollar pay, have a fixed coupon schedule with a credit rating below investment grade not in default. FTSE National Association of Real Estate Investment Trusts (NAREIT) Equity Index - An Index consisting of all tax qualified real estate investment trusts whose common shares are listed on the NYSE, AMEX and the NASDAQ. The Index is capitalization-weighted and all REITs must have at least 75% of their gross invested book assets invested directly or indirectly in the equity ownership of real estate. Morgan Stanley Capital International, Europe, Australasia, Far East Index (MSCI EAFE) - An Index in US dollars based on the share price of companies listed on stock exchanges in 21 developed countries outside of North America. This Index is created by aggregating the 21 different country Indices, all of which are created separately. It is considered to be generally representative of overseas stock markets. MSCI EAFE Value Index - An Index in US dollars representing approximately half of the total market capitalization of the MSCI EAFE Index. The companies in this Index tend to have lower price-to-book ratios than the MSCI EAFE Growth Index. The MSCI EAFE Value is calculated using the constituents of the Value Indices of the 21 developed countries outside of North America composing the MSCI EAFE Index. MSCI EAFE Growth Index - An Index in US dollars representing approximately half of the total market capitalization of the MSCI EAFE Index. The companies in this Index tend to have higher price-to-book ratios than the MSCI EAFE Value Index. The MSCI EAFE Growth Index is calculated using the constituents of the Growth Indices of the 21 developed countries outside of North America composing the MSCI EAFE Index. Morgan Stanley Capital International, World Index (MSCI World) - An Index in US dollars based on the share price of companies listed on stock exchanges in 23 developed countries including the US and Canada. This Index is created by aggregating the 23 different country Indices, all of which are created separately. It is considered to be generally representative of domestic and overseas stock markets. MSCI World Value Index - An Index in US dollars representing approximately half of the total market capitalization of the MSCI World Index. The companies in this Index tend to have lower price-to-book ratios than the MSCI World Growth Index. The MSCI World Value is calculated using the constituents of the Value Indices of the 23 developed countries including the US and Canada that compose the MSCI World Index. MSCI World Growth Index - An Index in US dollars representing approximately half of the total market capitalization of the MSCI World Index. The companies in this Index tend to have higher price-to-book ratios than the MSCI World Value Index. The MSCI World Growth is calculated using the constituents of the Growth Indices of the 23 developed countries including the US and Canada that compose the MSCI World Index. Morgan Stanley Capital International, World ex-US Index (World ex-US) - An Index in US dollars based on the share price of companies listed on stock exchanges in 22 developed countries excluding the US. This Index is created by aggregating the 22 different country Indices, all of which are created separately. It is considered to be generally representative of overseas stock markets. MSCI Emerging Markets Free Index (MSCI EMF) - A market capitalization weighted Index in US dollars representing 26 emerging markets in the world. This Index is created by aggregating the 26 different country Indices, all of which are created separately. It is considered to be generally representative of emerging markets. MSCI EM Asia Index - The MSCI Emerging Markets Asia Index is a free float-adjusted market capitalization index that is designed to measure equity market performance of emerging markets. As of May 27, 2010 the MSCI Emerging Markets Index consisted of the following 21 emerging market country indices: China, India, Indonesia, Korea, Malasya, Philippines, Taiwan, Thailand. NASDAQ Composite - A market-value weighted index of all common stocks listed on Nasdaq. The index is used mainly to track technology stocks, and thus it is not a good indicator of the market as a whole. Russell 1000 Index - Measures the performance of the 1,000 largest companies in the Russell 3000 Index. Frank Russell Co. ranks the US common stocks from largest to smallest market capitalization at each annual reconstitution period. The Russell 1000 Index represents the vast majority of the total market capitalization of the Russell 3000 Index. It is considered to be generally representative of US Equity Large Cap performance. Russell 1000 Growth Index - Measures the performance of the Russell 1000 companies with higher price-to-book ratios and higher forecasted growth values. Russell 1000 Value Index - Measures the performance of the Russell 1000 companies with lower price-to-book ratios and lower forecasted growth values. OAM112210CM4 Page 4 of 6
  • 5. Russell 2000 Index - Measures the performance of the 2,000 smallest companies in the Russell 3000 Index. Frank Russell Co. ranks the US common stocks from largest to smallest market capitalization at each annual reconstitution period. The Russell 2000 Index represents a very small percentage of the total market capitalization of the Russell 3000 Index. It is considered to be generally representative of US Equity Small and Mid Cap performance. Russell 2000 Growth Index - Measures the performance of those Russell 2000 companies with higher price-to-book ratios and higher forecasted growth values. Russell 2000 Value Index - Measures the performance of those Russell 2000 companies with lower price-to-book ratios and lower forecasted growth values. Russell 2500 Index - Measures the performance of the 2,500 smallest companies in the Russell 3000 Index. Frank Russell Co. ranks the US common stocks from largest to smallest market capitalization at each annual reconstitution period. The Russell 2500 Index represents a small percentage of the total market capitalization of the Russell 3000 Index. It is considered to be generally representative of US Equity Small and Mid Cap performance. Russell 2500 Growth Index - Measures the performance of those Russell 2500 companies with higher price-to-book ratios and higher forecasted growth values than those in the Russell 2500 Value Index. Russell 2500 Value Index - Measures the performance of those Russell 2500 companies with lower price-to-book ratios and lower forecasted growth values than those in the Russell 2500 Growth Index. Russell 3000 Index - Measures the performance of the 3,000 largest US companies based on total market capitalization, which represents nearly the entire market capitalization of the investable US equity market. Frank Russell Co. ranks the US common stocks from largest to smallest market capitalization at each annual reconstitution period. Russell Midcap Index - Measures the performance of the mid-cap segment of the US equity universe. The Russell Midcap Index includes the smallest 800 securities in the Russell 1000. Russell Midcap Growth Index - Contains those Russell Midcap (800) securities with a greater-than-average growth orientation. Companies in this index tend to exhibit higher price-to-book and price-earnings ratios, lower dividend yields and higher forecasted growth values than the Value universe. Russell Midcap Value Index - Contains those Russell Midcap (800) securities with a less-than-average growth orientation. Securities in this index generally have lower price-to-book and price-earnings ratios, higher dividend yields and lower forecasted growth values than the Growth universe. S&P 500 Index - The S&P 500 Index consists of 500 stocks chosen for market size, liquidity, and industry group representation. It is a market value weighted Index (stock price times number of shares outstanding), with each stock’s weight in the Index proportionate to its market value. The Index is one of the most widely used benchmarks of US Equity Large Cap performance. S&P 500/Citigroup Growth Index - Companies in the S&P 500 Index are split into two groups based on price-to-book ratios to create growth and value Indices. The Growth Index contains those with higher price-to-book ratios and represents approximately 50% of the total market capitalization of the Index. S&P 500/Citigroup Value Index - Companies in the S&P 500 Index are split into two groups based on price-to-book ratios to create growth and value Indices. The Value Index contains those with lower price-to-book ratios and represents approximately 50% of the total market capitalization of the Index. S&P Midcap 400 Index (S&P Midcap): Portfolio characteristics of the S&P Midcap 400 Index consist of 400 domestic stocks chosen for market size, liquidity, and industry group representation. It is a market value weighted Index and measures the performance of the mid-size company segment of the U.S market. S&P Midcap 400/Citigroup Growth Index - Constructed by dividing the stocks in the S&P Midcap 400 Index according to price-to-book ratios. The Growth Index contains stocks with higher price-to-book ratios than the Value Index. S&P Midcap 400/Citigroup Value Index - Constructed by dividing the stocks in the S&P Midcap 400 Index according to price-to-book ratios. The Value Index contains stocks with lower price-to-book ratios than the Growth Index. S&P 500 Sector/Consumer Discretionary Index - The S&P 500 Sector/Consumer Discretionary Index consists of stocks chosen for their representation in the Consumer Discretionary industry. The companies in the index tend to be the most sensitive to economic cycles. Manufacturing companies include automative, household durable goods, textiles and apparel, and leisure equipment. Service companies include hotels, restaurants/leisure facilities, media production and services, consumer retailing and services and education services. It is a market value weighted Index (stock price times number of shares outstanding), with each stock’s weight in the Index proportionate to its market value. OAM112210CM4 Page 5 of 6
  • 6. S&P 500 Sector/Consumer Staples Index - The S&P 500 Sector/Consumer Staples Index consists of stocks chosen for their representation in the Consumer Staples industry. The companies in the index tend to be the less sensitive to economic cycles. They include manufacturers and distributors of food, beverages and tobacco, and producers of non-durable household goods and personal products; also food and drug retailing companies. It is a market value weighted Index (stock price times number of shares outstanding), with each stock’s weight in the Index proportionate to its market value. S&P 500 Sector/Energy Index - The S&P 500 Sector/Energy Index consists of stocks chosen for their representation in the Energy industry. The companies in the index are dominated by either the construction ofr provision of oil rigs, drilling equipment and other energy-related service and equipment or the exploration, production, marketing, refining and/or transportation of oil and gas products, coal and consumable fuels. It is a market value weighted Index (stock price times number of shares outstanding), with each stock’s weight in the Index proportionate to its market value. S&P 500 Sector/Financials TR Index - The S&P 500 Sector/Financials Index consists of stocks chosen for their representation in the Financials industry. The companies in the index are involved in activities such as banking, consumer finance, investment banking and brokerage, asset management, insurance and investments, and real estate, including REITs. It is a market value weighted Index (stock price times number of shares outstanding), with each stock’s weight in the Index proportionate to its market value. S&P 500 Sector/Healthcare TR Index - The S&P 500 Sector/Healthcare Index consists of stocks chosen for their representation in the Healthcare industry. The companies in the index are involved in health care equpiment and supplies, health care-related services, or in the research, development, production and marketing of pharmaceuticals and biotechnology products. It is a market value weighted Index (stock rice times number of shares outstanding), with each stock’s weight in the Index proportionate to its market value. S&P 500 Sector/Industrials TR Index - The S&P 500 Sector/Industrials Index consists of stocks chosen for their representation in the Industrials industry. Companies include those that manufacture and distribute capital goods (i.e. aerospace/defense, construction, engineering and building products, electrical equipment and industrial machinery); provide commercial services and supplies (i.e. printing, employment, environmental/office services); or provide transportation services (i.e. airlines, couriers, marine, road/rail and transportation infrastructure). It is a market value weighted Index (stock rice times number of shares outstanding), with each stock’s weight in the Index proportionate to its market value. S&P 500 Sector/Information Technology TR Index - The S&P 500 Sector/Information Technology Index consists of stocks chosen for their representation in the Info Tech industry. Companies considered are involved in technology software and services amd technology hardware and equipment. It is a market value weighted Index (stock rice times number of shares outstanding), with each stock’s weight in the Index proportionate to its market value. S&P 500 Sector/Materials TR Index - The S&P 500 Sector/Materials Index consists of stocks chosen for their representation in the Materials industry. These include companies that manufacture chemicals, construction materials, glass, paper, forest products and related packaging products, metals, minerals and minig companies, including steel producers. It is a market value weighted Index (stock rice times number of shares outstanding), with each stock’s weight in the Index proportionate to its market value. S&P 500 Sector/Telecommunication Services TR Index - The S&P 500 Sector/Telecom Services Index consists of stocks chosen for their representation in the Telecom industry. The companies in the index are involved in health care equpiment and supplies, health care-related services, or in the research, development, production and marketing of pharmaceuticals and biotechnology products. It is a market value weighted Index (stock rice times number of shares outstanding), with each stock’s weight in the Index proportionate to its market value. S&P 500 Sector/Utilities TR Index - The S&P 500 Sector/Utilities Index consists of stocks chosen for their representation in the Utilities industry. Companies considered include electric, gas or water utilities, or companies that operate as independent prducers and/or distributors of power. It is a market value weighted Index (stock rice times number of shares outstanding), with each stock’s weight in the Index proportionate to its market value. Wilshire 5000 - A comprehensive market-capitalization-weighted index composed of over 6,500 stocks. Stocks traded on the New York Stock Exchange represent approximately 77% of the value of the index. This report is intended for informational purposes only. The information and statistical data contained herein have been obtained from sources we believe to be reliable. No part of this report may be reproduced in any manner without the written permission of Oppenheimer Asset Management or any of its affiliates. Any securities discussed should not be construed as a recommendation to buy or sell and there is no guarantee that these securities will be held for a client’s account nor should it be assumed that they were or will be profitable. The Consulting Group is a division of Oppenheimer Asset Management. Oppenheimer Asset Management is the name by which Oppenheimer Asset Management Inc. (“OAM”) does business. OAM is an indirect, wholly owned subsidiary of Oppenheimer Holdings Inc., which is also the indirect parent of Oppenheimer & Co. Inc. (“Oppenheimer”). Oppenheimer is a registered investment adviser and broker dealer. Securities are offered through Oppenheimer. OAM112210CM4 OAM112210CM4 Page 6 of 6