SlideShare uma empresa Scribd logo
1 de 3
Baixar para ler offline
MARKET ACTION REPORT                                                                                                                                                                         December 2009
                                                                                                                                 David A. Cohen
MLS Area: 386 - Hopkins                                                                                                          Realtor
                                                                                                                                 612-819-4077
                                                                                                                                 www.EquityDefender.com

                                                                                                                                      Trending versus*:                                                  Trending versus*:
Market Profile & Trends Overview                                                                              Month                   LM   L3M PYM                 LY                    YTD           Prior YTD             Prior Year
Median List Price of all Current Listings                                                             $242,200
Average List Price of all Current Listings                                                            $323,060
December Median Sales Price                                                                           $171,000                                                                  $223,450
December Average Sales Price                                                                          $157,750                                                                  $238,147
Total Properties Currently for Sale (Inventory)                                                             30
December Number of Properties Sold                                                                            4                                                                          96
December Average Days on Market (Solds)                                                                      71                                                                          69
Asking Price per Square Foot (based on New Listings)                                                         $0                                                                       $152
December Sold Price per Square Foot                                                                       $117                                                                        $136
December Month's Supply of Inventory                                                                        7.5                                                                         6.6
December Sale Price vs List Price Ratio                                                                 85.8%                                                                        89.5%
* LM=Last Month / L3M=Last 3 Months / PYM=Same Month Prior Year / LY=Last Year / YTD = Year-to-date

                                                                                                                                                   Number of Properties Sold                                                           3 Mo Avg
                                                                                             18
Property Sales                                                                               16


                                                                                                                                                                                                                             17
                                                                                                                            16


December Property sales were 4, equal to 4 in                                                14
                                                                                                               14


                                                                                                                                                                                14


                                                                                                                                                                                                                                        14
December of 2008 and -33.3% lower than the 6 sales                                           12


                                                                                                                                                                                                                                      13
last month. December 2009 sales were at their                                                10
                                                                                                                                 11


                                                                                                                                                                   10
highest level compared to December of 2008 and                                                8
                                                                                                          9

                                                                                                                    9


                                                                                                                                      9
                                                                                                                                      9
                                                                                                                                      9


                                                                                                                                                                            9

                                                                                                                                                                                     9
                                                                                                                        8


                                                                                                                                           8


                                                                                                                                                                                             8


                                                                                                                                                                                                             8
2007. December YTD sales of 96 are running 15.7%                                              6


                                                                                                                                                                                         7


                                                                                                                                                                                                                 7

                                                                                                                                                                                                                         7
                                                                                                    6


                                                                                                                                                           6


                                                                                                                                                                                                     6


                                                                                                                                                                                                                     6


                                                                                                                                                                                                                                             6
ahead of last year's year-to-date sales of 83.                                                4


                                                                                                                                                                        5


                                                                                                                                                                                                                                  5
                                                                                                                                               4
                                                                                                                                               4


                                                                                                                                                               4


                                                                                                                                                                                                 4


                                                                                                                                                                                                                                                  4
                                                                                              2
                                                                                                                                                       3


                                                                                                                                                                                                         3
                                                                                              0
                                                                                                     J F M A M J J A S O N D J F M A M J J A S O N D J F M A M J J A S O N D
                                                                                                    07                       08                      09

                                                                                                                        Median Sales Price and Average Sales Price
                                                                                                (000's)
                                                                                                                Median means Middle (the same # of properties sold above and below the Median)                                         3 Mo Avg
Prices                                                                                       450
The Median Sales Price in December was $171,000,                                             400
down -7.6% from $185,000 in December of 2008
                                                                                             350
and down -22.3% from $220,000 last month. The
Average Sales Price in December was $157,750, up                                             300
11.4% from $141,575 in December of 2008 and down                                             250
-37.3% from $251,767 last month. December 2009                                               200
ASP was at a mid range compared to December of                                               150
2008 and 2007.
                                                                                             100
                                                                                                      J F M A M J J A S O N D J F M A M J J A S O N D J F M A M J J A S O N D
                                                                                                     07                       08                      09


                                                                                                                            Total Inventory & Month's Supply of Inventory (MSI)
Inventory & MSI                                                                                                         MSI is the # of month's needed to sell all of the Inventory at the monthly Sales Pace
                                                                                              60                                                                                                                                                  16
The Total Inventory of Properties available for sale as of
                                                                                                                                                                                                                                                  14
                                                                                                                                                                                                                    55


December was 30, down -14.3% from 35 last month and                                           50
                                                                                                                     53


                                                                                                                                                                                                                   53
                                                                                                                    52


                                                                                                                    52


                                                                                                                                                                                                                  51
                                                                                                                   50


down -18.9% from 37 in December of last year.
                                                                                                                                                                                                                 49


                                                                                                                                                                                                                                                  12
                                                                                                                  48


                                                                                                                45


December 2009 Inventory was at its lowest level                                               40
                                                                                                               43


                                                                                                                                                                                                                                      43
                                                                                                          42


                                                                                                                                                   41


                                                                                                                                                                                                                                                  10
                                                                                                                                                  40


                                                                                                                                                                                                                                    39
                                                                                                                                                 38


                                                                                                                                                 38


                                                                                                                                                 38


compared with December of 2008 and 2007.
                                                                                                                                                 37


                                                                                                                                                 37


                                                                                                                                                 37
                                                                                                                                                36
                                                                                                                                                36
                                                                                                    35


                                                                                                                                               35


                                                                                                                                               35


                                                                                                                                               35


                                                                                                                                                                                                                                  35


                                                                                              30                                                                                                                                                  8
                                                                                                                                              32
                                                                                                                                             31


                                                                                                                                             31

                                                                                                                                            30


                                                                                                                                                                                                                                             30
                                                                                                                                           28
                                                                                                                                           27


                                                                                                                                                                                                                                                  6
                                                                                              20
A comparatively lower MSI is more beneficial for sellers                                                                                                                                                                                          4
while a higher MSI is better for buyers. The December                                         10
                                                                                                                                                                                                                                                  2
2009 MSI of 7.5 months was at its lowest level compared
with December of 2008 and 2007.                                                                 0                                                                                                                                                 0
                                                                                                     J F M A M J J A S O N D J F M A M J J A S O N D J F M A M J J A S O N D
                                                                                                    07                      08                      09
Copyright © Coldwell Banker Burnet | Price Range: All | Property Types: Single Family
Data is provided courtesy of Regional Multiple Listing Service of Minnesota Incorporated and may not reflect all relevant real estate activity. Coldwell Banker Burnet does not warrant or guarantee
the accuracy of this information. It is the responsibility of any buyer or seller to verify any and all information relevant to such consumer’s real estate transaction.
MARKET ACTION REPORT                                                                                                                                                                          December 2009
                                                                                                                            David A. Cohen
MLS Area: 386 - Hopkins                                                                                                    Realtor
                                                                                                                           612-819-4077
                                                                                                                           www.EquityDefender.com

                                                                                                                                  Days On Market for Sold Properties
Market Time                                                                                 200
                                                                                                            Average Days on Market (Listing to Contract) for properties sold during the month                           3 Mo Avg
The average Days On Market (DOM) shows how many                                             180
days the average Property is on the market before it                                        160
sells. An upward trend in DOM tends to indicate a move                                      140
towards more of a Buyer's market, a downward trend a                                        120
move towards more of a Seller's market. The DOM for                                         100                                                                                                                              71
December was 71, down -40.3% from 119 days last                                              80                                                64
month and up 73.2% from 41 days in December of last                                          60                                                                                              41
year. The December 2009 DOM was at a mid level                                               40
compared with December of 2008 and 2007.                                                     20
                                                                                              0
                                                                                                       J F M A M J J A S O N D J F M A M J J A S O N D J F M A M J J A S O N D
                                                                                                      07                       08                      09

                                                                                                                                        Selling Price per Square Foot
                                                                                                                 Average Selling Price per Square Foot for properties that sold during the month                        3 Mo Avg
Selling Price per Square Foot
The Selling Price per Square Foot is a great indicator for                                   190
the direction of Property values. Since Median Sales                                         170
Price and Average Sales price can be impacted by the
'mix' of high or low end Properties in the market, the                                       150                                               137
selling price per square foot is a more normalized                                           130                                                                                                                            117
indicator on the direction of Property values. The                                           110                                                                                              95
December 2009 Selling Price per Square Foot of $117
was down -14.3% from $136 last month and up 22.6%                                               90
from 95 in December of last year.                                                               70
                                                                                                50
                                                                                                       J F M A M J J A S O N D J F M A M J J A S O N D J F M A M J J A S O N D
                                                                                                      07                       08                      09

                                                                                                                              Selling Price versus Listing Price Ratio
                                                                                                              Avg Selling Price divided by Avg Listing Price for sold properties during the month                       3 Mo Avg
                                                                                          100%
Selling Price vs Original Listing Price                                                     98%                                              95.7%
The Selling Price vs Original Listing Price reveals the                                     96%
                                                                                                                                                                                             93.5%
average amount that Sellers are agreeing to come down                                       94%
from their original list price. The lower the ratio is                                      92%
below 100% the more of a Buyer's market exists, a ratio
                                                                                            90%
at or above 100% indicates more of a Seller's market.
                                                                                           88%                                                                                                                           85.8%
The December 2009 Selling Price vs Original List Price
of 85.8% was down from 90.4% last month and down                                            86%
from 93.5% in December of last year.                                                        84%
                                                                                            82%
                                                                                           80%
                                                                                                       J F M A M J J A S O N D J F M A M J J A S O N D J F M A M J J A S O N D
                                                                                                      07                       08                      09


                                                                                                                                            Inventory / New Listings / Sales
Inventory / New Listings / Sales                                                          60                                                                                                Inventory   New Listings    Sales
This last view of the market combines monthly
                                                                                                                                                                                                             55


                                                                                          50
                                                                                                                 53


                                                                                                                                                                                                            53
                                                                                                                52


                                                                                                                52


                                                                                                                                                                                                           51
                                                                                                               50


inventory of Properties for sale along with New Listings
                                                                                                                                                                                                          49
                                                                                                              48


                                                                                                            45


and Sales. The graph shows the basic annual                                               40
                                                                                                           43


                                                                                                                                                                                                                           43
                                                                                                      42


                                                                                                                                             41
                                                                                                                                            40


                                                                                                                                                                                                                         39
                                                                                                                                           38


                                                                                                                                           38


                                                                                                                                           38


seasonality of the market as well as the relationship
                                                                                                                                           37


                                                                                                                                           37


                                                                                                                                           37
                                                                                                                                          36
                                                                                                                                          36
                                                                                                 35


                                                                                                                                         35


                                                                                                                                         35


                                                                                                                                         35


                                                                                                                                                                                                                       35


                                                                                          30
                                                                                                                                        32


between these items. The number of New Listings in
                                                                                                                                       31


                                                                                                                                       31

                                                                                                                                      30


                                                                                                                                                                                                                                 30
                                                                                                                                     28
                                                                                                                                     27


December 2009 was 10, up 66.7% from 6 last month                                          20
and down -9.1% from 11 in December of last year.
                                                                                          10

                                                                                            0
                                                                                                  J F M A M J J A S O N D J F M A M J J A S O N D J F M A M J J A S O N D
                                                                                                 07                       08                      09
Copyright © Coldwell Banker Burnet | Price Range: All | Property Types: Single Family
Data is provided courtesy of Regional Multiple Listing Service of Minnesota Incorporated and may not reflect all relevant real estate activity. Coldwell Banker Burnet does not warrant or guarantee
the accuracy of this information. It is the responsibility of any buyer or seller to verify any and all information relevant to such consumer’s real estate transaction.
MLS Area: 386 - Hopkins
                                                                                                                           Price Range: All | Property Types: Single Family

                            J 07       F       M        A       M        J       J       A       S       O        N       D     J 08       F       M       A       M        J        J       A         S    O      N     D   J 09     F    M      A    M      J     J     A     S    O      N     D
Homes Sold                     6       9      14       9       8       16      11       9       9        9        8       4       4        3       6       4      10        5       9      14       9        7     8     4     6      3     8     7     6     7    17     5    14    13     6     4
3 Mo. Roll Avg                                10      11      10       11      12      12      10        9        9       7       5        4       4       4       7        6       8       9      11       10     8     6     6      4     6     6     7     7    10    10    12    11    11     8


                 (000's)    J 07       F       M        A       M        J       J       A       S       O        N       D     J 08       F       M       A       M        J        J       A         S    O      N     D   J 09     F    M      A    M      J     J     A     S    O      N     D
Median Sale Price          199      221     238     220      208     230     235      260     235     319     225      242     195     284      231     236     256      250     170     255      209      158   267   185   205    170   214   193   209   198   244   259   269   217   220   171
3 Mo. Roll Avg                              219     226      222     219     224      242     243     271     260      262     221     240      237     250     241      247     225     225      211      207   211   203   219    187   196   192   205   200   217   233   257   248   235   203


                            J 07       F       M        A       M        J       J       A       S       O        N       D     J 08       F       M       A       M        J        J       A         S    O      N     D   J 09     F    M      A    M      J     J     A     S    O      N     D
Inventory                    35      42       48      52      53       45      52      50      43       35      37      31       28      27      32       31      35      30       36      36      37       38    35    37    38     40    41    38    51    55    53    49    43    39    35    30
MSI                           6       5        3       6       7        3       5       6       5        4       5       8        7       9       5        8       4       6        4       3       4        5     4     9     6     13     5     5     9     8     3    10     3     3     6     8


                            J 07       F       M        A       M        J       J       A       S       O        N       D     J 08       F       M       A       M        J        J       A         S    O      N     D   J 09     F    M      A    M      J     J     A     S    O      N     D
Days on Market               80      73       70      35      20       53      85      59      53       45 106          64       53      43 115 124               22 151           72      66      38       33    60    41    53     44    74    79    67    55    45    52    67    99 119      71
3 Mo. Roll Avg                                74      59      42       36      53      66      66       52 68           72       74      53 70 94                 87 99            82      96      59       46    44    45    51     46    57    66    73    67    56    51    55    73 95       96


                            J 07       F       M        A       M        J       J       A       S       O        N       D     J 08       F       M       A       M        J        J       A         S    O      N     D   J 09     F    M      A    M      J     J     A     S    O      N     D
Price per Sq Ft            141      151     137     173      157     163     135      154     167     162     146      137     122     162      144     116     144      145     137     144      168      168   136    95 140      110   134   117   115   152   142   180   137   131   136   117
3 Mo. Roll Avg                              143     154      156     164     152      151     152     161     158      148     135     140      142     140     135      135     142     142      150      160   157   133 124      115   128   120   122   128   137   158   153   150   135   128


                            J 07       F       M        A       M        J       J       A       S       O        N       D     J 08       F       M       A       M        J        J       A         S    O      N     D   J 09     F    M      A    M      J     J     A     S    O      N     D
Sale to List Price         0.940 0.981 0.935 0.963 0.988 0.964 0.918 0.963 0.966 0.948 0.933 0.957 0.930 0.960 0.907 0.849 0.961 0.837 0.907 0.947 0.957 0.941 0.942 0.935 0.909 0.854 0.919 0.895 0.858 0.938 0.960 0.949 0.902 0.858 0.904 0.858
3 Mo. Roll Avg                             0.952 0.960 0.962 0.972 0.957 0.948 0.949 0.959 0.949 0.946 0.940 0.949 0.932 0.905 0.906 0.882 0.902 0.897 0.937 0.948 0.947 0.939 0.929 0.899 0.894 0.889 0.891 0.897 0.919 0.949 0.937 0.903 0.888 0.873


                            J 07       F       M        A       M        J       J       A       S       O        N       D     J 08       F       M       A       M        J        J       A         S    O      N     D   J 09     F    M      A    M      J     J     A     S    O      N     D
New Listings                 17      15       23      21      20       18      19      16      11        9      15       2       11      10      13       11      14      10       18      14      16       14     9    11    13     11    10    12    24    22    13    14    14     6     6    10
Inventory                    35      42       48      52      53       45      52      50      43       35      37      31       28      27      32       31      35      30       36      36      37       38    35    37    38     40    41    38    51    55    53    49    43    39    35    30
Sales                         6       9       14       9       8       16      11       9       9        9       8       4        4       3       6        4      10       5        9      14       9        7     8     4     6      3     8     7     6     7    17     5    14    13     6     4


                 (000's)    J 07       F       M        A       M        J       J       A       S       O        N       D     J 08       F       M       A       M        J        J       A         S    O      N     D   J 09     F    M      A    M      J     J     A     S    O      N     D
Avg Sale Price             207      235     241     235      209     266     235      278     265     363     308      235     185     326      227     213     291      350     191     272      234      438   318   142   201    157   233   183   213   195   274   317   304   212   252   158
3 Mo. Roll Avg                              227     237      228     237     237      260     259     302     312      302     242     249      246     256     244      285     277     271      233      315   330   299   220    167   197   191   209   197   228   262   298   278   256   207


Copyright © Coldwell Banker Burnet | Price Range: All | Property Types: Single Family
Data is provided courtesy of Regional Multiple Listing Service of Minnesota Incorporated and may not reflect all relevant real estate activity. Coldwell Banker Burnet does not warrant or guarantee
the accuracy of this information. It is the responsibility of any buyer or seller to verify any and all information relevant to such consumer’s real estate transaction.

Mais conteúdo relacionado

Último

Raymond Ten X Era Viviana Mall Thane Brochure.pdf
Raymond Ten X Era Viviana Mall Thane Brochure.pdfRaymond Ten X Era Viviana Mall Thane Brochure.pdf
Raymond Ten X Era Viviana Mall Thane Brochure.pdfPrachiRudram
 
Listing Turkey - Resim Modern Catalog Istanbul
Listing Turkey - Resim Modern Catalog IstanbulListing Turkey - Resim Modern Catalog Istanbul
Listing Turkey - Resim Modern Catalog IstanbulListing Turkey
 
Radiance Majestic Valasaravakkam Chennai.pdf
Radiance Majestic Valasaravakkam Chennai.pdfRadiance Majestic Valasaravakkam Chennai.pdf
Radiance Majestic Valasaravakkam Chennai.pdfashiyadav24
 
Volition Meetup 2024 03 Mortgages & Interest Rates – Is The Worst Behind Us_ ...
Volition Meetup 2024 03 Mortgages & Interest Rates – Is The Worst Behind Us_ ...Volition Meetup 2024 03 Mortgages & Interest Rates – Is The Worst Behind Us_ ...
Volition Meetup 2024 03 Mortgages & Interest Rates – Is The Worst Behind Us_ ...Volition Properties
 
Listing Turkey Green life Istanbul Eyup Catalog
Listing Turkey Green life Istanbul Eyup CatalogListing Turkey Green life Istanbul Eyup Catalog
Listing Turkey Green life Istanbul Eyup CatalogListing Turkey
 
Kohinoor Hinjewadi Phase 2 In Pune - PDF.pdf
Kohinoor Hinjewadi Phase 2 In Pune - PDF.pdfKohinoor Hinjewadi Phase 2 In Pune - PDF.pdf
Kohinoor Hinjewadi Phase 2 In Pune - PDF.pdfmonikasharma630
 
LCAR RE Practice - The Power of Your Database
LCAR RE Practice - The Power of Your DatabaseLCAR RE Practice - The Power of Your Database
LCAR RE Practice - The Power of Your DatabaseTom Blefko
 
Prestige Orchards Plots in Shamshabad, Mamidipalli, Hyderabad pdf.pdf
Prestige Orchards Plots in Shamshabad, Mamidipalli, Hyderabad pdf.pdfPrestige Orchards Plots in Shamshabad, Mamidipalli, Hyderabad pdf.pdf
Prestige Orchards Plots in Shamshabad, Mamidipalli, Hyderabad pdf.pdfAhanundefined
 
What is Affordable Housing? Bristol Civic Society April 2024
What is Affordable Housing? Bristol Civic Society April 2024What is Affordable Housing? Bristol Civic Society April 2024
What is Affordable Housing? Bristol Civic Society April 2024Paul Smith
 
Provident Ecopolitan Aerospace Park, Bangalore E- Brochure.pdf
Provident Ecopolitan Aerospace Park, Bangalore E- Brochure.pdfProvident Ecopolitan Aerospace Park, Bangalore E- Brochure.pdf
Provident Ecopolitan Aerospace Park, Bangalore E- Brochure.pdffaheemali990101
 
Maha Mauka Squarefeet Brochure |Maha Mauka Squarefeet PDF Brochure|
Maha Mauka Squarefeet Brochure |Maha Mauka Squarefeet PDF Brochure|Maha Mauka Squarefeet Brochure |Maha Mauka Squarefeet PDF Brochure|
Maha Mauka Squarefeet Brochure |Maha Mauka Squarefeet PDF Brochure|AkshayJoshi575980
 
Lancaster Market Expenses and Company Worksheet
Lancaster Market Expenses and Company WorksheetLancaster Market Expenses and Company Worksheet
Lancaster Market Expenses and Company WorksheetTom Blefko
 
Vilas Javdekar Yashwin Enchante Pune E-Brochure .pdf
Vilas Javdekar Yashwin Enchante Pune  E-Brochure .pdfVilas Javdekar Yashwin Enchante Pune  E-Brochure .pdf
Vilas Javdekar Yashwin Enchante Pune E-Brochure .pdfManishSaxena95
 
Provident Kenworth Rajendra Nagar Hyderabad.pdf
Provident Kenworth Rajendra Nagar Hyderabad.pdfProvident Kenworth Rajendra Nagar Hyderabad.pdf
Provident Kenworth Rajendra Nagar Hyderabad.pdfashiyadav24
 
Saheel ITREND Futura At Baner Annexe Pune - PDF.pdf
Saheel ITREND Futura At Baner Annexe Pune - PDF.pdfSaheel ITREND Futura At Baner Annexe Pune - PDF.pdf
Saheel ITREND Futura At Baner Annexe Pune - PDF.pdfmonikasharma630
 
Sankla East World Hadapsar Pune Brochure.pdf
Sankla East World Hadapsar Pune Brochure.pdfSankla East World Hadapsar Pune Brochure.pdf
Sankla East World Hadapsar Pune Brochure.pdfabbu831446
 
Clemson Engineering Consultant Dubai For Innovative and Sustainable Engineeri...
Clemson Engineering Consultant Dubai For Innovative and Sustainable Engineeri...Clemson Engineering Consultant Dubai For Innovative and Sustainable Engineeri...
Clemson Engineering Consultant Dubai For Innovative and Sustainable Engineeri...Clemson Engineering Consultant
 
Managing Uncertainty: Newman George Leech's Real Estate Finance Strategy
Managing Uncertainty: Newman George Leech's Real Estate Finance StrategyManaging Uncertainty: Newman George Leech's Real Estate Finance Strategy
Managing Uncertainty: Newman George Leech's Real Estate Finance StrategyNewman George Leech
 
Experion Elements Sector 45 Noida E-Brochure
Experion Elements Sector 45 Noida E-BrochureExperion Elements Sector 45 Noida E-Brochure
Experion Elements Sector 45 Noida E-BrochureRealEstate Info
 
Kolte Patil Mirabilis at Horamavu Road, Bangalore E brochure.pdf
Kolte Patil Mirabilis at Horamavu Road, Bangalore E brochure.pdfKolte Patil Mirabilis at Horamavu Road, Bangalore E brochure.pdf
Kolte Patil Mirabilis at Horamavu Road, Bangalore E brochure.pdfAhanundefined
 

Último (20)

Raymond Ten X Era Viviana Mall Thane Brochure.pdf
Raymond Ten X Era Viviana Mall Thane Brochure.pdfRaymond Ten X Era Viviana Mall Thane Brochure.pdf
Raymond Ten X Era Viviana Mall Thane Brochure.pdf
 
Listing Turkey - Resim Modern Catalog Istanbul
Listing Turkey - Resim Modern Catalog IstanbulListing Turkey - Resim Modern Catalog Istanbul
Listing Turkey - Resim Modern Catalog Istanbul
 
Radiance Majestic Valasaravakkam Chennai.pdf
Radiance Majestic Valasaravakkam Chennai.pdfRadiance Majestic Valasaravakkam Chennai.pdf
Radiance Majestic Valasaravakkam Chennai.pdf
 
Volition Meetup 2024 03 Mortgages & Interest Rates – Is The Worst Behind Us_ ...
Volition Meetup 2024 03 Mortgages & Interest Rates – Is The Worst Behind Us_ ...Volition Meetup 2024 03 Mortgages & Interest Rates – Is The Worst Behind Us_ ...
Volition Meetup 2024 03 Mortgages & Interest Rates – Is The Worst Behind Us_ ...
 
Listing Turkey Green life Istanbul Eyup Catalog
Listing Turkey Green life Istanbul Eyup CatalogListing Turkey Green life Istanbul Eyup Catalog
Listing Turkey Green life Istanbul Eyup Catalog
 
Kohinoor Hinjewadi Phase 2 In Pune - PDF.pdf
Kohinoor Hinjewadi Phase 2 In Pune - PDF.pdfKohinoor Hinjewadi Phase 2 In Pune - PDF.pdf
Kohinoor Hinjewadi Phase 2 In Pune - PDF.pdf
 
LCAR RE Practice - The Power of Your Database
LCAR RE Practice - The Power of Your DatabaseLCAR RE Practice - The Power of Your Database
LCAR RE Practice - The Power of Your Database
 
Prestige Orchards Plots in Shamshabad, Mamidipalli, Hyderabad pdf.pdf
Prestige Orchards Plots in Shamshabad, Mamidipalli, Hyderabad pdf.pdfPrestige Orchards Plots in Shamshabad, Mamidipalli, Hyderabad pdf.pdf
Prestige Orchards Plots in Shamshabad, Mamidipalli, Hyderabad pdf.pdf
 
What is Affordable Housing? Bristol Civic Society April 2024
What is Affordable Housing? Bristol Civic Society April 2024What is Affordable Housing? Bristol Civic Society April 2024
What is Affordable Housing? Bristol Civic Society April 2024
 
Provident Ecopolitan Aerospace Park, Bangalore E- Brochure.pdf
Provident Ecopolitan Aerospace Park, Bangalore E- Brochure.pdfProvident Ecopolitan Aerospace Park, Bangalore E- Brochure.pdf
Provident Ecopolitan Aerospace Park, Bangalore E- Brochure.pdf
 
Maha Mauka Squarefeet Brochure |Maha Mauka Squarefeet PDF Brochure|
Maha Mauka Squarefeet Brochure |Maha Mauka Squarefeet PDF Brochure|Maha Mauka Squarefeet Brochure |Maha Mauka Squarefeet PDF Brochure|
Maha Mauka Squarefeet Brochure |Maha Mauka Squarefeet PDF Brochure|
 
Lancaster Market Expenses and Company Worksheet
Lancaster Market Expenses and Company WorksheetLancaster Market Expenses and Company Worksheet
Lancaster Market Expenses and Company Worksheet
 
Vilas Javdekar Yashwin Enchante Pune E-Brochure .pdf
Vilas Javdekar Yashwin Enchante Pune  E-Brochure .pdfVilas Javdekar Yashwin Enchante Pune  E-Brochure .pdf
Vilas Javdekar Yashwin Enchante Pune E-Brochure .pdf
 
Provident Kenworth Rajendra Nagar Hyderabad.pdf
Provident Kenworth Rajendra Nagar Hyderabad.pdfProvident Kenworth Rajendra Nagar Hyderabad.pdf
Provident Kenworth Rajendra Nagar Hyderabad.pdf
 
Saheel ITREND Futura At Baner Annexe Pune - PDF.pdf
Saheel ITREND Futura At Baner Annexe Pune - PDF.pdfSaheel ITREND Futura At Baner Annexe Pune - PDF.pdf
Saheel ITREND Futura At Baner Annexe Pune - PDF.pdf
 
Sankla East World Hadapsar Pune Brochure.pdf
Sankla East World Hadapsar Pune Brochure.pdfSankla East World Hadapsar Pune Brochure.pdf
Sankla East World Hadapsar Pune Brochure.pdf
 
Clemson Engineering Consultant Dubai For Innovative and Sustainable Engineeri...
Clemson Engineering Consultant Dubai For Innovative and Sustainable Engineeri...Clemson Engineering Consultant Dubai For Innovative and Sustainable Engineeri...
Clemson Engineering Consultant Dubai For Innovative and Sustainable Engineeri...
 
Managing Uncertainty: Newman George Leech's Real Estate Finance Strategy
Managing Uncertainty: Newman George Leech's Real Estate Finance StrategyManaging Uncertainty: Newman George Leech's Real Estate Finance Strategy
Managing Uncertainty: Newman George Leech's Real Estate Finance Strategy
 
Experion Elements Sector 45 Noida E-Brochure
Experion Elements Sector 45 Noida E-BrochureExperion Elements Sector 45 Noida E-Brochure
Experion Elements Sector 45 Noida E-Brochure
 
Kolte Patil Mirabilis at Horamavu Road, Bangalore E brochure.pdf
Kolte Patil Mirabilis at Horamavu Road, Bangalore E brochure.pdfKolte Patil Mirabilis at Horamavu Road, Bangalore E brochure.pdf
Kolte Patil Mirabilis at Horamavu Road, Bangalore E brochure.pdf
 

Destaque

2024 State of Marketing Report – by Hubspot
2024 State of Marketing Report – by Hubspot2024 State of Marketing Report – by Hubspot
2024 State of Marketing Report – by HubspotMarius Sescu
 
Everything You Need To Know About ChatGPT
Everything You Need To Know About ChatGPTEverything You Need To Know About ChatGPT
Everything You Need To Know About ChatGPTExpeed Software
 
Product Design Trends in 2024 | Teenage Engineerings
Product Design Trends in 2024 | Teenage EngineeringsProduct Design Trends in 2024 | Teenage Engineerings
Product Design Trends in 2024 | Teenage EngineeringsPixeldarts
 
How Race, Age and Gender Shape Attitudes Towards Mental Health
How Race, Age and Gender Shape Attitudes Towards Mental HealthHow Race, Age and Gender Shape Attitudes Towards Mental Health
How Race, Age and Gender Shape Attitudes Towards Mental HealthThinkNow
 
AI Trends in Creative Operations 2024 by Artwork Flow.pdf
AI Trends in Creative Operations 2024 by Artwork Flow.pdfAI Trends in Creative Operations 2024 by Artwork Flow.pdf
AI Trends in Creative Operations 2024 by Artwork Flow.pdfmarketingartwork
 
PEPSICO Presentation to CAGNY Conference Feb 2024
PEPSICO Presentation to CAGNY Conference Feb 2024PEPSICO Presentation to CAGNY Conference Feb 2024
PEPSICO Presentation to CAGNY Conference Feb 2024Neil Kimberley
 
Content Methodology: A Best Practices Report (Webinar)
Content Methodology: A Best Practices Report (Webinar)Content Methodology: A Best Practices Report (Webinar)
Content Methodology: A Best Practices Report (Webinar)contently
 
How to Prepare For a Successful Job Search for 2024
How to Prepare For a Successful Job Search for 2024How to Prepare For a Successful Job Search for 2024
How to Prepare For a Successful Job Search for 2024Albert Qian
 
Social Media Marketing Trends 2024 // The Global Indie Insights
Social Media Marketing Trends 2024 // The Global Indie InsightsSocial Media Marketing Trends 2024 // The Global Indie Insights
Social Media Marketing Trends 2024 // The Global Indie InsightsKurio // The Social Media Age(ncy)
 
Trends In Paid Search: Navigating The Digital Landscape In 2024
Trends In Paid Search: Navigating The Digital Landscape In 2024Trends In Paid Search: Navigating The Digital Landscape In 2024
Trends In Paid Search: Navigating The Digital Landscape In 2024Search Engine Journal
 
5 Public speaking tips from TED - Visualized summary
5 Public speaking tips from TED - Visualized summary5 Public speaking tips from TED - Visualized summary
5 Public speaking tips from TED - Visualized summarySpeakerHub
 
ChatGPT and the Future of Work - Clark Boyd
ChatGPT and the Future of Work - Clark Boyd ChatGPT and the Future of Work - Clark Boyd
ChatGPT and the Future of Work - Clark Boyd Clark Boyd
 
Getting into the tech field. what next
Getting into the tech field. what next Getting into the tech field. what next
Getting into the tech field. what next Tessa Mero
 
Google's Just Not That Into You: Understanding Core Updates & Search Intent
Google's Just Not That Into You: Understanding Core Updates & Search IntentGoogle's Just Not That Into You: Understanding Core Updates & Search Intent
Google's Just Not That Into You: Understanding Core Updates & Search IntentLily Ray
 
Time Management & Productivity - Best Practices
Time Management & Productivity -  Best PracticesTime Management & Productivity -  Best Practices
Time Management & Productivity - Best PracticesVit Horky
 
The six step guide to practical project management
The six step guide to practical project managementThe six step guide to practical project management
The six step guide to practical project managementMindGenius
 
Beginners Guide to TikTok for Search - Rachel Pearson - We are Tilt __ Bright...
Beginners Guide to TikTok for Search - Rachel Pearson - We are Tilt __ Bright...Beginners Guide to TikTok for Search - Rachel Pearson - We are Tilt __ Bright...
Beginners Guide to TikTok for Search - Rachel Pearson - We are Tilt __ Bright...RachelPearson36
 

Destaque (20)

2024 State of Marketing Report – by Hubspot
2024 State of Marketing Report – by Hubspot2024 State of Marketing Report – by Hubspot
2024 State of Marketing Report – by Hubspot
 
Everything You Need To Know About ChatGPT
Everything You Need To Know About ChatGPTEverything You Need To Know About ChatGPT
Everything You Need To Know About ChatGPT
 
Product Design Trends in 2024 | Teenage Engineerings
Product Design Trends in 2024 | Teenage EngineeringsProduct Design Trends in 2024 | Teenage Engineerings
Product Design Trends in 2024 | Teenage Engineerings
 
How Race, Age and Gender Shape Attitudes Towards Mental Health
How Race, Age and Gender Shape Attitudes Towards Mental HealthHow Race, Age and Gender Shape Attitudes Towards Mental Health
How Race, Age and Gender Shape Attitudes Towards Mental Health
 
AI Trends in Creative Operations 2024 by Artwork Flow.pdf
AI Trends in Creative Operations 2024 by Artwork Flow.pdfAI Trends in Creative Operations 2024 by Artwork Flow.pdf
AI Trends in Creative Operations 2024 by Artwork Flow.pdf
 
Skeleton Culture Code
Skeleton Culture CodeSkeleton Culture Code
Skeleton Culture Code
 
PEPSICO Presentation to CAGNY Conference Feb 2024
PEPSICO Presentation to CAGNY Conference Feb 2024PEPSICO Presentation to CAGNY Conference Feb 2024
PEPSICO Presentation to CAGNY Conference Feb 2024
 
Content Methodology: A Best Practices Report (Webinar)
Content Methodology: A Best Practices Report (Webinar)Content Methodology: A Best Practices Report (Webinar)
Content Methodology: A Best Practices Report (Webinar)
 
How to Prepare For a Successful Job Search for 2024
How to Prepare For a Successful Job Search for 2024How to Prepare For a Successful Job Search for 2024
How to Prepare For a Successful Job Search for 2024
 
Social Media Marketing Trends 2024 // The Global Indie Insights
Social Media Marketing Trends 2024 // The Global Indie InsightsSocial Media Marketing Trends 2024 // The Global Indie Insights
Social Media Marketing Trends 2024 // The Global Indie Insights
 
Trends In Paid Search: Navigating The Digital Landscape In 2024
Trends In Paid Search: Navigating The Digital Landscape In 2024Trends In Paid Search: Navigating The Digital Landscape In 2024
Trends In Paid Search: Navigating The Digital Landscape In 2024
 
5 Public speaking tips from TED - Visualized summary
5 Public speaking tips from TED - Visualized summary5 Public speaking tips from TED - Visualized summary
5 Public speaking tips from TED - Visualized summary
 
ChatGPT and the Future of Work - Clark Boyd
ChatGPT and the Future of Work - Clark Boyd ChatGPT and the Future of Work - Clark Boyd
ChatGPT and the Future of Work - Clark Boyd
 
Getting into the tech field. what next
Getting into the tech field. what next Getting into the tech field. what next
Getting into the tech field. what next
 
Google's Just Not That Into You: Understanding Core Updates & Search Intent
Google's Just Not That Into You: Understanding Core Updates & Search IntentGoogle's Just Not That Into You: Understanding Core Updates & Search Intent
Google's Just Not That Into You: Understanding Core Updates & Search Intent
 
How to have difficult conversations
How to have difficult conversations How to have difficult conversations
How to have difficult conversations
 
Introduction to Data Science
Introduction to Data ScienceIntroduction to Data Science
Introduction to Data Science
 
Time Management & Productivity - Best Practices
Time Management & Productivity -  Best PracticesTime Management & Productivity -  Best Practices
Time Management & Productivity - Best Practices
 
The six step guide to practical project management
The six step guide to practical project managementThe six step guide to practical project management
The six step guide to practical project management
 
Beginners Guide to TikTok for Search - Rachel Pearson - We are Tilt __ Bright...
Beginners Guide to TikTok for Search - Rachel Pearson - We are Tilt __ Bright...Beginners Guide to TikTok for Search - Rachel Pearson - We are Tilt __ Bright...
Beginners Guide to TikTok for Search - Rachel Pearson - We are Tilt __ Bright...
 

Market Action Report Mls Area 386 Hopkins Dec2009

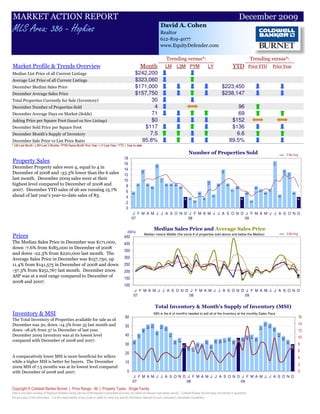
  • 1. MARKET ACTION REPORT December 2009 David A. Cohen MLS Area: 386 - Hopkins Realtor 612-819-4077 www.EquityDefender.com Trending versus*: Trending versus*: Market Profile & Trends Overview Month LM L3M PYM LY YTD Prior YTD Prior Year Median List Price of all Current Listings $242,200 Average List Price of all Current Listings $323,060 December Median Sales Price $171,000 $223,450 December Average Sales Price $157,750 $238,147 Total Properties Currently for Sale (Inventory) 30 December Number of Properties Sold 4 96 December Average Days on Market (Solds) 71 69 Asking Price per Square Foot (based on New Listings) $0 $152 December Sold Price per Square Foot $117 $136 December Month's Supply of Inventory 7.5 6.6 December Sale Price vs List Price Ratio 85.8% 89.5% * LM=Last Month / L3M=Last 3 Months / PYM=Same Month Prior Year / LY=Last Year / YTD = Year-to-date Number of Properties Sold 3 Mo Avg 18 Property Sales 16 17 16 December Property sales were 4, equal to 4 in 14 14 14 14 December of 2008 and -33.3% lower than the 6 sales 12 13 last month. December 2009 sales were at their 10 11 10 highest level compared to December of 2008 and 8 9 9 9 9 9 9 9 8 8 8 8 2007. December YTD sales of 96 are running 15.7% 6 7 7 7 6 6 6 6 6 ahead of last year's year-to-date sales of 83. 4 5 5 4 4 4 4 4 2 3 3 0 J F M A M J J A S O N D J F M A M J J A S O N D J F M A M J J A S O N D 07 08 09 Median Sales Price and Average Sales Price (000's) Median means Middle (the same # of properties sold above and below the Median) 3 Mo Avg Prices 450 The Median Sales Price in December was $171,000, 400 down -7.6% from $185,000 in December of 2008 350 and down -22.3% from $220,000 last month. The Average Sales Price in December was $157,750, up 300 11.4% from $141,575 in December of 2008 and down 250 -37.3% from $251,767 last month. December 2009 200 ASP was at a mid range compared to December of 150 2008 and 2007. 100 J F M A M J J A S O N D J F M A M J J A S O N D J F M A M J J A S O N D 07 08 09 Total Inventory & Month's Supply of Inventory (MSI) Inventory & MSI MSI is the # of month's needed to sell all of the Inventory at the monthly Sales Pace 60 16 The Total Inventory of Properties available for sale as of 14 55 December was 30, down -14.3% from 35 last month and 50 53 53 52 52 51 50 down -18.9% from 37 in December of last year. 49 12 48 45 December 2009 Inventory was at its lowest level 40 43 43 42 41 10 40 39 38 38 38 compared with December of 2008 and 2007. 37 37 37 36 36 35 35 35 35 35 30 8 32 31 31 30 30 28 27 6 20 A comparatively lower MSI is more beneficial for sellers 4 while a higher MSI is better for buyers. The December 10 2 2009 MSI of 7.5 months was at its lowest level compared with December of 2008 and 2007. 0 0 J F M A M J J A S O N D J F M A M J J A S O N D J F M A M J J A S O N D 07 08 09 Copyright © Coldwell Banker Burnet | Price Range: All | Property Types: Single Family Data is provided courtesy of Regional Multiple Listing Service of Minnesota Incorporated and may not reflect all relevant real estate activity. Coldwell Banker Burnet does not warrant or guarantee the accuracy of this information. It is the responsibility of any buyer or seller to verify any and all information relevant to such consumer’s real estate transaction.
  • 2. MARKET ACTION REPORT December 2009 David A. Cohen MLS Area: 386 - Hopkins Realtor 612-819-4077 www.EquityDefender.com Days On Market for Sold Properties Market Time 200 Average Days on Market (Listing to Contract) for properties sold during the month 3 Mo Avg The average Days On Market (DOM) shows how many 180 days the average Property is on the market before it 160 sells. An upward trend in DOM tends to indicate a move 140 towards more of a Buyer's market, a downward trend a 120 move towards more of a Seller's market. The DOM for 100 71 December was 71, down -40.3% from 119 days last 80 64 month and up 73.2% from 41 days in December of last 60 41 year. The December 2009 DOM was at a mid level 40 compared with December of 2008 and 2007. 20 0 J F M A M J J A S O N D J F M A M J J A S O N D J F M A M J J A S O N D 07 08 09 Selling Price per Square Foot Average Selling Price per Square Foot for properties that sold during the month 3 Mo Avg Selling Price per Square Foot The Selling Price per Square Foot is a great indicator for 190 the direction of Property values. Since Median Sales 170 Price and Average Sales price can be impacted by the 'mix' of high or low end Properties in the market, the 150 137 selling price per square foot is a more normalized 130 117 indicator on the direction of Property values. The 110 95 December 2009 Selling Price per Square Foot of $117 was down -14.3% from $136 last month and up 22.6% 90 from 95 in December of last year. 70 50 J F M A M J J A S O N D J F M A M J J A S O N D J F M A M J J A S O N D 07 08 09 Selling Price versus Listing Price Ratio Avg Selling Price divided by Avg Listing Price for sold properties during the month 3 Mo Avg 100% Selling Price vs Original Listing Price 98% 95.7% The Selling Price vs Original Listing Price reveals the 96% 93.5% average amount that Sellers are agreeing to come down 94% from their original list price. The lower the ratio is 92% below 100% the more of a Buyer's market exists, a ratio 90% at or above 100% indicates more of a Seller's market. 88% 85.8% The December 2009 Selling Price vs Original List Price of 85.8% was down from 90.4% last month and down 86% from 93.5% in December of last year. 84% 82% 80% J F M A M J J A S O N D J F M A M J J A S O N D J F M A M J J A S O N D 07 08 09 Inventory / New Listings / Sales Inventory / New Listings / Sales 60 Inventory New Listings Sales This last view of the market combines monthly 55 50 53 53 52 52 51 50 inventory of Properties for sale along with New Listings 49 48 45 and Sales. The graph shows the basic annual 40 43 43 42 41 40 39 38 38 38 seasonality of the market as well as the relationship 37 37 37 36 36 35 35 35 35 35 30 32 between these items. The number of New Listings in 31 31 30 30 28 27 December 2009 was 10, up 66.7% from 6 last month 20 and down -9.1% from 11 in December of last year. 10 0 J F M A M J J A S O N D J F M A M J J A S O N D J F M A M J J A S O N D 07 08 09 Copyright © Coldwell Banker Burnet | Price Range: All | Property Types: Single Family Data is provided courtesy of Regional Multiple Listing Service of Minnesota Incorporated and may not reflect all relevant real estate activity. Coldwell Banker Burnet does not warrant or guarantee the accuracy of this information. It is the responsibility of any buyer or seller to verify any and all information relevant to such consumer’s real estate transaction.
  • 3. MLS Area: 386 - Hopkins Price Range: All | Property Types: Single Family J 07 F M A M J J A S O N D J 08 F M A M J J A S O N D J 09 F M A M J J A S O N D Homes Sold 6 9 14 9 8 16 11 9 9 9 8 4 4 3 6 4 10 5 9 14 9 7 8 4 6 3 8 7 6 7 17 5 14 13 6 4 3 Mo. Roll Avg 10 11 10 11 12 12 10 9 9 7 5 4 4 4 7 6 8 9 11 10 8 6 6 4 6 6 7 7 10 10 12 11 11 8 (000's) J 07 F M A M J J A S O N D J 08 F M A M J J A S O N D J 09 F M A M J J A S O N D Median Sale Price 199 221 238 220 208 230 235 260 235 319 225 242 195 284 231 236 256 250 170 255 209 158 267 185 205 170 214 193 209 198 244 259 269 217 220 171 3 Mo. Roll Avg 219 226 222 219 224 242 243 271 260 262 221 240 237 250 241 247 225 225 211 207 211 203 219 187 196 192 205 200 217 233 257 248 235 203 J 07 F M A M J J A S O N D J 08 F M A M J J A S O N D J 09 F M A M J J A S O N D Inventory 35 42 48 52 53 45 52 50 43 35 37 31 28 27 32 31 35 30 36 36 37 38 35 37 38 40 41 38 51 55 53 49 43 39 35 30 MSI 6 5 3 6 7 3 5 6 5 4 5 8 7 9 5 8 4 6 4 3 4 5 4 9 6 13 5 5 9 8 3 10 3 3 6 8 J 07 F M A M J J A S O N D J 08 F M A M J J A S O N D J 09 F M A M J J A S O N D Days on Market 80 73 70 35 20 53 85 59 53 45 106 64 53 43 115 124 22 151 72 66 38 33 60 41 53 44 74 79 67 55 45 52 67 99 119 71 3 Mo. Roll Avg 74 59 42 36 53 66 66 52 68 72 74 53 70 94 87 99 82 96 59 46 44 45 51 46 57 66 73 67 56 51 55 73 95 96 J 07 F M A M J J A S O N D J 08 F M A M J J A S O N D J 09 F M A M J J A S O N D Price per Sq Ft 141 151 137 173 157 163 135 154 167 162 146 137 122 162 144 116 144 145 137 144 168 168 136 95 140 110 134 117 115 152 142 180 137 131 136 117 3 Mo. Roll Avg 143 154 156 164 152 151 152 161 158 148 135 140 142 140 135 135 142 142 150 160 157 133 124 115 128 120 122 128 137 158 153 150 135 128 J 07 F M A M J J A S O N D J 08 F M A M J J A S O N D J 09 F M A M J J A S O N D Sale to List Price 0.940 0.981 0.935 0.963 0.988 0.964 0.918 0.963 0.966 0.948 0.933 0.957 0.930 0.960 0.907 0.849 0.961 0.837 0.907 0.947 0.957 0.941 0.942 0.935 0.909 0.854 0.919 0.895 0.858 0.938 0.960 0.949 0.902 0.858 0.904 0.858 3 Mo. Roll Avg 0.952 0.960 0.962 0.972 0.957 0.948 0.949 0.959 0.949 0.946 0.940 0.949 0.932 0.905 0.906 0.882 0.902 0.897 0.937 0.948 0.947 0.939 0.929 0.899 0.894 0.889 0.891 0.897 0.919 0.949 0.937 0.903 0.888 0.873 J 07 F M A M J J A S O N D J 08 F M A M J J A S O N D J 09 F M A M J J A S O N D New Listings 17 15 23 21 20 18 19 16 11 9 15 2 11 10 13 11 14 10 18 14 16 14 9 11 13 11 10 12 24 22 13 14 14 6 6 10 Inventory 35 42 48 52 53 45 52 50 43 35 37 31 28 27 32 31 35 30 36 36 37 38 35 37 38 40 41 38 51 55 53 49 43 39 35 30 Sales 6 9 14 9 8 16 11 9 9 9 8 4 4 3 6 4 10 5 9 14 9 7 8 4 6 3 8 7 6 7 17 5 14 13 6 4 (000's) J 07 F M A M J J A S O N D J 08 F M A M J J A S O N D J 09 F M A M J J A S O N D Avg Sale Price 207 235 241 235 209 266 235 278 265 363 308 235 185 326 227 213 291 350 191 272 234 438 318 142 201 157 233 183 213 195 274 317 304 212 252 158 3 Mo. Roll Avg 227 237 228 237 237 260 259 302 312 302 242 249 246 256 244 285 277 271 233 315 330 299 220 167 197 191 209 197 228 262 298 278 256 207 Copyright © Coldwell Banker Burnet | Price Range: All | Property Types: Single Family Data is provided courtesy of Regional Multiple Listing Service of Minnesota Incorporated and may not reflect all relevant real estate activity. Coldwell Banker Burnet does not warrant or guarantee the accuracy of this information. It is the responsibility of any buyer or seller to verify any and all information relevant to such consumer’s real estate transaction.