Reese Norsworthy Rowlands
•
0 gostou•2,091 visualizações

An independent RCT that confirms the advantage of feedback over TAU using the ORS and SRS.

Recomendados
Mais conteúdo relacionado
Mais procurados
Mais procurados (20)
Semelhante a Reese Norsworthy Rowlands
Semelhante a Reese Norsworthy Rowlands (18)
Último
Último (20)
Reese Norsworthy Rowlands
- 1. Psychotherapy Theory, Research, Practice, Training © 2009 American Psychological Association 2009, Vol. 46, No. 4, 418 – 431 0033-3204/09/$12.00 DOI: 10.1037/a0017901 DOES A CONTINUOUS FEEDBACK SYSTEM IMPROVE PSYCHOTHERAPY OUTCOME? ROBERT J. REESE LARRY A. NORSWORTHY AND University of Kentucky STEVE R. ROWLANDS Abilene Christian University Using outcome data on a continual ba- ings, limitations of the study and ideas sis to monitor treatment progress has for future research are discussed. been identified as a way to enhance psychotherapy outcome. The purpose of Keywords: psychotherapy, counseling this study was to investigate the use of effectiveness, client progress and out- a continuous feedback assessment sys- come, feedback information tem, the Partners for Change Outcome Management System (PCOMS; Miller Research has suggested that outcome assess- & Duncan, 2004). Findings from 2 cli- ment conducted on a continuous basis can lead to ent samples that attended individual increased effectiveness, particularly for identify- therapy at a university counseling cen- ing clients who are not progressing in therapy as ter (N 74) or a graduate training expected (e.g., Beutler, 2001; Lambert, Hansen, clinic (N 74) indicated that clients & Finch, 2001; Lueger et al., 2001). The research findings are so compelling that the American who used PCOMS with their therapists Psychological Association’s (APA) Division 29 (feedback condition) demonstrated sta- Task Force on Empirically Supported Relation- tistically significant treatment gains ships advised practitioners “to routinely monitor when compared to clients receiving patients’ responses to the therapy relationship treatment as usual (no-feedback condi- and ongoing treatment. Such monitoring leads to increased opportunities to repair alliance rup- tion). Clients using PCOMS were also tures, to improve the relationship, and to avoid more likely to experience reliable premature termination” (Ackerman et al., 2001, change and in fewer sessions. A sur- p. 496). Continuous feedback provided by clients vival analysis demonstrated that ap- can help therapists determine when therapy is not proximately 50% of the clients in the effective, identify client deterioration, and pro- feedback condition demonstrated reli- vide opportunities to make the necessary changes to the treatment or approach (Lambert et al., able change after the 7th (graduate 2001). In addition, Brown and Jones (2005) training clinic) or 9th session (univer- stated that continuous client feedback can assist sity counseling center). Further find- in improving the therapeutic relationship and in making referrals when appropriate. Lambert and his colleagues at Brigham Young University have accumulated an impressive body Robert J. Reese, Department of Educational, School, and of evidence for the utility of tracking outcome Counseling Psychology, University of Kentucky; Larry Nor- across treatment (e.g., Lambert, Whipple, et al., sworthy, Department of Psychology, Abilene Christian Uni- 2001; Whipple et al., 2003). Lambert, Whipple, versity; and Steve Rowlands, University Counseling Center, et al.’s (2001) system is based on using the Out- Abilene Christian University. Correspondence regarding this article should be addressed come Questionnaire 45 (OQ45; Lambert et al., to Robert J. Reese, PhD, Department of Educational, School, 1996) that is completed by the client to measure and Counseling Psychology, 235 Dickey Hall, University of weekly outcome and to provide feedback to the Kentucky, Lexington, KY 40506-0017. E-mail: jeff.reese@uky therapist on progress or lack thereof. Scores are .edu tracked using a “signal system” that identifies if a 418
- 2. Continuous Feedback System client is progressing as expected. If not, the ther- has no effect on clients with predicted positive apist is to intervene by changing the course of outcome. In addition, the collective results from treatment and/or assessing the reason(s) for the four large-scale studies suggest that measuring, lack of progress. A meta-analysis (Lambert, monitoring, and predicting treatment failure en- Whipple, & Hawkins, 2003) that summarized hances treatment outcome for clients who do not three of Lambert and colleagues’ previous studies have high likelihood of positive outcomes but found a medium effect size of .39 across the yield little impact for other clients (Lambert, Har- studies when comparing the treatment gains of mon, Slade, Whipple, & Hawkins, 2005). More clients identified as deteriorating (had declined, recently, however, Harmon et al. (2007) found on average, half of a standard deviation) who that using continuous assessment was helpful to were in the feedback group (therapists were pro- all clients, although those not expected to make vided feedback) versus the no-feedback group. progress from receiving treatment benefited Using continuous assessment to identify clients more. Taken as a whole, there appears to be solid that are not benefiting from therapy has consis- evidence that regularly monitoring client tently been found to increase the likelihood of progress increases the likelihood of a client stay- “turning things around” in therapy. ing with treatment and having a positive treat- Research on continuous assessment has been ment outcome. extended to investigate how to maximize the use Building on the extant psychotherapy outcome of outcome data. Examples include assessing literature, Miller and Duncan (2004) developed a whether sharing outcome assessment results with feedback system called the Partners for Change therapists and clients is more effective than shar- Outcome Management System (PCOMS) that ing the results with only therapists (Harmon et uses two brief measures to track outcome and the al., 2007; Hawkins, Lambert, Vermeersch, Slade, counseling relationship in every session. The sys- & Tuttle, 2004), incorporating measures of the tem can be used in individual, couples, family, or therapeutic alliance, stages of change, and social group therapy formats. Much of the system’s support to increase effectiveness (Whipple et al., appeal is that the scales used to measure outcome 2003), and assessing if using continuous outcome and the counseling relationship are much shorter data is beneficial for all clients instead of only than traditional outcome and therapeutic alliance clients identified as “not-on-track” (Lambert et measures. The Outcome Rating Scale (ORS; al., 2003). Miller & Duncan, 2000) and the Session Rating Two studies (Harmon et al., 2007; Hawkins et Scale (SRS; Miller, Duncan, & Johnson, 2000) al., 2004) have examined whether providing data are both four-item measures developed to track on treatment progress to both therapist and client outcome and the therapeutic alliance, respec- influences effectiveness. Hawkins et al. (2004) tively. The proposed advantage is that the mea- found that providing feedback data on treatment sures’ brevity makes implementation by clini- progress to both clients and therapists was asso- cians more likely. Although other factors (e.g., ciated with statistically significant gains in treat- training and treatment allegiance) impact compli- ment outcome. However, Harmon et al. (2007) ance with using outcome measures, there is some failed to replicate these results, finding no incre- evidence that suggests that the amount of time mental effectiveness by allowing the client to see required to complete measures does matter. the feedback results. Studies by Whipple et al. Miller, Duncan, Brown, Sparks, and Claud (2003) and Harmon et al. found that adding mea- (2003) reported that compliance rates for the sures of the therapeutic alliance, motivation to ORS and SRS at one site was 86% compared to change, and perceived social support for clients 25% at another site using the OQ45. identified as not-on-track via continuous assess- The development of PCOMS was based on ment demonstrated incremental effectiveness Lambert Whipple, et al. (2001) continuous as- over just using continuous feedback alone. Dete- sessment system using the OQ45. In addition to rioration rates were reduced from 21% to 8%. the discrepancy in length of the measures, other Successful outcome rates increased from 21% substantial and potentially important differences to 50%. exist. First, PCOMS is viewed as part of the Percevic, Lambert, and Kordy (2004) found therapy process. During sessions the therapist and that most continuous assessment studies indi- client examine the feedback data together. Al- cated providing continuous feedback to therapists though there is research on clients seeing their 419
- 3. Reese, Norsworthy, and Rowlands OQ45 outcome data (e.g., Hawkins et al., 2004) a Method comprehensive literature review did not reveal any studies that examined the process of therapist Participants and client going over feedback data collabora- Clients. Study 1 was composed of clients tively. Second, PCOMS assesses the therapeutic (N 74) that received individual therapy at a relationship every session, with every client. Re- university counseling center (UCC) on the cam- search on using the OQ45 (e.g., Whipple et al., pus of a small-to-medium, private southwestern 2003) has investigated the impact of assessing the university during the course of an academic year. therapeutic relationship, but only when there is a The UCC serves enrolled university students. Ini- lack of progress in treatment. Duncan et al. tially the study included 131 participants, but 57 (2003) argued that one advantage of assessing the were excluded because they either did not return relationship every session, particularly early in for a second session (N 24; pretreatment ORS, treatment, is that it allows for immediate response M 19.24, SD 8.90) or did not comply with within the session. the treatment protocol (N 33; pretreatment Initial results from research by Duncan and ORS, M 21.83, SD 10.05). Noncompliance Miller on PCOMS have been positive; finding occurred in two ways: participants in the feed- that its use has resulted in fewer premature ter- back condition not completing the ORS and SRS minations and increased effectiveness. For exam- in at least 50% of the sessions (N 5; pretreat- ple, in a study that had 6,424 clients who received ment ORS, M 21.65; SD 8.68) or the par- services through a telephone-based employee as- ticipants in the no-feedback condition failing to sistance program, Miller, Duncan, Brown, Sor- complete the posttest measures (N 28; pretreat- rell, and Chalk (2006) found that effect sizes ment ORS, M 21.86, SD 10.30). Such a increased from .37 to .79 when their system was compliance/completion rate is consistent with implemented. All measures were administered other continuous assessment studies that are ther- over the telephone. Miller and Duncan also re- apist dependent (Whipple et al., 2003). An anal- ported that their measures generate reliable and ysis of variance (ANOVA) did not find pretreat- valid scores (Duncan et al., 2003; Miller et al., ment functioning differences between those 2003). Although the number of clinicians using included in the study (ORS, M 19.93; SD this feedback system has been increasing, little 8.50) and the two excluded groups, F(2, 128) research has been conducted to replicate their 0.23, p .05. findings. In addition, much of their evidence cited The final client sample consisted of 53 women is based on samples that received services via the and 18 men; three participants did not indicate telephone. their sex. The majority of the sample was White We sought to replicate their research by con- (78.4%), 4.1% was African American, 2.7% ducting two studies that utilized PCOMS with Asian American, 6.8% Hispanic/Latino, and clients in a university counseling center (Study 1) 5.4% were international students. There were two and a community-based graduate training clinic participants who did not indicate ethnic/racial (Study 2). Specifically, we had three hypotheses. origin. The mean age was 20.17 years (SD First, we hypothesized that clients in a feedback 1.90), with ages ranging from 18 to 27. condition (used PCOMS) would exhibit greater Although roughly half of the participants were pre/postresidual treatment gains on ORS scores originally randomly assigned to the feedback compared to clients in a no-feedback condition (N 60) and no-feedback conditions (N 53), that did not use PCOMS. Second, we hypothe- 50 participants were in the final feedback group sized that more clients in a feedback condition and 24 were in the no-feedback group. This dis- would experience reliable change than clients in a parity is due to the ease of having posttest data no-feedback condition as measured by the ORS. from the feedback group because data were col- Third, we posited that clients in the feedback lected every session coupled with the difficulty of condition would demonstrate reliable change getting therapists in the no-feedback group to more quickly (i.e., have a steeper dose- remind participants to complete the posttest mea- response curve) than those assigned to a no- sure. The pretest measures of those in the no- feedback condition. feedback group who completed posttest data 420
- 4. Continuous Feedback System were not statistically significantly different from members provided 391 (72.41%) of the 540 ses- those who failed to do so, t(48) .30, p .05. sions. For Study 2, all of the 446 sessions at the Study 2 was composed of clients (N 74) that MFC were provided by 17 second-year practicum received individual therapy over the course of an students enrolled in a master’s marriage and fam- academic year at a graduate training clinic for a ily therapy program. Practicum students at both marriage and family therapy master’s program sites received weekly individual supervision. (MFC). The MFC is located on the same campus Theoretical orientations of the therapists in both of the UCC. Practicum students provide individ- studies consisted of cognitive– behavioral, family ual, couples, and family therapy services based systems, solution-focused, or an integrated/ on a sliding-scale fee for clients from the sur- eclectic approach. rounding community. Only clients that received individual therapy were included in the study. Measures Initially the study had 96 clients (52 feedback condition, 44 no-feedback condition), but 22 ORS. The ORS (Miller & Duncan, 2000) were excluded because they did not return for a consists of four items that are measured using a second session (N 8; pretreatment ORS, M visual analog scale. The items were adapted from 14.53, SD 5.68), complete the ORS and SRS the three areas of the OQ45 (Lambert et al., measures consistently in the feedback condition 1996). Specifically, clients respond to how they (N 4; pretreatment ORS, M 16.48, SD are doing Socially (work, school, friendships), 3.93) or complete a measure at posttreatment in Interpersonally (family, close relationships), and the no-feedback condition (N 10; pretreatment Individually (personal well-being). An Overall ORS, M 18.71, SD 8.20). Pretreatment (general sense of well-being) score is also ob- functioning mean comparisons of those included tained. Clients make a hash mark on each of the in the study compared to the two groups of par- four analog scales that are 10 cm in length, with ticipants excluded (i.e., attended only one session scores on the left side of the scale indicating or did not complete the measures as directed) lower functioning and scores on the right indicat- were not statistically significant, F(2, 93) 1.04, ing higher functioning. Using a ruler to measure p .05. the distance from the left end of the scale to the The final client sample consisted of 51 client’s hash mark, the score is recorded for each women and 21 men; two clients did not indi- item. The scores are then totaled, ranging from 0 cate sex. The majority of the sample was White to 40. (79.6%), 3.7% was African American, 14.6% Using a sample of 34,790 participants, a clin- was Hispanic/Latino, and 2.1% did not indicate ical cut-off score of 25 was determined (77th ethnicity/race. The mean age for clients was percentile for a nontreatment sample), meaning 32.96 (SD 12.32) with ages ranging from 18 that clients who score below 25 are more typi- to 69. The ORS was administered every session cally found to benefit from therapy, whereas for Study 2 to facilitate the collection of post- those scoring above 25 are more consistent with treatment data for the no-feedback condition. a nonclinical population and less likely to im- This change appeared to have been marginally prove in psychotherapy (Miller & Duncan, 2004). helpful, with 45 clients in the feedback condi- Miller et al. (2003) also found that the ORS tion and 29 in the no-feedback condition. The discriminates well among clients and nonclients. mean pretreatment ORS score for those that did Initial research has indicated that the ORS gen- not complete the ORS at posttreatment (19.78) erates reliable scores among individuals who re- in the no-feedback condition was nearly iden- ceive therapy in a community mental health cen- tical to those that did (19.64). ter. Miller et al. (2003) conducted a psychometric Therapists. The therapists in Study 1 were study and reported an internal consistency coef- comprised of both professional staff and practi- ficient of .93. Test–retest reliability from the first cum students at the UCC. There were five pro- to second session was .60. The internal consis- fessional staff members, all master’s level prac- tency for the ORS for the two current samples titioners with a mean of 8 years of experience, was .88 and .84, respectively. The test–retest and five second year practicum students (second reliability from the first to second session was .51 or third practicum) enrolled either in a master’s in Study 1 and .72 for Study 2. However, Ver- counseling or clinical psychology program. Staff meersch, Whipple, and Lambert (2004) reported 421
- 5. Reese, Norsworthy, and Rowlands that it is likely that test–retest coefficients will be statistically significantly associated with better attenuated for outcome measures that are de- outcome. When compared to clients who did not signed to be sensitive to change, particularly from use the SRS, clients who used the SRS were three the first repeat administration. more times likely to attend their next session and Evidence for construct validity (also from the experienced more change during treatment. The Miller et al. study) found a correlation coefficient cut-off score of 36 was derived from a sample of of .59 between the ORS and OQ45. Miller et al. 15,000 clients of whom only 24% scored below (2003) also provided further evidence for con- 36 and were “at a statistically greater risk for struct validity because client gains across therapy dropping out of or experiencing a negative or null were demonstrated. Lambert et al. (1996) stated outcome from treatment” (Miller and Duncan, that evidence for construct validity can be estab- p. 14). lished by showing that scores differ from those obtained at the beginning of treatment. SRS. The SRS (Miller et al., 2000) consists PCOMS of four items that are measured via a visual ana- log scale. Based on Bordin’s (1979) pantheoreti- This study followed the protocol as outlined in cal definition of the therapeutic alliance and an the scoring and administration manual for inclusion of the client’s theory of change, the PCOMS (Miller & Duncan, 2004). A client is scale assesses the therapeutic relationship (“I felt administered the ORS at the beginning of every heard, understood, and respected”), goals and session with the therapist present. After complet- topics covered in therapy (“We worked on or ing the ORS (approximately one minute), the talked about what I wanted to work on or talk therapist scores the items with a ruler (or com- about”), the approach used in therapy (“The ther- puter software is now available for administration apist’s approach is a good fit for me”), and the and scoring) and totals up the items. The items overall rating of the session (“Overall, today’s are then charted on an ORS graph that indicates a session was right for me”). Clients make a hash client’s progress, or lack thereof, across the mark on each of the four analog scales that are 10 course of treatment. A composite score below 25 cm in length, with scores to the left of the scale indicates that a client has a level of distress con- indicating less satisfaction and scores on the right sistent with people typically found in therapy. indicating higher satisfaction for each item. Once The scores can be used to frame content or to again, a ruler is used to measure the distance from give a therapist an area to focus on in session. the left end of the scale to the hash mark. The Discretion is given to the therapist to decide how individual items are then recorded and totaled, to best integrate the scores within a given session. ranging from 0 to 40. A clinical cut-score of 36, However, general guidelines are provided for or if any one item is below a 9, is used to denote when there is/are problem(s) with the therapeutic how to proceed clients that do not improve (less alliance. Initial research has indicated the SRS than a gain of 5 points), “deteriorate” during generates reliable and valid scores. Duncan et al. therapy (scores go down at least 5 points), have (2003) found that with a sample of 337 commu- “reliable change” (a gain of 5 or more points) or nity mental agency clients, the SRS had a coef- demonstrate “clinically significant improvement” ficient alpha of .88 and possessed a correlation (i.e., demonstrating at least a 5 point gain and coefficient of .48 with the Helping Alliance traversing the ORS cut-score of 25 during treat- Questionnaire–II (HAQ–II; Luborsky et al., ment). We have included a brief description of 1996). Test–retest reliabilities averaged .74 how to proceed with clients in each category across the first six sessions with the SRS com- (see Miller & Duncan, 2004, for a complete pared to .69 for the HAQ–II. Internal consistently description). estimates for the current samples were .88 (Study No change. For a client that has not shown 1) and .90 (Study 2). The SRS test–retest coeffi- reliable change (a gain of 5 points) after three cient from Session 1 to Session 2 was .66 (Study sessions, therapists are directed to address the 1) and .54 (Study 2), which is comparable to therapeutic alliance and the course of treatment. Miller et al.’s (2003) finding of .60. If the client has not demonstrated reliable im- Miller and Duncan (2004) found that increases provement after six sessions, the manual suggests on the SRS during the course of treatment were consultation, supervision, or staffing. 422
- 6. Continuous Feedback System Deteriorating last ORS score was used as the posttreatment measure for the feedback condition and those in Clients in this category are considered to be the no-feedback condition completed a post-ORS at-risk for terminating prematurely or having a measure. poor outcome. Therapists are directed to discuss Study 2. This study took place the next aca- possible reasons for the drop in score, review the demic year after Study 1. Clients at the MFC also SRS items with the client to assess the therapeu- used PCOMS but had two deviations from the tic alliance or consider changing the treatment Study 1 protocol. First, clients in the no-feedback approach, frequency, mode, or even therapist if condition completed the ORS at the beginning of no improvement is noted after three sessions. each session, rather than just at the beginning and Reliable change. Treatment is going accord- end of treatment, to help increase compliance ingly. Therapists are advised to reinforce changes with collecting posttreatment data. Doing this and to continue treatment until progress begins to also allowed for comparison of outcome with plateau, then a therapist should consider reducing clients not progressing in treatment, a proposed the frequency of sessions. advantage of continually monitoring client out- Clinically significant change. The client is come, and to compare dose response curves of likely no longer struggling with issues that led both the feedback and no-feedback groups. The to seeking therapy. Therapists are advised to ORS results were not seen or scored by the ther- consolidate changes, anticipate potential set- apist or shared with clients in the no-feedback backs, and to consider reducing the frequency condition. Second, therapists, rather than clients, of sessions. were randomly assigned to the feedback and no- Toward the end of every session, the SRS is feedback conditions because the graduate faculty administered to the client and again scored by the over the MFC felt that it would be too cumber- therapist (approximately one minute). If the total some and confusing for beginning practicum stu- score is below 36 or one of the items is below 9, dents to deviate from their normal treatment par- the therapist intervenes and inquires about the adigm by alternating between the two conditions. reason for the lower scores. The total score is Therapists for both studies were trained to ad- then charted on a graph for the corresponding minister, score, and provide feedback to clients session. via the training manual provided for the ORS and SRS (Miller & Duncan, 2004). The first author of Procedure the current study conducted a 1-hr training ses- sion for the therapists and practicum supervisors. Study 1. Clients for an academic year at the A summary handout was also provided to each UCC were assigned by the director to either the therapist as a reminder of how to follow the feedback group or no-feedback condition via a protocol if needed. Two case studies were pro- randomized block design to help control for vided in the training to facilitate application of therapist effects. All of the clients were new PCOMS. In the feedback condition, progress was clients at the UCC, not having received services tracked, charted, and discussed with the client there previously. Approximately half of the new every session. The no-feedback condition re- clients assigned to therapists were in the feedback ceived treatment as usual and did not utilize group and the other half were in the no-feedback PCOMS. For both studies, copies of ORS/SRS group. Clients in the feedback condition com- measures were made by therapists and placed in pleted the ORS at the beginning of each session a collection box for the measures to be rescored and the SRS at the end of each session. Partici- before being entered into a database to ensure pants in the no-feedback condition completed the scoring accuracy. Any scoring errors were re- ORS at the beginning and end of treatment. The layed to the therapist to correct the original cop- SRS was not administered to the no-feedback ies kept in the client’s file. condition. There was a concern that exposing the clients to the items might unduly influence their Results perceptions/expectations of treatment, leading to a possible deviation from a “treatment as usual” Pre- and posttest ORS mean total scores and paradigm. If a client had not completed treatment standard deviations for each of the treatment con- by the end of the academic year, the participant’s ditions in both studies can be observed in Table 1. 423
- 7. Reese, Norsworthy, and Rowlands TABLE 1. Means and Standard Deviations of the ORS for tistically significant more change than those in the Feedback and No-Feedback Conditions the no-feedback group, F(1, 72) 7.51, p .01, 2 Feedback No feedback .10. The therapist covariate was not statis- tically significant, F(1, 72) 1.10, p .05, 2 ORS total M SD M SD .01. Using a Cohen’s d to compute an effect size Study 1 as is typically found in psychotherapy outcome Pre 18.59 7.60 22.71 9.70 studies that compare treatments, medium to large Post 31.28 6.63 29.53 7.26 effect sizes were found for both Study 1 (d .54) Study 2 Pre 18.68 10.39 19.64 6.46 and Study 2 (d .49). Post 29.51 9.58 24.33 7.51 Although clients in the feedback condition demonstrated larger treatment gains, they did not Note. ORS Outcome Rating Scale. attend statistically significantly more sessions on average than the no-feedback condition in Study To assess if pretreatment ORS mean scores were 1 (6.27 vs. 5.66), t(72) 0.51, p .05, or Study different for the feedback and no-feedback con- 2 (8.02 vs. 5.79), t(72) 1.74, p .05. We ditions, independent samples t tests were com- found it interesting that in Study 1 professional puted and found that the pretreatment mean dif- staff and practicum students had equivocal pre- ferences were not statistically significant for post ORS treatment outcomes for clients that either Study 1, t(72) 1.99, p .05, or Study 2, were seen in the feedback group, F(1, 48) .00, t(72) 0.49, p .05. This indicates that the p .05, 2 .00, and for all clients irrespective initial random assignment appears to have been of treatment condition, F(1, 72) .03, p .05, 2 effective in creating equivalent groups for both .00. samples. The mean SRS total scores for the feed- Another common way to assess psychotherapy back condition were both at the upper end of the outcome is to view the number of clients who continuum and had little variability (Study 1: incur clinically significant change (Lambert, M 35.94, SD 4.22, range 20.90; Study 2: Hansen, & Bauer, 2008). Posited by Jacobson M 37.09, SD 3.79, range 14.00). Partic- and Truax (1991), there are two criteria for es- ipants in the feedback condition generally felt tablishing clinically significant, or meaningful, favorable about the alliance with their therapist. change in psychotherapy. The first criterion, “re- Individuals in each study’s client feedback liable change,” is the increase or decrease of a condition reported more treatment gains on the client’s score on an outcome measure that ex- ORS compared to the no-feedback condition. The ceeds the measurement error for the instrument. client feedback groups reported mean treatment The second criterion, “clinical significance,” re- gains of 12.69 (Study 1) and 10.84 (Study 2) quires reliable change and that the client started points whereas the no-feedback groups reported treatment in the clinical range and concluded mean treatment gains of 6.82 and 5.04, respec- treatment in the nonclinical range based on an tively. For Study 1, a repeated-measures established cut-score. Jacobson and Truax’s for- ANOVA indicated that therapy gains were statis- mulas were used to establish a reliable change tically significant across both groups, F(1, 72) index (RCI) of 5 points and a cut-score of 25 for 60.32, p .00, 2 .46, but the interaction the ORS that was based on two studies (Miller et between the treatment condition and time (pre- al., 2003; Miller, Mee-Lee, & Plum, 2005) that post) on the ORS total score indicated that those used samples from a community mental health in the feedback condition had statistically signif- and a residential alcohol and drug treatment cen- icant more change than the no-feedback condi- ter, respectively. Specifically, reliable change is tion, F(1, 72) 5.46, p .05, 2 .07. For denoted by a 5-point increase indicating “im- Study 2, a repeated-measures ANOVA with ther- provement,” whereas a 5-point decrease is con- apist added as a covariate (because therapists sidered to indicate “deterioration.” were assigned to either the feedback or no- The less stringent criterion of reliable change feedback condition) indicated that therapy gains was used in this study, because 28.4% of the were statistically significant for all clients, F(1, university counseling center sample began treat- 72) 22.76, p .00, 2 .24. The interaction ment in the nonclinical range, and other research- between treatment condition and time also found ers have suggested that using reliable change was that those in the feedback group experienced sta- appropriate for university counseling centers 424
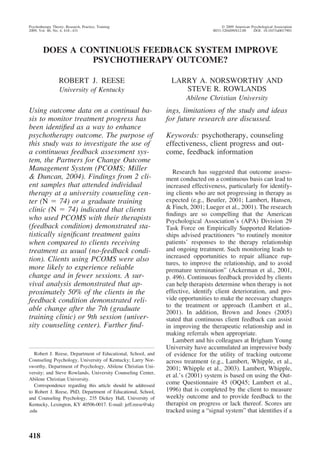
- 8. Continuous Feedback System given the likelihood that the population would .05, 2 .07. However, please note that the generally report less distress (Snell, Mallinck- effect size of .07 is comparable to the effect rodt, Hill, & Lambert, 2001). In Study 1 (see size of .10 for the entire sample; the lack of Table 2), the continuous feedback condition in- statistical significance is likely a function of a curred reliable change on the ORS more fre- small sample size. The NP clients in both the quently when compared to the no-feedback con- feedback and no-feedback conditions attended dition (80% vs. 54.2%). A chi-square analysis nearly the same number of sessions, 6.9 and 5.9 found a statistically significant difference be- sessions, respectively. tween the feedback and no-feedback groups, One way of analyzing the dose-response curve 2 (1, N 74) 5.32, p .05. Very few clients is to assess when clients achieve reliable change in both groups reported deteriorating during treat- as defined earlier. To do so, a survival analysis ment. In Study 2, a higher percentage of feedback was computed, a nonparametric statistic com- condition participants (66.67%) also incurred re- monly used with longitudinal data that provides liable change compared to clients in the no- an estimate of the percentage of clients that will feedback condition (41.40%). A chi-square anal- demonstrate reliable change from session-to- ysis also found a statistically significant session. The possibility exists that a client could difference, 2(1, N 74) 4.60, p .05. As in incur a 5-point improvement and then regress in Study 1, few clients demonstrated deterioration latter sessions. For this analysis, reliable change across treatment. was only noted when there was no subsequent We compared clients in both the feedback con- regression before treatment ended. First, an anal- dition (n 16) and no-feedback condition (n ysis using Cox regression was computed with 11) that were identified as not progressing (NP) therapist (professional staff vs. practicum stu- to evaluate if feedback was helpful for clients at dents) selected as a covariate to see if multiple- risk for poor outcome. This comparison could survival curves needed to be computed. The over- only be made in Study 2, because clients in the all goodness of fit chi-square value was no-feedback condition completed the ORS every statistically significant for the regression model, 2 session. Consistent with the administration and (2, N 354), 6.49, p .05. Therapist was scoring manual, a NP client was identified as statistically significant ( .434, Wald 6.18, having improved less than 5 points on the ORS df 3, p .05), indicating that clients assigned after three sessions as (Miller & Duncan, 2004). to professional staff demonstrated improvement The NP clients in the feedback condition showed more quickly than clients paired with a practicum larger treatment gains (6.06 vs. 2.48 points) at the student. A Kaplan–Meier survival analysis was end of treatment than the no-feedback condition. then conducted to create separate survival curves However, a repeated-measures ANOVA did not for professional staff and practicum students to find statistically significant pre/posttreatment estimate the median number of sessions needed scores between the groups, F(1, 25) 1.59, p to acquire reliable change (see Figure 1). Data for clients that had not achieved reliable change were censored. The survival analysis found that 51% TABLE 2. Percentage of Clients in Feedback and No- of the clients in the feedback condition were Feedback Conditions Who Achieved Reliable Change at estimated to achieve reliable change after a me- End of Treatment dian of nine sessions. For clients of professional Feedback No feedback staff, 50% of the clients were estimated to achieve reliable change after a median of seven Classification n % n % sessions and clients of practicum students were Study 1 estimated to take a median of 12 sessions. Deteriorated 2 4.00 3 12.50 A survival analysis was also conducted for No change 8 16.00 8 33.30 Study 2 to assess the median number of sessions Reliable change 40 80.00 13 54.20 Study 2 estimated for clients to obtain reliable change. Deteriorated 2 4.44 1 3.44 Reliable change was used as the criterion to No change 13 28.89 16 55.16 maintain consistency with Study 1 for compari- Reliable change 30 66.67 12 41.40 son purposes. Four clients were removed from Note. 2 4.60, p .05 (Study 1), 2 16.67, p .01 the analysis (two from each condition) because (Study 2). their initial ORS scores were above 35 and made 425
- 9. Reese, Norsworthy, and Rowlands 1.0 0.8 therapist Percentage of Clients Improved staff intern staff-censored intern-censored 0.6 0.4 0.2 0.0 1 2 3 4 5 6 7 8 9 10 11 12 13 14 15 Session FIGURE 1. Study 1 survival plots of reliable change rates for clients of professional staff and practicum students in the feedback condition by session. it impossible to achieve reliable change. A Cox Discussion regression model was computed to assess if there were differences in the recovery rates for Two studies were conducted to evaluate an the feedback and no-feedback conditions. The increasingly used continuous assessment system, overall goodness of fit chi-square value was PCOMS (Miller & Duncan, 2004), the first using statistically significant, 2(1, N 296), a sample of psychotherapy clients in a university 5.59, p .05, indicating that those in the both counseling center and the second a sample of conditions achieved reliable change at different psychotherapy clients in a community-based rates. A Kaplan–Meier survival analysis was graduate training clinic. In general, both studies conducted to view the survival curves for the replicated the positive findings that Miller and feedback and no-feedback groups separately Duncan reported in other studies (Miller et al., (see Figure 2). The survival analysis found that 2003; Miller, Duncan, Sorrell, & Brown, 2005). 56% of the clients in the feedback condition The results indicated that clients in the feedback were estimated to achieve reliable change after condition (i.e., clients that completed an outcome a median of 7 sessions whereas 52% of the and alliance measure every session and reviewed clients in the no-feedback condition were esti- these results in session), reported more change mated to achieve reliable change after a median than those in the no-feedback condition (i.e., re- of 10 sessions. ceived therapy in a treatment as usual format). 426
- 10. Continuous Feedback System 1.0 0.8 group Percentage of Clients Improved experiemental control experiemental- censored control-censored 0.6 0.4 0.2 0.0 1 2 3 4 5 6 7 8 9 10 11 12 13 14 15 Session FIGURE 2. Study 2 survival plots of client reliable change rates for the feedback and no-feedback conditions by session. The majority of clients in the feedback group of those who completed a treatment program for evidenced reliable change by the end of treat- alcohol and substance use. ment. Last, a survival analysis in Study 2 dem- Medium to large effect sizes were found in onstrated that clients in the feedback condition both studies (d .54 and .49). Wampold et al. were estimated to achieve reliable change in (1997) found in a meta-analytic study that effect fewer sessions than those in the no-feedback con- sizes for compared psychotherapy treatments did dition. not exceed .21. However, Whipple et al. (2003) found a larger effect size (d .70) when com- Improved Outcome paring a continuous assessment system to a con- Individuals in both the feedback and no-feedback trol group using the OQ45 for clients identified as conditions showed statistically significant improve- at-risk for terminating prematurely or having a ment on pre/postmeasures of the ORS total score. In poor treatment outcome. When examining out- both studies the feedback group showed roughly come from a reliable change perspective, the twice as much improvement as the no-feedback results are just as impressive. There were many group (12.69 points vs. 6.82 points in Study 1; more clients in the feedback condition that re- 10.83 vs. 4.69 points in Study 2). This amount of ported reliable change at the end of treatment improvement is similar to the 10.8 point gain that compared to the no-feedback condition (80% vs. Miller, Duncan, et al. (2005) reported from a study 54.2% in Study 1; 66.67% vs. 41.4% in Study 2). 427
- 11. Reese, Norsworthy, and Rowlands One of the biggest advantages proposed for participants in the feedback condition estimated using continuous assessment is that therapists can to demonstrate reliable change after a median of more readily identify clients not progressing in seven sessions compared to 50% of the partici- treatment. If identified early, a therapist can in- pants in the no-feedback condition estimated to tervene and assess why the client is not improv- require a median of 10 sessions. ing before the client terminates prematurely or The dose-response curve for both studies ap- has a negative outcome in therapy. In Study 2, the pears to be consistent with other outcome re- results indicated that clients in the feedback search utilizing survival analysis. For example, group who were not progressing by the third Wolgast, Lambert, and Puschner (2003) found session demonstrated greater treatment gains than that it took an estimated 10 sessions for 51% of a those in the no-feedback group. However, the sample of 788 university counseling clients to difference between the mean number of sessions evidence and maintain reliable change as mea- attended was nearly identical (five or six ses- sured by the OQ45. In another example, Ander- sions). This may be due to the pretreatment son and Lambert (2001) found 50% of clients in means for the feedback group being much higher a university-training clinic were estimated to ev- (25.06 vs. 20.06); therefore, perhaps requiring idence reliable change on the OQ45 after nine fewer sessions. sessions. These findings seem consistent with previous research; using continuous outcome assessment Limitations of the Study appears to lead to better treatment outcomes for those that are not-on-track early in treatment. There are several limitations in both studies. However, when comparing feedback and no- The largest concern is the number of clients ex- feedback pre/post-ORS treatment gains the effect cluded. Of the original 237 possible participants size for clients not progressing was similar to the across both studies, 89 participants could not be effect size for the entire sample. Previous re- included. The biggest problem was the number of search has been mixed on this (Harmon et al., participants in the no-feedback condition that did 2007; Lambert et al., 2005) but has generally not complete the posttreatment ORS (n 34). An found that clients not progressing early in therapy attempt was made to correct the difficulty with benefit more from tracking outcome. This study collecting posttreatment measures by having partic- provides evidence that all clients, not just those ipants in Study 2 complete the ORS every session. projected to do poorly, benefit from using a con- Although this led to some improvement, it was still tinuous assessment system. PCOMS, however, is problematic. Frequent reminders were sent on a implemented differently than other continuous monthly basis, but appeared to have little impact assessment systems. These differences are dis- with the no-feedback group. Once again, the pre- cussed further in this section. treatment difference between those in the no- Dose-response curve. In Study 1, half of the feedback condition that did or did not complete feedback group was estimated to have met the the posttreatment measure was not statistically criterion for reliable change after a median of significant. nine sessions. We found it interesting that clients It is important to note that half of those ex- assigned to professional staff were more likely to cluded in both studies did not return for a second evidence reliable change sooner (Session 7) com- session (n 45). The possibility exists that some pared to clients assigned to a practicum student did not return because using PCOMS was not (Session 12). However, practicum students were appealing. Because of the concern that eliminat- just as effective as professional staff when ob- ing data of these clients might bias or skew the serving pre/post-ORS treatment gains in the feed- data favorably, analyses were rerun with those back condition and across treatment conditions. who attended one session using the pretreatment The results seem to indicate that ultimate out- score as the posttreatment score. None of the come is equivalent but clients paired with profes- analyses revealed differences that would have sional staff improved more quickly. This finding influenced the findings and conclusions of the did not appear to be replicated in Study 2. The study. dose-response finding with the MFC sample was Another limitation is the large number of cli- similar to the survival curve for clients seen by ents that had missing session data. A decision professional staff at the UCC, with 54% of the was made to exclude participants that had not 428
- 12. Continuous Feedback System completed the ORS and SRS for at least half of verse cultural and ethnic/racial backgrounds. For their sessions for both studies (n 10). The example, PCOMS assumes a collaborative, decision was made to limit the possibility of client-directed process but this approach may be underestimating the intervention effect; however, less preferred with clients from cultures that em- 28 participants in the feedback condition (29.47% phasize deference to professionals. across both studies) still had at least one session Second, future research should focus on why with missing data (i.e., the ORS and SRS was not PCOMS has been found effective for all clients given). The impact of not using PCOMS every not just those identified at risk for terminating session is unknown; it is plausible that inclusion prematurely. Research on monitoring outcome of data with sessions skipped led to underestimat- throughout treatment (Lambert et al., 2005) has ing the treatment effects. However, the differ- generally indicated that outcome is only en- ences in treatment outcome gains were not dif- hanced for those who are projected to do poorly ferent for this group compared to participants in treatment. However, it is not understood why with no missing data. Future research could com- clients progressing as expected would benefit. pare tracking outcome every second or third ses- Therapists, in this case, would not appear to have sion to every session, particularly given that some a need to change or alter anything. A possible clinics and university counseling centers already study would be to compare PCOMS to other use continuous assessment systems in such a continuous assessment systems. PCOMS assesses manner. the therapeutic relationship with all clients, but A related limitation was not monitoring treat- Lambert and colleagues’ signal system uses a ment integrity. No manipulation checks were measure of the therapeutic relationship only after done to assess how well PCOMS was imple- a client is identified as deteriorating or not pro- mented. Completing the measures is only part of gressing as expected (e.g., Whipple et al., 2003). the system; it was unknown if the measures were Both acknowledge the importance of the thera- discussed and implemented within session appro- peutic relationship in relation to outcome (Hor- priately. In addition, participant and therapist dy- vath & Bedi, 2002), but does the ability to discuss ads who complied with the study protocol may problems with the therapeutic alliance immedi- have been different from dyads that did not com- ately with clients, rather than retrospectively, ply. Therapists complied with some clients but not other clients. Reasons cited by therapists matter? were: “I forgot” or “I was too busy” or “The Third, future study should also consider the client could not wait.” It seems reasonable that potential influence of demand characteristics or client characteristics influenced therapist compli- social desirability inflating the scores due to com- ance, as well as general therapist attitudes toward pleting the measures in the therapist’s presence using the system. Resistance to using the system and then discussing the scores with the therapist. was not perceived to be a general problem, but it This appears more likely to be a problem for the certainly did occur at some level. Conversely, SRS than the ORS. Many clients do hide things some of the therapists expressed frustration at from their therapist, but they are more likely to having a useful tool at their disposal but not being withhold an immediate negative reaction to the able to use it with certain clients in the no- therapist or session than to hide or misrepresent feedback condition, particularly clients they felt their level of distress (Farber, 2003). An addi- were not progressing. It may be that some ther- tional possibility is that seeing the measures con- apists were applying the system verbally with sistently may create an expectancy effect that these clients. improvement should occur. Conversely, having access to weekly feedback regarding the relation- ship may serve to heighten attention and focus on Future Study the therapeutic alliance and promote active col- Given the positive results, continued replica- laboration. Yet another possibility is that having a tion and extension of research using PCOMS is visual prompt may also make a difference. It is warranted. Four suggestions are provided for well-established that receiving feedback on per- consideration. First, a current limitation of formance can promote positive behavior change PCOMS is that little research exists that ad- (e.g., Alvero, Bucklin, & Austin, 2001). An ex- dresses effectiveness with individuals from di- ample perhaps analogous to therapy is that fre- 429
- 13. Reese, Norsworthy, and Rowlands quent weighing has been found to promote utility. Journal of Consulting and Clinical Psychology, weight loss for dieters (Wing & Hill, 2001). 69, 197–204. BORDIN, E. S. (1979). The generalizability of the psycho- Last, it has been suggested that utilizing client analytic concept of working alliance. Psychotherapy: outcome data may be beneficial to clinical train- Theory, Research and Practice, 16, 252–260. ing and supervision (Worthen & Lambert, 2007). BROWN, G. S., & JONES, E. R. (2005). Implementation of Specifically, this would involve taking the out- a feedback system in a managed care environment: come data provided by clients and utilizing that What are patients teaching us? Journal of Clinical Psy- chology, 61, 187–198. information within clinical supervision. Worthen DUNCAN, B. L., MILLER, S. D., SPARKS, J. A., CLAUD, and Lambert (2007) proposed that using client D. A., REYNOLDS, L. R., BROWN, J. B., et al. (2003). The outcome data would facilitate the supervisor’s Session Rating Scale: Preliminary psychometric prop- ability to provide specific and critical feedback to erties of a “working alliance” measure. Journal of Brief Therapy, 3, 3–12. trainees. Hoffman, Hill, Holmes, and Freitas FARBER, B. A. (2003). Patient self-disclosure: A review of (2005) noted that almost all supervisors withhold the research. Journal of Clinical Psychology, 59, 589 – feedback regarding performance, although spe- 600. cific feedback is considered a good marker of H ARMON , S. C., L AMBERT , M. J., S MART , D. M., supervision (Lehrman-Waterman & Ladany, HAWKINS, E., NIELSEN, S., SLADE, K., et al. (2007). Enhancing outcome for potential treatment failures: 2001). Research could assess whether using Therapist-client feedback and clinical support tools. PCOMS in supervision helps supervisees provide Psychotherapy Research, 17, 379 –392. more specific and critical feedback. HAWKINS, E. J., LAMBERT, M. J., VERMEERSCH, D. A., With the increased need to demonstrate psy- SLADE, K. L., & TUTTLE, K. C. (2004). The therapeutic chotherapy’s utility due to such forces as man- effects of providing patient progress information to therapists and patients. Psychotherapy Research, 14, aged care and third-party reimbursement, mea- 308 –327. suring the progress of treatment as it occurs has HOFFMAN, M. A., HILL, C. E., HOLMES, S. E., & FREITAS, become an emerging area of study with exciting G. F. (2005). Supervisor perspective on the process and results. Ongoing feedback has been found to pre- outcome of giving easy, difficult, or no feedback to supervisees. Journal of Counseling Psychology, 52, vent premature termination and to help meet the 3–13. needs of clients in a more effective, efficient HORVATH, A. O., & BEDI, R. P. (2002). The alliance. In manner. Overall, the results of this study indi- J. C. Norcross (Ed.), Psychotherapy relationships that cated that the PCOMS approach of providing work: Therapist contributions and responsiveness to pa- outcome feedback on a client’s progress and the tients (pp. 37–70). New York, NY: Oxford University Press. counseling relationship is a useful approach and JACOBSON, N. S., & TRUAX, P. (1991). Clinical signifi- is consistent with findings by the developers. cance: A statistical approach to defining meaningful Although more research certainly needs to be change in psychotherapy research. Journal of Consult- conducted, this system appears to hold promise ing and Clinical Psychology, 59, 12–19. given its ease of use and encouraging results. LAMBERT, M. J., BURLINGAME, G. M., UMPHRESS, V., HANSEN, N. B., VERMEERSCH, D. A., CLOUSE, G. C., & YANCHAR, S. C. (1996). The reliability and validity of the Outcome Questionnaire. Clinical Psychology and References Psychotherapy, 3, 249 –258. LAMBERT, M. J., HANSEN, N. B., & BAUER, S. (2008). ACKERMAN, S. J., BENJAMIN, L. S., BEUTLER, L. E., Assessing the clinical significance of outcome results. In GELSO, C. J., GOLDFRIED, M. R., HILL, C., et al. (2001). A. M. Nezu & C. M. Nezu (Eds.), Evidence-based Empirically supported therapy relationships: Conclu- outcome research: A practical guide to conducting ran- sions and recommendations of the Division 29 Task domized controlled trials for psychosocial interventions Force. Psychotherapy: Theory, Research, Practice, (pp. 359 –378). New York: Oxford University Press. Training, 38, 495– 497. LAMBERT, M. J., HANSEN, N. B., & FINCH, A. E. (2001). ALVERO, A. M., BUCKLIN, B. R., & AUSTIN, J. (2001). An Patient-focused research: Using patient outcome data objective review of the effectiveness and essential char- to enhance treatment effects. Journal of Consulting and acteristics of performance feedback in organizational Clinical Psychology, 69, 159 –172. settings (1985–1998). Journal of Organizational Behav- LAMBERT, M. J., HANSEN, N. B., UMPHRESS, V., LUNNEN, ior Management, 21, 3–30. K., OKIISHI, J., BURLINGAME, G. M., et al. (1996). Ad- ANDERSON, E. W., & LAMBERT, M. J. (2001). A survival ministration and scoring manual for the OQ 45.2. analysis of clinically significant change in outpatient Stevenson, MD: American Professional Credentialing psychotherapy. Journal of Clinical Psychology, 57, 857– Services. 888. LAMBERT, M. J., HARMON, C., SLADE, K., WHIPPLE, J. L., BEUTLER, L. E. (2001). Comparisons among quality as- & HAWKINS, E. J. (2005). Providing feedback to psy- surance systems: From outcome assessment to clinical chotherapists on their patients’ progress: Clinical re- 430
- 14. Continuous Feedback System sults and practice suggestions. Journal of Clinical Psy- MILLER, S. D., DUNCAN, B. L., & JOHNSON, L. D. (2000). chology, 61, 165–174. The Session Rating Scale 3.0. Chicago, IL: Authors. LAMBERT, M. J., WHIPPLE, J. L., HAWKINS, E. J., VER- MILLER, S. D., MEE-LEE, D., & PLUM, W. (2005). Making MEERSCH, D. A., NIELSEN, S. L., & SMART, D. (2001). Is treatment count: Client-directed, outcome-informed it time for clinicians to routinely track patient outcome? clinical work with problem drinkers. In J. L. Lebow A meta-analysis. Journal of Clinical Psychology: Sci- (Ed.), Handbook of clinical family therapy (pp. 281– ence and Practice, 10, 288 –301. 308). Hoboken, NJ: Wiley. LAMBERT, M. J., WHIPPLE, J. L., & SMART, D. W., MILLER, S. L., DUNCAN, B. L., SORRELL, R., & BROWN, VERMEERSCH, D. A., NIELSEN, S. L., & HAWKINS, G. S. (2005). The partners for change outcome man- E. J. (2001). The effects of providing therapists with agement system. Journal of Clinical Psychology, 61, feedback on patient progress during psychotherapy: 199 –208. Are outcomes enhanced? Psychotherapy Research, 11, PERCEVIC, R., LAMBERT, M. J., & KORDY, H. (2004). 49 – 68. Computer-supported monitoring of patient treatment LEHRMAN-WATERMAN, D., & LADANY, N. (2001). Devel- response. Psychotherapy Research, 16, 364 –373. opment and validation of the Evaluation Process SNELL, M. N., MALLINCKRODT, B., HILL, R. D., & LAMBERT, Within Supervision Inventory. Journal of Counseling M. J. (2001). Predicting counseling center clients’ re- Psychology, 48, 168 –177. sponse to counseling: A 1-year follow-up. Journal of LUBORSKY, L., BARBER, J., SIQUELAND, L., JOHNSON, S., Counseling Psychology, 48, 463– 473. VERMEERSCH, D. A., WHIPPLE, J. L., & LAMBERT, M. J. NAJAVITS, L., FRANK, A., et al. (1996). The Helping (2004). Outcome questionnaire: Is it sensitive to Alliance Questionnaire (HAQ–II): Psychometric prop- changes in counseling center clients? Journal of Coun- erties. The Journal of Psychotherapy Practice and Re- seling Psychology, 5, 38 – 49. search, 5, 260 –271. WAMPOLD, B. E., MONDIN, G. W., MOODY, M., STICH, F., LUEGER, R. J., HOWARD, K. I., MARTINOVICH, Z., LUTZ, BENSON, K., & AHN, H. (1997). A meta-analysis of W., ANDERSON, E. E., & GRISSOM, G. (2001). Assessing outcome studies comparing bona fide psychotherapies: treatment progress of individual patients using ex- Empirically, “all must have prizes.” Psychological Bul- pected treatment response models. Journal of Consult- letin, 122, 203–215. ing and Clinical Psychology, 69, 150 –158. WHIPPLE, J. L., LAMBERT, M. J., VERMEERSCH, D. A., MILLER, S. D., & DUNCAN, B. L. (2000). The Outcome SMART, D. W., NIELSEN, S. L., & HAWKINS, E. J. (2003). Rating Scale. Chicago, IL: Authors. Improving the effects of psychotherapy: The use of MILLER, S. D., & DUNCAN, B. L. (2004). The Outcome early identification of treatment and problem-solving and Session Rating Scales: Administration and scoring strategies in routine practice. Journal of Counseling manual. Chicago, IL: Authors. Psychology, 50, 59 – 68. MILLER, S. D., DUNCAN, B. L., BROWN, J., SORRELL, R., WING, R. R., & HILL, J. O. (2001). Successful weight loss & CHALK, M. (2006). Using formal client feedback to maintenance. Annual Review of Nutrition, 21, 323–341. improve outcome and retention: Making ongoing, real- WOLGAST, B. W., LAMBERT, M. J., & PUSCHNER, M. J. time assessment feasible. Journal of Brief Therapy, 5, (2003). The dose-response relationship at a college 5–22. counseling center: Implications for setting session lim- MILLER, S. D., DUNCAN, B. L., BROWN, J., SPARKS, J., & its. Journal of College Student Psychotherapy, 18, 15–29. CLAUD, D. (2003). The Outcome Rating Scale: A pre- WORTHEN, V. E., & LAMBERT, M. J. (2007). Outcome- liminary study of the reliability, validity, and feasibility oriented supervision: Advantages of adding systematic of a brief visual analog measure. Journal of Brief Ther- client tracking to supportive consultations. Counselling apy, 2(2), 91–100. and Psychotherapy Research, 7, 48 –53. 431