SlideShare uma empresa Scribd logo
1 de 167
AGRICULTURAL METEOROLOGY


   Dr. S.M. Sureshkumar Dr. G. Baradhan
   Dr. S. Manimaran       Dr. N. Ramesh

         Department of Agronomy
          Faculty of Agriculture
          Annamalai University


                      1
Imprint


   2
FOREWORD


    3
PREFACE


   4
ACKNOWLEDGEMENTS


       5
CONTENTS


   6
Chapter -1
               Introduction to Agricultural Meteorology
       Agricultural    Meteorology     –    definition   of
meteorology, agro – climatology- weather and climate,
factors affecting weather and climate – climate types –
scope of Agricultural meteorology, co-ordinates of India
and Tamil Nadu – Atmosphere – stratification and
composition.
Chapter – 2
Solar Radiation and Temperature
       Solar radiation – light and heat energy – Intensity,
Quality, day length and direction of light, effect on crop
production, measurement – Temperature effect on crop
growth,   cardinal    temperature,   diurnal   and   season
variations, isotherm – soil temperature and effect on crop
growth – measurement of temperature
Chapter - 3
Atmospheric pressure and wind systems of the world
       Atmosphere pressure – pressure system – causes
for   variation,   importance,   isobar,   measurement    –
Atmospheric humidity – Absolute and specific humidity,
vapour pressure, effect on crop growth , measurement.

                             7
Wind systems of world, tropical convergence zones, speed
and direction of wind measurement – effect on crops.
Chapter – 4
Rainfall and Evaporation
      Clods,    classification       and    characteristics      –
precipitation – forms – Hydrological cycle – rainfall –
monsoons of India, onset and withdrawal, effect on crop
production – measurement of rainfall. Isohyet – artificial
rain making – evaporation and transpiration, factors
affecting evaporation.
Chapter – 5
Weather Aberrations and forecasting
       Weather aberrations – deficient rainfall (drought),
cyclone, anticyclones, hurricane, tornado, storms – effect
on   agriculture   –     phenology    and    bioclimatic      law,
Agricultural seasons of India – Agroclimatic zones of
world, India and Tamil Nadu – weather forecasting –
importance. Types – Agrimet observatory – synoptic
chart, crop weather calendar – remote sensing and crop
weather modelling – agroclimatic normals for field crops –
effect of climate and weather on crop production and pest
and diseases.


                               8
Appendix I

Appendix II


              9
10
Chapter 1


INTRODUCTION TO AGRICULTURAL METEOROLOGY
                   AND ATMOSPHERE
Meteorology
      The word meteorology was derived from a Greek
word “meteoros” means ‘above the earth’s surface’ which
is nothing but atmosphere. The meaning of “logy” is a
study of science. Therefore, meteorology is defined as a
branch of science dealing with that of the atmosphere.
Meteorology is concerned with the physical, chemical and
dynamical state of the earth’s atmosphere and it’s
interaction with the underlying surface.


      Meteorology is essentially known as observational
science dealing with different atmosphere variables such
as pressure, temperature, wind, humidity, clouds, and
radiation at a given moment. Meteorology predicts the
behavior of the atmosphere over a period of a few hours
to a few days ahead. The main task of meteorology is to
provide weather forecasting and communicate the same
in time to the users. Another important duty of the
meteorology   is   to   increase   our   knowledge   of   the

                              1
atmosphere through research and aiming at the accuracy
of weather forecast. Meteorology is a combination of both
physics and geography.


        Meteorology is the science of weather. It is
essentially an inter-disciplinary science because the
atmosphere, land and ocean constitute an integrated
system. The three basic aspects of meteorology are
observation, understanding and prediction of weather.
There    are   many   kinds     of        routine    meteorological
observations. Some of them are made with simple
instruments    like   the   thermometer             for   measuring
temperature or the anemometer for recording wind
speed. Countries around the world exchange the weather
observations through fast telecommunications channels.
These are plotted on weather charts and analyzed by
professional   meteorologists        at     forecasting     centers.
Weather forecasts are then made with the help of modern
computers and supercomputers. Weather information
and forecasts are of vital importance to many activities
like agriculture, aviation, shipping, fisheries, tourism,
defence, industrial projects, water management and
disaster mitigation. Recent advances in satellite and

                              2
computer technology have led to significant progress in
meteorology.
Agricultural meteorology
      In simple terms, agricultural meteorology is the
application of meteorological information and data for the
enhancement of crop yields and reduction of crop losses
because of adverse weather. This has linkages with
forestry, horticulture and animal husbandry. The agro
meteorologist requires not only a sound knowledge of
meteorology, but also of agronomy, plant physiology and
plant and animal pathology, in addition to common
agricultural practices. This branch of meteorology is of
particular relevance to India because of the high
dependence of our agriculture on monsoon rainfall which
has its own vagaries. So, Agricultural meteorology can
also be defined as follows:


    A branch of applied meteorology which investigates
      the physical conditions of the environment of
      growing plants or animal organisms
    An     applied   science     which   deals   with   the
      relationship between weather/climatic conditions
      and agricultural production

                              3
 A science concerned with the application of
      meteorology to the measurement and analysis of
      the physical environment in agricultural systems.
      The word ‘Agro meteorology’ is the abbreviated
      form of agricultural meteorology
    To study the interaction between meteorological
      and hydrological factors on the one hand and
      agriculture    in   the       widest   sense,   including
      horticulture, animal husbandry and forestry on
      the other (WMO, Geneva)
Importance to crop production
1. Helps in planning the cropping patterns/systems
2. Selection of sowing dates for optimum crop yields
3. Cost effective ploughing, harrowing, weeding etc
4. Reducing losses of applied chemicals and fertilizers
5. Judicious irrigation to crops
6. Efficient harvesting of all crops
7. Reducing or eliminating outbreak of pests and
   diseases
8. Efficient management of soils which are formed out of
   weather action
9. Managing weather abnormalities like cyclones, heavy
   rainfall, floods, drought etc. This can be achieved by

                                4
(a) Protection: When rain is forecast avoid irrigation. But,
   when frost is forecast apply irrigation
(b) Avoidance: Avoid fertilizer and chemical sprays when
   rain is forecast
(c) Mitigation: Use shelter belts against cold and heat
   waves
10.Effective environmental protection
11.Avoiding or minimizing losses due to forest fires.
     Future scope of agricultural meteorology
1. To study climatic resources of a given area for
   effective crop planning.
2. To evolve weather based effective farm operations
3. To study crop weather relationships for all important
   crops and forecast crop yields based on agro climatic
   and spectral indices using remote sensing
4. To study the relationship between weather factors
   and incidence of pests and diseases of various crops
5. To delineate climatic/agro ecological/agro climatic
   zones for defining agro climatic analogues so as to
   make effective and fast transfer of technology for
   improving crop yields
6. To prepare crop weather diagrams and crop weather
   calendars

                              5
7. To    develop    crop   growth   simulation    models    for
   assessing/obtaining potential yields in different agro
   climatic zones
8. To monitor agricultural droughts on crop-wise for
   effective drought management
9. To develop weather based agro advisories to sustain
   crop production utilizing various types of weather
   forecast and seasonal climate forecast
10.To investigate microclimatic aspects of crop canopy in
   order to modify them for increased crop growth
11.To study the influence of weather on soil environment
   on which the crop is grown
12.To investigate the influence of weather in protected
   environment (eg. Glass houses) for improving their
   design aiming at increasing crop production.
Divisions of Meteorology
   Sl.     Division                 Application
  No.       name
  1.     Dynamic           Deals with the forces that
         meteorology       create and maintain motion
                           and the latest transformations
                           associated therewith
  2.     Physical          Deals with physical nature
         meteorology       such     as   radiation, heat,
                           evaporation, condensation and
                           precipitation
                                6
3.    Climatology    Study of weather patterns over
                       time and space
  4.    Synoptic       Deals with analysis and
        meteorology    forecasting of the weather
                       phenomena
  5.    Aeronautical   Application of meteorology to
        meteorology    the problem of aviation
  6.    Maritime       Deals with marine navigation
        meteorology
  7.    Agricultural   Application of meteorology in
        meteorology    relation to crop production
  8.    Hydrometeor    Deals with meteorological
        ology          problems related to water
                       supply, flood control, irrigation
                       etc.
  9.  Medical          Influence of weather and
      meteorology      climate on the human body
  10. Aerology         Deals with the conditions of the
                       free atmosphere on the basis of
                       direct observations

Coordinates of India and Tamil nadu
Coordinates of India
Lies between      8º N and           37º N latitude
                  68ºE and           97º E longitude
Coordinates of Tamil Nadu
Lies between      08º 05’ N and      13º 35’ N latitude
                  76º 15’ E and      80º 20’ E longitude
The Earth is elliptical in shape and has three spheres
       Hydrosphere      - the water portion
                             7
Lithosphere           - the solid portion
      Atmosphere            - the gaseous portion
Atmosphere
      The word atmosphere derives from the Greek word
“Atmos” which means vapour and “Sphaira” which
means sphere (layers).The atmosphere is defined as the
colourless, odourless and tasteless physical mixture of
gases which surrounds the earth on all sides. It is
mobile, compressible and expandable. It contains huge
number of solid and liquid particles called aerosol.
Atmosphere is a huge envelope of mixture of gases
extending several hundreds of kilometers from earth
surface.   Some     gases    are    permanent     atmospheric
constituents in fixed proportions to the total gas volume
and others vary from place to place and time to time.
Uses of atmosphere
1. Provides oxygen which is useful for respiration in
   crops
2. Provides carbon-dioxide to build biomass in
   photosynthesis
3. Provides nitrogen which is essential for plant growth
4. Acts as a medium for transportation of pollen
5. Protects crops plants on earth from harmful UV rays

                                8
6. Maintains warmth to plant life and
7. Provides rain to field crops as it is a source of water
   vapour, cloud, etc.
Composition of atmosphere (Fig.1)
The following all the different gases that are present in
percentage by volume approximately.
Nitrogen (N2) = 78.08 Oxygen (O2) = 20.95
Argon (Ar)    = 0.93    Carbon di oxideCO2       = 0.03
Neon (Ne) = 0.0018 Helium(He) = 0.0005
Ozone(O3) = 0.00004 Hydrogen(H2) = 0.00006
Methane (CH4)     = 0.00017


                           Fig.1


                             9
Fig.2 Vertical Layers of atmosphere based on
           temperature/Stratification (Fig.2)
      On the basis of vertical temperature variation the
atmosphere is divided into different spheres or layers.
   A) Troposphere
1. The troposphere is the atmospheric layer closest to
   the planet and contains the largest percentage
   (around 80%) of the mass of the total atmosphere.
2. The word “Tropo” means mixing or turbulence and
   “sphere” means region.
3. The troposphere is approximately 12 kilometers thick,
   but there are slight variations. The average height of
   this lower most layer of the atmosphere is about 14
   km above the mean sea level; at the equator it is 16
   km and 7-8 km at the poles.
4. All weather phenomenon that we are primarily
   interested    like    various    types    of    clouds,
                            10
thunderstorms, cyclone and anticyclones occurs in
     the troposphere because of the concentration of
     almost all the water vapour and aerosols in it. So,
     this layer is called as “seat of weather phenomena”.
5. The wind velocities increase with height and attain
     the maximum at the top of this layer.
7. Another important feature of the troposphere is that
     as height increases, temperature          decreases. The
     temperature drops about 6.5 ºC for every kilometer
     above the earth's surface (Lapse rate).
8. Most of the radiation received from the sun is
     absorbed by the earth’s
     surface. So, the troposphere is heated from below.
9.   In this layer, about 75 per cent of total gases and
     most of the
     moisture and dust particles present.
10. The top of the troposphere there is a shallow layer
     separating it from
     stratosphere which is known as the “Tropopause “.
11. The upper boundary of the layer Tropopause, ranges
     in height from       5 miles (8 km) near the poles up to
     11 miles (18 km) above the equator. Its height also


                               11
varies with the seasons; highest in the summer and
    lowest in the winter.


B). Stratosphere
1. The stratosphere is the second major strata of air in
   the atmosphere. It extends above the tropopause
   (around 20 km onwards) and extends to an altitude of
   about 30 miles (50 km) above the planet's surface.
2. The air temperature in the stratosphere remains
   relatively constant up to an altitude of 15 miles (25
   km). Then it increases gradually with height until it
   reaches about 10°C at an altitude of 50 km.
3. Solar energy is converted to kinetic energy when ozone
   molecules absorb ultraviolet radiation, resulting in
   heating of the stratosphere.
4. This   layer   is   called   as   “Seat   of   photochemical
   reactions”.
5. Since the stratosphere is not turbulent this is where
   most planes like to fly.
6. Less convection takes place in the stratosphere
   because it is warm at the top and cold at the bottom.
7. There is also persistence of circulation patterns and
   high wind speeds.

                                12
8. The boundary between the stratosphere and the next
  layer mesosphere is called the stratopause.
C). Mesosphere/Ozonosphere
1. The layer between 50 and 80 km is called as
   “Mesosphere”. In this layer the temperature decreases
   with height.
2. There is a maximum concentration of ozone between
   30 and 60 km above the surface of the earth and this
   layer is known as the ozonosphere.
3. A property of the ozone is that it absorbs UV rays.
   Had there been no layer of the ozone in the
   atmosphere, the ultraviolet rays might have reached
   the surface of the earth and no life can exist.
4. The temperature drops in this layer to about -100 ºC.
   This is the coldest region of the atmosphere.
5. The   stratosphere   and        mesosphere   together   are
   sometimes referred to as the middle atmosphere.
   Because of the preponderance of chemical process
   this sphere is called as the “chemosphere”
6. The upper boundary of this layer is called the
   “Mesopause”.


                              13
D). Thermosphere (Ionosphere)
1. The thermosphere layer lies beyond the ozonosphere
  (mesosphere) at a height of about 80 km above the
  earth’s surface and extends up to 400 km. The air is
  very thin.
2. Thermosphere means "heat sphere". The temperature
  is very high in this          layer because ultraviolet
  radiation is turned into heat. Temperatures often
  reach 2000°C or more. This increase in temperature
  is due to the absorption of intense solar radiation by
  the limited amount of remaining molecular oxygen.
3. The atmosphere in the ionosphere is partly ionised
  enriched ion zones exist in the form of distinct ionised
  layers. So, this layer is also called as the ionosphere.
  Long distance radio communication is possible due to
  this layer.
E). Exosphere
1. The outer most layer of the earth’s atmosphere is
named as the exosphere and this layer lies between 400
and 1000 km. The exosphere is the most distant
atmospheric region from Earth's surface.
2. The upper boundary can be defined theoretically by
the altitude (about 120,000 miles, half the distance to

                           14
the Moon) at which the influence of solar radiation
pressure on atomic hydrogen velocities exceeds that of
the Earth's gravitational pull.
3. At such a greater height the density of atoms in the
atmosphere is extremely low.
4. Hydrogen and Helium gases predominate in this outer
most region.
5. At an altitude of about 500 to 600 km the density of
the atmosphere becomes so low that collisions between
the natural particles become extremely rare.
Weather
      It is defined as a physical state of the atmosphere
at a given place and given time or a state or condition of
the atmosphere at a given place and at a
      The daily or short term variations of different
conditions of lower air in terms of temperature, pressure,
wind, rainfall etc. Weather is highly variable and it
changes constantly sometimes from hour to hour and at
other times from day to day.
      The different weather elements are solar radiation,
temperature,       pressure,   wind,   humidity,   rainfall,
evaporation etc.


                               15
Eg:   The     air   temperature    of   Annamalai   nagar   on
20.01.2011 at 10.30 a.m. is 31º C.
Climate
   It is defined as the generalized weather or summation
of weather      conditions over      a given region during
comparatively longer period. The sum of all statistical
information of weather in a particular area during
specified interval of time, usually a season or a year or
even a decade or long term regime of atmospheric
variables of a given place or area. The aspects involved
are larger areas like a zone/ a state/ a country and is
described as normals.             The climatic normals are
generally worked out for a period of 30 years.              The
climatic elements are latitude, longitude and altitude.
Eg: In Tamil Nadu the summer temperature ranges from
29ºC to 40º C.
Factors affecting climate
      There are number of factors that affect the climate
of a particular place in the World. They are,
i) Latitude
      Latitude controls the amount of solar radiation
that reaches the surface of the earth. The distance from
the equator, either south or north, largely creates

                              16
variations in the climate. Based on the latitude, the
climate has been classified as
      i) Tropical          ii) Sub-tropical           iii)
Temperate                  iv) Polar
       The tropical climate is characterized by high
temperature       throughout    the    year.   Subtropical     is
characterized by high temperature alternating with low
temperature in winter.      The temperate climate has low
temperature throughout the year.         The polar climate is
noted for its very low temperature throughout the year.
In general the latitude incease the temperature decrease.
ii) Altitude (elevation)
       The height from the MSL (Mean Sea Level) creates
variation in climate. Even in the tropical regions, the
high mountains have temperate climate. The temperature
decreases by 6.5 ºC/km from the sea level. Generally,
there is also a decrease in pressure and increase in
precipitation and wind velocity. The above factors alter
the   kind   of   vegetation,   soil   types   and   the     crop
production. With increasing altitude the decreasing
temperature.
iii) Precipitation


                                17
The quantity and distribution of rainfall decides
the nature of vegetation and the nature of the cultivated
crops.
iv) Mountain barriers or Relief:
         Mountains form a natural barrier that causes air
masses to rise. As air is forced to rise it expands as
gravity decreases, it becomes less dense and cools.
v) Soil type
          Soil is a product of climatic action on rocks as
modified by landscape and vegetation over a long period
of time. The colour of the soil surface affects the
absorption, storage and re-radiation of heat. White colour
reflects while black absorbs more radiation. Hence,
where ever black soil type is predominant there will be
more absorption of heat and hot climate will exist.
vi) Nearness to large water bodies
         The presence of large water bodies like lakes and
sea including its current affect the climate of the
surrounding areas, Eg. Islands and coastal areas. The
movement of air from earth’s surface and from water
bodies to earth modifies the climate. The extreme
variation in temperature during summer and winter is
minimized in coastal areas and island.

                              18
vii) Topography
          The surface of landscape (leveled or uneven
surface areas) produces marked change in the climate.
This involves the altitude of the place, steepness of the
slope and exposure of the slope to light and wind.
viii) Vegetation
          Kinds of vegetation characterize the nature of
climate. Thick vegetation is found in tropical regions
where temperature and precipitation are high.
Others factors are
      Wind and air masses, atmospheric disturbances or
storms and oceans currents.
Scales of climate and their importance
i) Microclimate
          Microclimate deals with the climatic features
peculiar to small areas and with the physical processes
that take place in the layer of air very near to the ground
which differ sharply from general climatic conditions.
ii) Mesoclimate
       The scale of meso climate falls between micro and
macro climates. It is concerned with the study of climate
over relatively smaller areas between 10 & 100 km
across.

                            19
iii) Macroclimate
         Macro climate deals with the study of atmosphere
over large areas of the earth and with the large scale
atmospheric motions that cause weather. The scales of
air motion in different climates are given in the Table
below.
  Type            of Horizontal          Vertical       Time
  climate            scale (km)          scale(km)      Scale
                                                        (hrs)
  A.       Macro
  climate
  1.                 2000-5000&          10             200       to
  Planetary          more                               400
  scale
  2. Synoptic 500-2000                   10             100
  scale
  B.    Meso 1 to 100                    1-10           1-10
  climate
  C.    Micro <100m                      200 m          6-12
  climate                                               minutes

If any weather system develops under different types of
climate,     it     persists     longer       periods    under     the
macroclimate         while     smaller     periods      under    micro
climates.

                                   20
Climates      of     India   and       Tamilnadu       and    their
characterization
              Climate classification was tried by many
scientists from beginning of 19th century using many
parameters.        Thornthwaite    during     1931      and   1948
classified the climate using precipitation and evaporation
/Potential evaporation and was subsequently modified by
Mathur (1955) for the Moisture Index (Im) and is given
below
        Im = 100 [(P-PE)/PE]
              Where P = Precipitation, PE          =     Potential
evapo-transpiration
        Using the moisture Index (Im) the following
classification was made
              Im Quantity                   Climate
classification
              100 and above                 Per humid
              20 to 100                   Humid
              0 to 20                       Moist sub humid
              -33.3 to 0                  Dry sub humid
              -66.7 to -33.3                Semi arid
              -100 to -66.7                 Arid


                                  21
Another classification by Troll (1965) based
on number of humid months, said to be of more
agricultural use was modified by ICRISAT for India.
Humid month is one having mean rainfall exceeding the
mean Potential evapo transpiration.
  Climate      Number      of %      geographical
               humid months   area of India
  Arid              <2.0             17.00
  Semiarid-        2.0-4.5           57.17
  dry
  Semiarid-     4.5-7.0             12.31
  wet
  Humid          >7.0               1.10
     The ICAR under All India Coordinated Research
Project on Dryland Agriculture adopted classification
based Moisture Deficit Index (MDI)
             P - PET
     MDI = --------- x 100
              PET
Where P is annual precipitation (cm) and PET is Potential
Evapotranspiration. Based on MDI the climate is divided
into three regions as below.
  Type of climate                          MDI
  Subhumid                             0.0 to 33.3
  Semiarid                            -33.3 to -66.6
  Arid                                   > -66.6

Koppen classification of climate

                               22
Koppen classified climate into eleven types. They
are as follows:
Sl.N       Name            Sl.N         Name
 o.                         o.
1.   Tropical rainforest   7.   Humid temperate
     climate                    climate
2.   Tropical –Savanna     8.   Cold climate with
     Climate                    moist winter
3.   Steppes               9.   Cold Climate with
                                Dry Winter
4.     Deserts             10. Tundra Climate
5.     Warm climate        11. Ice climate
       with dry winter
6.     Warm Climate
       with dry summer

Rainfall based classification
       The crop regions are classified on the basis of
average rainfall which is as follow.


     Rainfall(mm)             Name     of   the   climatic
                              region
     Less than 500            Arid
     500-750                  Semi-arid
     750-1000                 Sub-arid
     More than 1000           Humid

Temperature based classification


                             23
The     tropic    of
cancer,          which         passes
through the middle of the
country, divides it into two
distinct         climates.        The
tropical climate in the South
where all the 12 months of
the year have mean daily
temperature               exceeding
20°C;      and    in     the   North
where a sub-tropical climate prevails. In sub-tropics
during the winter months, it is cool to cold. Frosts occur
sometime during the months of December and January.
Some areas in the Northern India have a temperate
climate. Here it snows during the winter months and
freezing temperatures may extend to two months or more
during the year. Three main climatic zones of India based
on temperature are shown in the map below.


                                             Chapter 2
        Solar Radiation and Temperature

                                    24
THE SUN
            Sun is an ordinary star, nearest to our
Earth. The planets and satellites are called the members
of the solar system. Sun is the star at the center of the
Solar System. All the planets revolve around the Sun in
elliptical orbits. Sun is the prime source of energy on
Earth and life depends on.
The main features of the Sun
1. Diameter of the Sun is 13,92,000 km and its mass
  about 2 X 1030 kg
   (3,30,000 times that of Earth)
2. It rotates on its axis about once in every four weeks
(27 days near equator     & 30 days –polar)
3. The mean distance of the Sun from the Earth is
approximately 149.6 million km
4. Sun is the brightest object in the sky
5. Light travels from the Sun to Earth in about 8 minutes
and 19 seconds
6. The surface temperature of the Sun is around 5778°K
(5505 °C)
7. The interior mass of the Sun has a density of 80 to
100 times that of water


                             25
8. Every minute, the Sun radiates approximately 56 X
1026 calories of energy
9. Energy is due to the fusion, Hydrogen is transformed
to Helium
10. 99% of the energy to biosphere is only from the Sun
and the rest one
per cent is from stars, lightning discharge. Sun’s
radiation reflected from the Moon, re-radiation from the
Earth etc.,


SEASONAL VARIATIONS
      The primary cause of seasonal extremes on Earth
is the 23.5 degree tilt of our planet's spin axis. When the
north pole is tilted toward the Sun, northern days are
long and the weather is warm. Six months later, as the
south pole tilts toward the Sun, the southern hemisphere
takes its turn at summer.

                            26
Seasons in the two hemispheres are always
reversed. When it is summer in New York, it is winter in
Sydney. On a spring day in Paris, autumn leaves are
falling in Argentina.
      The name "equinox" is derived from the Latin
aequus (equal) and nox (night). The name “solstice” is
derived from the Latin sol (sun) and sistere (to stand still)
      EQUINOX - when the Sun shines down directly
over a planet's equator. Two times of the year when night
and day are about the same length.
      SOLSTICE - when one of the poles is tilted toward
the Sun to its maximum extent. The Sun stands still in
declination; that is, the apparent movement of the Sun's
path north or south comes to a stop before reversing
direction.
      Summer Solstice: The Sun is farthest north and
the length of time between Sunrise and Sunset is the
longest of the year.
      Winter Solstice: The Sun is farthest south and the
length of time between Sunrise and Sunset is the
shortest of the year.
      An equinox happens each year at two specific
moments in time, where the center of the Sun can be

                             27
observed to be vertically overhead, occurring around
March 21 and September 23 each year.
      A solstice is an astronomical event that happens
twice each year when the Sun's apparent position in the
sky reaches its northernmost or southernmost extremes.
From the vernal equinox (March 21), the Earth is moving
northward around the Sun towards the summer solstice
(June 21), when the Sun is farthest North. The autumnal
equinox (September 23), the Earth moving southward
towards winter solstice (December 21), the Sun reaches
its lowest position in the sky (South).
      If you live in the Southern Hemisphere, the
summer solstice and winter solstice will be reversed.
INSOLATION
      Insolation   means     Incoming     solar   radiation.
Electromagnetic energy radiated into the space by the
Sun. It consists of bands of radiant energy of different
wave lengths.
Factors affecting insolation
1. The solar constant which depends on
   a. Energy output of the Sun
   b. Distance from earth to Sun
2. Transparency of the atmosphere

                             28
3. Duration of daily sunlight period
4. Angle at which Sun’s noon rays strike the Earth.
SOLAR CONSTANT
       Solar constant is the energy received on a unit area
at the outer most boundary of the Earth (atmosphere)
surface held perpendicular to the Sun’s direction, at the
mean distance between the Sun and the Earth.
       The rate at which solar wave radiation is received at
the top of the atmosphere on a unit surface unit time.
   •    Solar constant is not a true constant. It fluctuates
        by as much as ± 3% about its mean value
        depending upon the distance of the Earth from the
        Sun.
   •    Value is about 2 cal / cm2 / min. (1.92 and 2.02) of
        the upper atmosphere (cal/cm2= Langley). It is
        equal to 1370 watts per square meter
   •    35% of the energy is contributed by U.V. and
        visible parts and 65% by Infra Red
TRANSFER OF HEAT
               All matter, at a temperature above the
absolute zero, imparts energy to the surrounding space.
Three     processes   viz.   conduction,     convection   and
radiation are involved in heat flow or heat transfer.

                              29
1. Conduction
             Heat transfer through the matter without the
actual movement of molecules of the substances or
matter. Heat flows from the warmer to cooler part of the
body so that the temperatures between them are
equalized.
Eg. The energy transmission through an iron rod which
is made warmer at one end.
2. Convection
             Processes of transmission of heat through
actual movement of molecules of the medium. This is
predominant form of energy transmission on the earth as
all the weather related processes involve this process.
Eg. Boiling of water in a vessel.
3. Radiation
             Transfer of energy from one body to another
without the aid of the material medium (solid, liquid or
gas). Radiation is not a heat, only when radiation is
absorbed by surface of a body heat is produced.
Eg. The energy transmission through space from the Sun
to the Earth.


                             30
SOLAR RADIATION
         The flux of radiant energy from the Sun is solar
radiation.
                 Heavenly bodies emit – short wave radiation
                 Near surfaces including earth emit - long
wave radiation
Importance of Solar Radiation on Crops
1. From germination of seeds to harvesting and even post
harvest processes are affected by solar radiation
2. Solar radiation provides energy for
     •   All the phenomena related to biomass production
     •   All photosynthetic processes
     •   All physical processes taking place in the soil, the
         plant and their environment
3.       Solar   radiation   controls   the   distribution   of
temperature thereby distribution of crops into different
regions.
Radiation flux
                 The   amount of radiant      energy   emitted,
received, transmitted across a particular area is known
as radiant flux.
Radiant flux density


                                31
The radiant flux divided by the area across
which the radiation is transmitted is called radiant flux
density.
Emissive power
                The radiant flux density emitted by a source
is called its emissive power.
Energy measurement
           Units          Cal cm-2        J cm-2 mi-1           W cm-2
                            min-1
     Cal        cm-2         1                  4.1868          0.069
   min-1
   J cm-2 mi-1             0.238                  1            0.00165
   W cm-2                  14.3                  60.6             1
Where,
      J – Joule;         W – Watt.
SOLAR SPECTRUM
                Radiation energy is transmitted in the form
of electromagnetic waves by the Sun. The energy from
the Sun is spread over a very broad band of wavelengths
known      as    solar    spectrum.        It    is     also   known     as
electromagnetic          spectrum.        The     spectrum       is    the
combination of different wavelengths.
Eg. U.V. rays, visible light, I.R.rays etc.


                                     32
Different Bands in Solar Spectrum
                      Wavele                               % of
             Spectr
   Band                ngth             Importance         Ener
              um
                        (µ)                                 gy
  1.Ultra Cosmic                      Shorter      wave
                      < 0.005
  violet  rays                        lengths         of
          Gamma                       spectrum        &
          rays        0.005 –         Chemically
          and X-      0.20            active,    unless    9%
          rays                        filtered there is
          Ultra                       danger of life on
                      0.20 –
          Violet                      earth
                      0.39
          rays
                      0.39   –        Visible spectrum
            Violet
                      0.42            known as Light
                      0.42   –        essential for all
            Blue
                      0.49            plant processes
                      0.49   –
            Green
  2.Visib             0.54
                                                           41%
  le                  0.54   –
            Yellow
                      0.59
                      0.59   –
            Orange
                      0.65
                      0.65   –
            Red
                      0.76
                                      Essential      for
  3.Infra Infrared                    thermal energy
                   > 0.76                                50%
  red     rays                        of   the    plant
                                      (Source of heat)

Units of measurements of wavelength


                                 33
Micron (µ)          =        10-6 m         =
       10-4 cm
       Milli micron (mµ)   =        10-9 m    =    10-7 cm
       Angstrom (Å)        =        10-10 m                  =
       10-8 cm
Solar radiation and crop plants
       Crop production is exploitation of solar radiation;
the three broad spectrums are,
1. Shorter than visible range: Chemically very active
   •   When plants are exposed to this radiation the
       effects are detrimental
   •   Atmosphere acts as regulator for this radiation and
       none of cosmic, Gamma and X-rays reaches to the
       earth
   •   The UV rays of this segment reaching to the earth
       are very low and it is normally tolerated by the
       plants
2. Visible spectrum: Light
   •   Between UV & IR radiation and also referred as
       light
   •   All plant parts are directly or indirectly influenced
       by the light


                               34
•   Intensity, quality and duration are important for
         normal plant growth
     •   Poor light leads to plant abnormalities
     •   Light is indispensable to photosynthesis
     •   Light affect the production of tillers, the stability,
         strength and length of culms
     •   It affects the yield, total weight of plant structures,
         size of the leaves and root development
     •   It affects the flowering and fruiting and dormancy
         of the seed
3. Higher than visible wavelength: Source of heat
     •   Referred to IR radiation
     •   It has thermal effect on plants
     •   In the presence of water vapour, this radiation
         does not harm plants, rather it supplies the
         necessary thermal energy to the plant environment
           Effect of solar radiation on crop plants
S.N      Band                  Specific effect on plant
o.       Wavelengt
         h (µ)
                       No specific effect on plant
         Radiation     activity such as bio-chemical
1.       within 1.0    and photochemical processes.
         and more      Radiations are transformed into
                       heat
2.       1.0 - 0.72    Radiation in this band helps in
                                35
plant elongation activity
                  This light is strongly absorbed by
      0.72 –      chlorophylls. It generates strong
 3.
      0.61        photosynthetic      and      photo-
                  periodic activity
                  Absorption in this region has low
      0.61 –
 4.               photosynthetic effectiveness and
      0.51
                  weak formative activity
                  It is the strongest chlorophyll
                  and yellow pigment absorption
      0.51 –
 5.               region.     Very      strong    on
      0.40
                  photosynthetic activity and effect
                  on formation of tissues
                  Produces formative effects. It has
      0.40 –
 6.               dwarfing effect on plants and
      0.32
                  thickening effect on plant leaf
      0.32 –      Detrimental effect on most
 7.
      0.28        plants
                  Lethal effects most of the plants
      Less than
 8.               get killed UV ranges have
      0.28
                  germicidal action
Absorption, Reflection and Transmission
            A part of the incident radiation on the
surface is absorbed, while a part is reflected and the
remaining is transmitted.
Absorptivity
            Absorptivity of a substance is defined as the
ratio of the amount of radiant energy absorbed to the
total   amount   incident   upon   that   substance.    The


                            36
absorptivity of a blackbody is unity. Natural bodies like
Sun and Earth are near perfect black bodies.
Reflectivity
               Reflectivity is defined as the ratio of the
radiant energy reflected to the total incident radiation
upon that surface. If it is expressed in percentage it
becomes albedo.
Transmittivity
               Transmittivity is defined as ratio of the
transmitted radiation to the total incident radiation upon
the surface.
Emissivity
               Emissivity is defined as the ratio of the
radiant energy emitted by a given surface to the total
heat energy emitted by a black body. The emissivity of a
black body is unity.
Blackbody radiation
               A Blackbody is defined as a body, which
completely absorbs all the heat radiations falling on it
without reflecting and transmitting any of it. It means
reflectivity and transmittivity become zero. When such a
black body is heated it emits radiation of all wavelengths
depending upon its temperature.

                             37
ALBEDO
            It is the percentage of reflected radiation to
the   incident   radiation    (varies   with   colour    and
composition of the Earth’s surface, season, angle of the
Sun rays). Value is Highest in winter and at Sunrise and
Sunset. Pure water 5-20%, Vegetation 10-40%, dark soils
5-10%, desert soil 25-30%, snow 45-90% and clouds
5-85%. High albedo indicates that much of the incident
solar radiation is reflected rather than absorbed.
Depends up on
   1. Angle of incidence of radiation. Albedo increase
      with decreasing elevation of sun with minimum
      during noon
   2. Physical characteristics of surface
   3. Season
   4. Time of the day
For plant community albedo depends upon
   1. Age of the crop
   2. Percentage of ground cover
   3. Colour and reflectivity of the foliage
Radiation balance
            The difference between all incoming and
outgoing radiation at the earth’s surface and top of the

                             38
atmosphere is known as radiation balance at the earth’s
surface.
Temperature
             It is defined as the measure of the average
speed of atoms and molecules
Kinetic energy
             Energy of motion.
Heat
       It is the aggregate internal energy of motion and
molecules of a body. It is often defined as energy in the
process of being transferred from one object to another
because of the temperature between them.


Sensible heat
       It is the heat that can be measured by a
thermometer and thus sensed by humans. Normally
measured in Celsius, Fahrenheit and Kelvin.
Latent heat
       It is the energy required to change a substance to a
higher state of matter. This same energy is released on
the reverse process. Change of state through Evaporation
and condensation is known as latent heat of evaporation
and latent heat of condensation. From water to water

                             39
vapour takes 600 calories and water to ice takes 80
calories.
Disposition of Solar radiation
     •   25% of solar radiation is reflected back to the
         space by clouds (more by middle and high latitudes
         and less in the sub tropics)
     •   6% reflected back by air, dust and water vapour.
     •   30% scatted downwards (more in the form of
         shorter wavelengths than that in longer wave
         length (red)).
     •   17%    of   solar   radiation   is   absorbed   by   the
         atmosphere. (Mostly by Oxygen, O3, CO2 & H2O
         vapour).
         O2    – absorb the extreme UV wavelengths (0.12
to 0.6 µ)
         O3    – UV (0.2 to 0.32 µ) and Visible part of
radiation (0.44 to 0.7 µ)
         H2O vapour          – Near infra red (0.93, 1.13, 1.42
µ)
         CO2          - IR band 2.7 µ.
•    About 50% of solar radiation reaches earth’s surface,
     after reflection, scattering and absorption.
LIGHT

                                 40
Light is the visible portion of the solar spectrum
with wavelength range is from 0.39 to 0.76μ. Light is one
of the important climatic factors for many vital functions
of the plant.
Functions of Light
   •   It is essential for the synthesis of the most
       important pigment ie. Chlorophyll, Chlorophyll
       absorbs the radiant energy and converts it into
       potential energy of carbohydrate (photosynthesis).
   •   The carbohydrate thus formed is the connecting
       link between solar energy and living world.
   •   In addition, it regulates the important physiological
       functions.
   -   Effects tiller production, stability, strength and
       length of culms
   -   Effects dry matter production
   -   Effects the size of the leaves and root development
   -   Effects the flowering, fruiting and dormancy of the
       seed
Characteristics of Light
       The characteristics of light viz. intensity, quality,
duration and direction are important for crops.
1. Light intensity

                             41
The intensity of light is measured by comparing
with a standard candle. The amount of light received at a
distance of one meter from a standard candle is known
as “Meter candle or Lux”. The light intensity at one foot
from a standard candle is called “foot candle” or 10.764
luxes.
     -   Very low light intensity reduces the rate of
         photosynthesis resulting in reduced growth.
     -   Similarly, very high intensity is detrimental to
         plant in many ways as below.
     -   It increases the rate of respiration.
     -   It also causes rapid loss of water (i.e.) increases
         the transpiration rate of water from the plants.
     -   The most harmful effect of high intensity light is
         that it oxidises the cell contents which is termed
         as ‘Solarisation’. This oxidation is different from
         respiration and is called as photo-oxidation.
•   Under field conditions the light is not spread evenly
    over the crop canopy but commonly passed by
    reflection and transmission through several layers of
    leaves.
•   The intensity of light falls at exponential rate with path
    length through absorbing layers according to Beer’s

                               42
law. i.e. the relative radiation intensity decreases
       exponentially with increasing leaf area.
•      At ground level the light intensity is below the light
       compensation point (The light intensity at which the
       gas exchange resulting from photosynthesis is equal to
       that resulting from respiration)
          Based on the response to light intensities the
plants are classified as follows.
(i)       Sciophytes (shade loving plants)
            The plants grow better under partially shaded
          conditions. Eg. Betel vine, buck wheat etc.
(ii)      Hetrophytes (Sun loving)
            Many species of plants produce maximum dry
          matter under high light intensities when the
          moisture    is   available   at   the   optimum   level.
          Eg. Maize, sorghum, rice etc.
2. Quality of Light
          When a beam of white light is passed through a
prism, it is dispersed into wavelengths of different
colours. This is called the visible part of the solar
spectrum (VIBGYOR 0.39 – 0.76 µ).


                                  43
•    The principal wavelength absorbed and used in
         photosynthesis are in the violet – blue and the orange
         - red regions.
    •    Among this, short rays beyond violet such as X rays,
         gamma rays and larger rays beyond red such as
         infrared, are detrimental to plant growth.
    •    Red light is the most favourable light for growth
         followed by violet – blue.
    •    Red light helps mature apples to turn red, induces
         germination and suppresses elongation of stem.
    •    Blue and green lights inhibit germination of seeds.
    •    Ultra – violet and shorter wave lengths kill bacteria
         and many fungi (Germicidal effect).
3. Duration of light:
•       The duration of light has greater influence than the
        intensity for canopy development and final yield.
•       It has a considerable importance in the selection of
        crop varieties.
•       The response of plants to the relative length of the day
        and night is known as “photoperiodism”.
The plants are classified based on the extent of response
to day length which is as follows.
(i) Long day plants

                                      44
The plants which develop and produce normally
when the        photoperiod is greater than the critical
minimum (more than 10 hours). Eg. Potato, Sugar beet,
Wheat, Barley, Oats etc.
(ii) Short day plants
        The plants which develop normally when the
photoperiod is less than the critical maximum (less than
10 hours). Eg. Rice, Sorghum, Cotton, Sunflower,
Cucumber etc.
(iii) Day neutral plants / Indeterminate
    Those plants which are not affected by photoperiod.
Eg. Tomato, Maize etc.
•   The photoperiodism influences the plant character
    such as floral initiation or development, bulb and
    rhizome production etc.
•   In long day plant, during periods of short days, the
    growth of internodes are shortened and flowering is
    delayed till the long days come in the season. Similarly
    when short day plants are subjected to long day
    periods
•   The varying photoperiodicity of plants is a very
    important factor in crop rotation which helps not only


                              45
in operational nutrient management but also in
    disease eradication.
•   The   choice   of   varieties    and   cultivars   in   newly
    cultivated areas depend on duration of light.
4. Direction of light
•   The direction of sunlight has a greater effect on the
    orientation of roots and leaves.
•   In temperate regions, the southern slopes plants
    produce better growth than the northern slopes due to
    higher contribution of sunlight in the southern side.
•   The change of position or orientation of organs of
    plants   caused     by   light    is   usually     called   as
    “phototropism” i.e. the leaves are oriented at right
    angles to incidence of light to receive maximum light
    radiation.
Photomorphogenesis
          Change in the morphology of plants due to light.
This is mainly due to U.V and violet ray of the Sun.
Factors Affecting the Distribution of Solar Radiation
within the Plant Canopy
1. Type of Plants
a. The leaves of cereal crops like paddy, wheat etc. have a
transmissivity from 5 to 10 per cent.

                               46
b. The broad leaves of ever green plants have lower value
of 2 to 8 per cent.
2. Age of the Leaves
The transmissivity of younger leaves is more as compared
to older leaves.
3. Chlorophyll Content
As the chlorophyll content increases the value of
transmissivity decreases.
4. Arrangement of Leaves
a. The relative light interception by horizontal and erect
foliage is 1:0.44
b. When the leaf area index is one (1) the light
transmissivity of more upright leaves is 74 % as against
50 % for horizontal leaves.
5. Angle of Leaves
a. In full sunlight, the optimum inclination for efficient
light use is 81°. The leaf placed at the optimum
inclination is 4 – 5 times as efficient in using light as a
horizontal leaf.
c. The ideal arrangement of leaves is that the lowest
leaves lay at angles between 0° to 30° to be horizontal (13
% ), the adjoining leaves lay at 30° to 60° (37 % ) and the
upper leaves lay at 60° to 90°(50 % ).

                              47
6. Plant Density
       In sparse crop stands not only the per cent of light
transmissivity is more but it is also variable with the time
of   the   day.    In       dense     crop    canopies    the   light
transmissivity is less.
7. Plant Height
       When the plant height increases the transmissivity
of light by the canopy decreases.
8. Angle of the sun
a. The highest radiation penetration also occurs at noon.
b. Relatively high radiation penetration also occurs both
in the morning as well as before the sunset due to high
proportion of diffuse light.
Instruments to measure Solar Radiation
1.   Pyranometer:            Total    short    wave    radiation   or
components        on    a    horizontal       plain   surface   from
hemispherical sky.
2. Net pyranometer or solarimeter: Net short wave
radiation in W m-2.
3. Pyrradiometer: Global or total radiation from sky on
a horizontal surface in W m-2.
4. Net pyrradiometer or net radiometer: Net short
wave and long wave radiation in W m-2.

                                     48
5. Pyrheliometer: Direct solar beam on a plane surface
at normal incidence in W m-2.
6.   Pyrgeometer:      Net    infrared   radiation      of   the
atmosphere in W m-2.
7. Luxmeter or Photometric sensors: The brightness
(intensity) is measured in foot candles or lux.
8. Photometer or light meter: Measured the light.
9. Sunshine shine recorder: The number of hours of
bright sunshine is recorded.
AIR TEMPERATURE
             Temperature is defined as, “The measure of
speed per molecule of all the molecules of a body”.
Whereas heat is, “the energy arising from random motion
of all the molecules of a body” (Degree of molecular
activity). It is the intensity aspect of heat energy.
      Temperature is a measure of “the average energy of
the molecules of a body”, whereas heat is a measure of
“the total amount of thermal energy in a body”. For
example, the temperature of a cup of boiling water is the
same as that of a large pot of boiling water (212°F, or
100°C), the large pot has more heat, or thermal energy,
and it takes more energy to boil a pot of water than a cup
of water.

                              49
In meteorology, the temperature of the atmosphere
which represents the average kinetic energy of the
molecular motion in a small region and is defined in
terms of a standard or calibrated thermometer in thermal
equilibrium with the air.
   •   The degree of hotness or coldness of a body or
       environment.
HEAT TRANSFER
Conduction
        Heat transfer when two bodies of unequal
temperatures come into contact. Heat passes from point
to point by means of adjacent molecules.
Convection
        Transfer through movement of particles (part of
mass) in fluids and gasses. These are able to circulate
internally and distribute heated part of the mass.
Radiation
       It is the process of transmission of energy by
electromagnetic waves between two bodies without the
necessary aid of an intervening material medium.
Role of temperature in crop production:
1. Temperature influences distribution of crop plants
   and vegetation.

                            50
2. The surface air temperature is one of the important
   variables, which influences all stages of crop during
   its growth development and reproductive phase.
3. Air temperature affects leaf production, expansion
   and flowering.
4. The diffusion rates of gases and liquid changes with
   temperature.
5. Solubility of different substances is dependent on
   temperature.
6. Biochemical reactions in crops (double or more with
   each 10°C rise) are influenced by air temperature.
7. Equilibrium of various systems and compounds is a
   function of temperature.
8. Temperature affects the stability of enzymatic systems
   in the plants.
9. Most of the higher plants grow between 0°C – 60°C
   and crop plants are further restricted from 10 – 40°C,
   however, maximum dry matter is produced between
   20 and 30°C
10.At high temperature and high humidity, most of the
   crop plants are affected by pests and diseases.
11.High night temperature increases respiration and
   metabolism.

                              51
12. Most of the crops have upper and lower limits of
   temperature below or above which, they may not
   come up and an optimum temperature when the crop
   growth is maximum. These are known as “cardinal
   temperatures” and different crops have different
   temperatures.
  Sl   Crop         Minimum Optimum        Maximum
  No
  1    Wheat and      0–5        25 – 31   31 – 37
       Barley
  2    Sorghum      15 – 18      31 – 36   40 – 42

Factors affecting air temperature
        Latitude
        Altitude
        Distribution of land and water
        Ocean currents
        Prevailing winds
        Cloudiness
        Mountain barriers
        Nature of surface
        Relief
        Convection and turbulence etc.
1. Latitude


                            52
The time of occurrence of maximum monthly
mean    temperature     and    minimum     monthly    mean
temperature also depends on latitude of a place. (Eg.) The
coldest month is January in northern regions of India
while December in the south. Similarly, the warmest
month is May in the south while June in the north
across the country.
2. Altitude
              The surface air temperature decreases with
increasing altitude from the mean sea level as the density
of air decreases. Since the density of air is less at higher
altitudes, the absorbing capacity of air is relatively less
with reference to earth’s long wave radiation.
3. Distribution of land and water
              Land and water surfaces react differently to
the insolation. Because of the great contrasts between
land and water surfaces their capacity for heating the
atmosphere varies. The differential heating process
between land and sea surfaces are due to their
properties. It is one of the reasons for Indian monsoon.
4. Ocean currents
              The energy received over the ocean surface
carried away by the ocean currents from the warm areas

                              53
to cool areas. This results in temperature contrast
between the equator and poles. The occurrence of El-
Nino is due to change in sea surface temperature
between two oceanic regions over the globe.
5. Prevailing winds
            Winds can moderate the surface temperature
of the continents and oceans. In the absence of winds, we
feel warm in hot climates. At the same time, the weather
is pleasant if wind blows.
6. Cloudiness
            The      amount   of   cloudiness   affects   the
temperature of the earth’s surface and the atmosphere. A
thick cloud reduces the amount of insolation received at
a particular place and thus the day time temperature is
low. At the same time, the lower layers in the atmosphere
absorb earth’s radiation. This results in increasing
atmospheric temperature during night. That is why,
cloudy nights are warmer. This is common in the humid
tropical climates.
7. Mountain barriers
            Air at the top of the mountain makes little
contact with the ground and is therefore cold while in the
valley at the foothills makes a great deal of contact and is

                              54
therefore warm. That is, the lower region of the earth’s
    atmosphere is relatively warmer when compared to
    hillocks.
    8. Nature of surface
    9. Relief
    In the northern hemisphere north facing slopes generally
    receive less insolation than south facing slopes and
    temperature are normally lower.
    10. Convection and turbulence etc.
    Diurnal and Seasonal Variation of Air Temperature
•   The minimum air temperature occurs at about sunrise,
    after which there is a constant rise till it reaches to
    maximum.
•   The maximum air temperature is recorded between
    13.00 hrs and 15.00 hrs although the maximum solar
    radiation is reaches at the noon.
•   A steady fall in temperature till sunrise is noticed after
    is attains maximum. Thus the daily displays one
    maximum and one minimum. The difference between
    the two is called the diurnal range of air temperature.
•   The diurnal range of air temperature is more on clear
    days    while   cloudy   weather    sharply   reduces   daily
    amplitudes.

                                 55
•   The diurnal range of temperature is also influenced by
    soils and their coverage in addition to seasons.
•   Addition of daily maximum and minimum temperature
    divided by two is nothing but daily mean / average
    temperature.
    Temperature Distribution
            Each day the earth receives energy in the form of
    incoming solar radiation from the sun. There are three
    temperature distributions viz., horizontal, vertical and
    periodic distributions that are observed on earth.
    1. Horizontal air temperature distribution
            Sun rays make different angles at the same place
    at different times. Due to the variation in angle of sun’s
    rays, distribution of solar heat on earth decreases both
    ways from equator to poles. This is known as horizontal
    distribution of air temperature.
            On   maps,    the   horizontal   distribution     of   air
    temperature is shown by isotherms. The isotherms are
    imaginary     lines   drawn   connecting    points   of    equal
    temperature.
          Horizontal distribution of air temperature influenced
    by,
           Latitude

                                   56
A general decrease in temperature from equator towards
poles is one of the most fundamental factors of
climatology.
    Land and water
         Irregular distribution of land and water on earth’s
surface breaks the latitudinal variation in temperature.
Land areas warm and cool rapidly than water bodies.
    Mountain barriers
   Influence horizontal distribution of temperature by
restricting movement of air masses. Eg. Himalayas
protect India from polar air.
    Topography
          On local scale topographic relief exerts an
influence    on   temperature        distribution.   In   northern
hemisphere north facing slopes receive less insolation
than south facing slopes and temperatures are normally
lower.
2. Vertical air temperature distribution
         The decrease in temperature with increase in
height    (altitude)    is known      as vertical    temperature
distribution.     Eg.    Permanent       snow    caps     in   high
mountains.
3. Periodical temperature distribution

                                57
The air temperature changes continuously during
a day or a year.
    Maximum insolation is received around noon
      (12.00 hr) at maximum temperature is recorded
      from 1 p.m. to 3 p.m. and delay is known as
      thermal lag.
    In northern hemisphere winter minimum occurs in
      January and summer maximum in July.
Temperature and Climatic Zones
   The climatic zones of the earth are:
    Tropical
    Sub – tropical
    Temperate
    Alpine
   These zones are differentiated on the basis of
temperature. The tropical zone is a hot winterless zone;
sub-tropical zone is a hot zone with a cool winter;
temperate zone is with a warm summer and pronounced
winter; and the alpine zone has a short summer and a
long severe winter (Himalayas, Tibetan Plateau).
Temperature inversion
      Occasionally at some altitude the temperature
abruptly increases instead of decreasing. This condition

                            58
in which this “abrupt rise instead of fall in temperature
occurs in the air” is known as the temperature inversion.
This may occurs under the following conditions.
 When the air near the ground cools off faster than the
   overlying layer, because of heat loss during cooling
   nights.
 When an actual warm layer passing over a lower cold
   layer
 Cold air from hill tops and slopes tend to flow
   downward and replaced by warm air
Significance of Temperature inversion
 Cloud         formation,   precipitation   and    atmospheric
   visibility     are   greatly    influenced      by   inversion
   phenomenon
 Impurities like smoke, dust, etc., are confined to lower
   layers
 Fog formation may take place near the ground which
   may affect the visibility to both human beings and
   animals. Affects air navigation.
 Diurnal temperature (day and night) is affected by
   temperature inversions.
 The incoming solar radiation and its conversion into
   heat is affected.

                                  59
Heat Units
              It is a measure of relative warmth of growing
season of a given length. Normally it is indicated as
“Growing Degree Days” (GDD) or “thermal units” or
“effective heat units” or “growth units”. A heat unit is the
departure from the mean daily temperature above the
minimum threshold temperature.
        The growth of plants is dependent on the total
amount of heat to which it is subjected during its life
time.
              The minimum threshold temperature is the
temperature below which no growth takes place. Usually
ranges from 4.5 to 12.5 ºC for different crops (tropical
crop 10ºC).
Degree Day Concept
              A degree day is obtained by subtracting the
threshold temperature from daily mean temperature.
Summation of the daily values over the growth period
gives degree days of the crops.
                  Tmax + Tmin
        GDD = Σ ------------------- - Tb
                    2
        Where

                                60
Tmax – Maximum air temperature of the day
                Tmin – Minimum air temperature of the day
                Tb   - Base temperature of the crop
         The     base   temperature     is    the     threshold
temperature.
Advantages / Importance of growing degree Day
Concept
•   In guiding the agricultural operations and planting
    land use.
•   To forecast crop harvest dates, yield and quality
•   In   forecasting    labour    required   for    agricultural
    operations
•   Introduction of new crops and new varieties in new
    areas
•   In predicting the likelihood of successful growth of a
    crop in an area.
Air Temperature and Plant Injury
                The injury to crop plants by air temperature
is by both low and high air temperatures.
Thermal death point
         The temperature at which the plant cell gets killed
when the temperature ranges from 50-60°C. This varies


                                 61
with plant species. The aquatic and shade loving plants
are killed at comparatively lower temperature (40°C).
I. High Temperature Injury
-   results in desiccation of plants
-   disturbs        the   physiological   activities    like
    photosynthesis and respiration
-   increases respiration leading to rapid depletion of
    reserve food.
1. Sun clad
               Injury caused on the barks of stem by high
temperature during day time and low temperature during
the night time.
2. Stem griddle
               The stem at ground level scorches around
due to high soil temperature. It causes death of plant by
destroying conductive tissues. Eg. This type of injury is
very common in young seedlings of cotton in sandy soil
when soil temperature exceeds 60°C.


II. Low Temperature (COLD) Injury


                              62
The primary effect of low air temperature
below that optimum temperature is the reduction of rates
of growth and metabolic processes.
(i)       Suffocation
           In temperature regions, usually during the winter
season, the ice or snow forms a thick cover on the soil
surface. As a result, the entry of oxygen is prevented
(deficient oxygen) and crop suffers for want of oxygen. Ice
coming in contact with the root prevents the diffusion of
CO2 outside the root zone. This prevents the respiratory
activities of roots leading to accumulation of harmful
substances.
(ii)      Heaving
        This is a kind of injury caused by lifting up of the
plants along with soil from its normal position. This type
of injury is commonly seen in temperate regions. The
presence of ice crystals increases the volume of soil. This
causes mechanical lifting of the soil.
(iii)     Chilling injury
       Plants which are adapted to hot climate, if exposed to
low temperature (0 to 10°C) for sometime, are found to be
killed or severely injured or development of chloratic
condition (yellowing) (Eg.) chloratic bands on the leaves

                               63
of sugarcane, sorghum and maize in winter months when
the night temperature is below 20°C.
(iv)    Freezing injury
        This type of injury is commonly observed in plants
of temperate regions. When the plants are exposed to
very low temperature, water freezes into ice crystals in
the intercellular spaces of plants. The protoplasm of cell
is dehydrated resulting in the death of cells.
        (Eg.) Frost damage in potato, tea etc.
Thermo periodic response
              Response    of   living   organism   to   regular
changes in temperature either day or night or seasonal is
called thermoperiodism.
Instruments to measure the air temperature
1. Maximum Thermometer: To record the maximum
temperature in a day.
2. Minimum Thermometer: To record the minimum
temperature in a day
3. Dry bulb Thermometer: To record the temperature at a
time.
4. Wet bulb Thermometer: To record the temperature at a
time under wet condition.


                               64
5. Thermograph: To record the temperature in a day
(continuous recording on a chart).
SOIL TEMPERATURE
        Soil thermal properties are strongly influenced by
the soil volumetric water content, volume fraction of
solids and volume fraction of air. Air is a poor thermal
conductor and reduces the effectiveness of the solid and
liquid phases to conduct heat. While the solid phase has
the highest conductivity it is the variability of soil
moisture that largely determines thermal conductivity.
        Temperature variations are most extreme at the
surface of the soil and these variations are transferred to
sub surface layers but at reduced rates as depth
increases. Additionally there is a time delay as to when
maximum and minimum temperatures are achieved at
increasing soil depth (sometimes referred to as thermal
lag).
        The temperature of the soil is an indicator of the
energy needed to sustain the normal activity of plants
and soil organisms. The soil temperature is one of the
most important factors that influence the crop growth.
Temperature can have a profound impact on the success
of seed germination, root and shoot growth, nutrient

                             65
uptake, crop growth and micro organisms live in the soil.
The physio-chemical as well as life processes are directly
affected by the temperature of the soil. Under the low soil
temperature conditions nitrification is inhibited and the
intake of water by root is reduced. In a similar way
extreme soil temperatures injures plant and its growth is
affected.
Eg. On the sunny side, plants are likely to develop faster
near a wall that stores and radiates heat. If shaded by
the wall, however, the same variety may mature later. In
such cases soil temperature is an important factor.
Importance of Soil Temperature on Crop Plants
The soil temperature influences many process.
1. Governs uptake of water, nutrients etc needed for
   photosynthesis.
2. Controls soil microbial activities and the optimum
   range is 18-30°C.
3. Influences the germination of seeds and development
   of roots.
4. Plays a vital role in mineralization of organic forms of
   nitrogen.(increases with increases in temperature)
5. Influences the presence of organic matter in the soil
   (more under low soil temperature)

                            66
6. Affects the speed of reactions and consequently
   weathering of minerals.
7. Influences the soil structure (types of clay formed, the
   exchangeable ions present, etc.)
Factors Affecting Soil Temperature
      Heat at ground surface is propagated downward in
the form of waves. The amplitude deceases with depth.
Both meteorological    and soil    factors contribute in
bringing about changes of soil temperature.
I) Meteorological Factors
1. Solar Radiation
a) The amount of solar radiation available at any given
   location and point of time is directly proportional to
   soil temperature.
b) Even though a part of total net radiation available is
   utilised in evapotranspiration and heating the air by
   radiation (latent and sensible heat fluxes) a relatively
   substantial amount of solar radiation is utilized in
   heating up of soil (ground heat flux) depending up on
   the nature of surface.
c) Radiation from the sky contributes a large amount of
   heat to the soil in areas where the sun’s rays have to
   penetrate the earth’s atmosphere very obliquely.

                             67
2. Wind
            Air convection or wind is necessary to heat
up the soil by conduction from the atmosphere. (Eg.) The
mountain    and      valley   winds    influence   the    soil
temperature.
3. Evaporation and Condensation
a) The greater the rate of evaporation the more the soil
   is cooled. This is the reason for coolness of moist soil
   in windy conditions.
b) On the other hand whenever water vapour from the
   atmosphere or from other soil depths condenses in
   the soil it heats up noticeably. Freezing of water
   generates heat.
4. Rainfall (Precipitation)
Depending on its temperature, precipitation can either
cool or warm the soil.
II. Soil Factors
1. Aspect and Slope
a) In the middle and high latitudes of the northern
   hemisphere,     the   southern     slopes   receive   more
   insolation per unit area than the northern exposure.
b) The south west slopes, are usually warmer than the
   south east slopes. The reason is that the direct beam

                              68
of sunshine on the south east slope occur shortly
   after prolonged cooling at night, but the evaporation
   of dew in the morning also requires energy.
2. Soil Texture
a) Because of lower heat capacity and poor thermal
   conductivity, sandy soils warm up more rapidly than
   clay soils. The energy received by it is concentrated
   mainly in a thin layer resulting in extraordinary rise
   in temperature.
b) Radiational cooling at night is greater in light soils
   than in heavy soils. In the top layer, sand has the
   greatest temperature range, followed by loam and
   clay.
c) The decrease of range with depth is more rapid in
   light soils than heavy soils when they are dry but
   slower when they are wet.
d) A soil with rough surface absorbs more solar
   radiation than one with a smooth surface.
3. Tillage and Tilth
a) By loosening the top soil and creating a mulch, tillage
   reduces the heat flow between the surface and the
   sub soil.


                           69
b) Since, the soil mulch has a greater exposure surface
   than the undisturbed soil and no capillary connection
   with moist layers below, the cultivated soil dries up
   quickly by evaporation, but the moisture in the sub-
   soil underneath the dry mulch is conserved.
c) In general soil warms up faster than air. The diurnal
   temperature wave of the cultivated soil has a much
   larger amplitude than that of the uncultivated soil.
d) The air 2-3 cm above the tilled soil is often hotter
   (10°C or above) than that over an untilled soil.
e) At night loosened ground is colder and more liable to
   frost than the uncultivated soil.
   4. Organic matter
a) The addition of organic matter to a soil reduces the
   heat capacity and thermal conductivity. But, the
   water holding capacity increases.
b) The absorbtivity of the soil increases because of the
   dark colour of the organic matter.
c) At night, the rapid flow of heat from sub-soil by
   radiation is reduced with the addition of organic
   matter because of its low thermal conductivity.
d) The darker the colour, the smaller the fraction of
   reflected radiation.

                            70
e) The dark soils and moist soils reflect less than the
   light coloured and dry soils.
5. Soil moisture
a) Moisture has an effect on heat capacity and heat
   conductivity.
b) Moisture at the soil surface cools the soil through
   evaporation.
c) Therefore, a moist soil will not heat up as much as a
   dry one.
d) Moist soil is more uniform in temperature throughout
   its depth as it is a better conductor of heat than the
   dry soil.
Variations in soil temperature
      There are two types of soil temperature variations;
daily and seasonal variation of soil temperature
1. Daily variations of soil temperature
a) These variations occur at the surface of the soil.
b) At 5 cm depth the change exceeds 10°C. At 20 cm the
   change is less and at 80 cm diurnal changes are
   practically nil.
c) On cooler days the changes are smaller due to
   increased heat capacity as the soils become wetter on
   these days.

                            71
d) On a clear sunny day a bare soil surface is hotter
   than the air temperature.
e) The time of the peak temperature of the soil reaches
   earlier than the air temperature due to the lag of the
   air temperature.
f) At around 20 cm in the soil the temperature in the
   ground reaches peak after the surface reaches its
   maximum due to more time the heat takes to
   penetrate the soil. The rate of penetration of heat
   wave within the soil takes around 3 hours to reach 10
   cm depth.
g) The cooling period of the daily cycle of the soil surface
   temperature is almost double than the warming
   period.
h) Undesirable daily temperature variations can be
   minimised by scheduling irrigation.
2. Seasonal variations of soil temperature:
a) Seasonal variations occur much deeper into the soil.
b) When the plant canopy is fully developed the
   seasonal variations are smaller.
c) In winter, the depth to which the soil freezes depends
   on the duration and severeness of the winter.


                            72
d) In summer the soil temperature variations are much
   more than winter in tropics and sub tropics.


Daily and monthly variation of soil temperature


                              73
Measurement of soil temperature
Soil thermometer: To measure the earth temperature at
shallow depth.
Units of Measurements
In Agro meteorology the two basic scales of temperature
used are:
a. Centigrade °C          b. Fahrenheit °F
Relationship between °C and °F is
      1.    °F = °C x 9/5 + 32
      2.    °C = (F- 32) x 5/9
In meteorology for upper air temperature measurements
the absolute scale °A.
      °A = 273 + °C.


                             74
Chapter - 3
  ATMOSPERIC PRESSURE AND WIND SYSTEMS OF
                      THE WORLD
      Pressure is defined as the force per unit area. The
atmospheric pressure is the weight of the air column per
unit area, above the earth surface extending to the limits
of the atmosphere. The earth’s atmosphere weighs about
60,000 billion tones. At sea level, it exerts a pressure of
about 1 kg/cm2.    It is expressed in millibar (mb) (1000
millibar = 1 bar = 1 million dynes per square centimeter).
The average pressure over the earth’s surface at sea level
is 1013.25 millibar, equivalent to the weight of a column
of 76.0 cm (30 inches) (1cm of Hg =13.33mb) of mercury
at 0º Celsius or to a weight of air of 1033.3 gram per
square cm. Unequal heating of the earth and its
atmosphere by the sun and rotation of the earth bring
about differences in atmospheric pressure. Air pressure
can tell us about what kind of weather to expect as well.
If a high pressure system is on its way, often you can
expect cooler temperatures and clear skies. If a low
pressure system is coming, then look for warmer
weather, storms and rain.


                            75
Isobars (Greek word “isos” – equal and “baros” –
weight)
         The distribution of pressure is represented on
maps by ‘isobars’. Isobars are defined as the imaginary
lines drawn on a map to join places having the same
atmospheric pressure.
Measuring Atmospheric Pressure
         Any instrument that measures air pressure is
called     a   barometer.   The   first   measurement    of
atmospheric pressure began with a simple experiment
performed by Evangelista Torricelli in 1643.
         The most common type barometer used are
aneroid barometer and mercury barometer.
Pressure systems of the world
   The shape of the earth is not uniform and subjected
to uneven distribution of solar radiation, when it revolves
around the sun. The uneven distribution of solar
radiation over different regions of the globe leads to
contrast in surface air temperature. This results in
variations of surface atmospheric pressure systems,
which are known as standard atmospheric pressure
systems / belts. There are altogether seven alternating


                             76
low and high pressure belts on the earth’s surface. They
are as follows:
    Equatorial trough of low pressure (between 5°N
      and 5°S)
    Subtropical       high   pressure   belt   (Northern
      hemisphere) (25° and 35°N)
    Subtropical       high   pressure   belt   (Southern
      hemisphere) (25° and 35°S)
    Subpolar low pressure belt (Northern hemisphere)
      (60° and 70°N)
    Subpolar low pressure belt (Southern hemisphere)
      (60° and 70°S)
    Polar high (Northern hemisphere)
    Polar high (Southern hemisphere)
   The equatorial region receives more solar radiation
and thus the surface air temperature is high, which
creates lighter air near the ground compared to higher
latitudes. The above condition leads to low atmospheric
pressure over the equatorial region while sub-tropical
high pressure belts develop in both the hemispheres
between 25 and 35 degree latitudes due to relatively low
surface air temperature. It is due to low solar radiation
received due to inclined sun’s rays over the subtropical

                              77
region when compared to the equatorial belt. Likewise
alternate   low       and    high    atmospheric     pressure   belt
systems are developed across the globe from the equator
to the poles.
                                    Polar high

                       70°
                                Subpolar low
                     60°
                35°
                                Subtropical high
                25°


                0°           Equatorial low trough


                25°
                35°             Subtropical high


                      60°       Subpolar low

                       70°
                                    Polar high


Variation in Atmospheric Pressure
(a)Variation with height (Vertical pressure variation)
a. Pressure decreases with height.


                                    78
b. This is natural since the height of the atmosphere
   column above decreases with height.
(b) Horizontal pressure variation
a. Temperature and pressure are inverse to each other.
   Along equator low pressure exists and in cold polar
   latitudes polar high exists.
b. Horizontal variation of air pressure on the surface of
   the earth are indicated by Isobars.
c. The horizontal variation of pressure depends on
   Temperature, extent of water vapour, land water
   realationship etc.,
(c )Diurnal pressure variation
  a) There is a definite rhythm in the rise and fall of the
     pressure in a day.
  b) Radiational heating (air expansion) and radiational
     cooling (air contraction) are the main reasons for
     diurnal variation in the air pressure.
  c) Diurnal variation is more prominent near the
     equator than at the mid latitudes.
  d) The areas closer to sea level record relatively larger
     amount of variation than in land areas.


                            79
e) Equatorial regions absorbs more heat than it loses
      while the polar region gives up more heat than they
      receive.
(d) Seasonal pressure variation
   a) Due to the effect caused by annual variation in the
      amount of insolation, distinct seasonal pressure
      variations occur.
   b) These variations are larger in the tropical region
      than the mid latitude and polar regions.
   c) Usually, high pressures are recorded over the
      continents during the cold season and over the
      oceans during the warm season.


Causes of variation
      The atmospheric pressure changes continuously
due to several factors. The most important factors are
changes   with   temperature,    altitude,   water   vapour
content and rotation of earth.
a) Temperature
      Hot air expands and exerts low pressure. Cold air
contracts and exerts high pressure. So the equator has a

                            80
low pressure due to prevalence of high temperature but
poles have a high pressure.
b) Altitude
       At sea level, the air column exerts its full pressure,
but when we stand on a hill or when we go in the upper
layers of atmosphere, we leave a portion of air which
cannot exert its full pressure. At sea level, a coastal town
enjoys high pressure but on high altitude one will
register a low pressure. For every 10 m of ascend, the
pressure get reduced by 1 hPa.
c) Water vapour
       The water vapour content is lighter in cold area
than in air which is dry with the result that moist air of a
high temperature exerts a less pressure when compared
to cold air.
d) Rotation of the earth
       On account of rotation of the earth, the pressure
at 60-70°N and S becomes low. The rotation of the earth
near sub-polar belts, makes the air to escape from these
belts which move towards the horse latitude (30° - 35°N
and 30 – 35°S). These latitudes absorb the air from sub
polar belts making the pressure high. G.D.Coriolis (1844)
a French Mathematician indicated that air is deflected

                              81
towards right in the Northern Hemisphere and Left in the
Southern hemisphere due to rotation of earth and this
was termed after him as Coriolis force. Coriolis force is
not actually a force but it is effect created by rotation of
earth.
Importance of pressure on crop plants
Pressure patterns
Low / Depression or cyclone
         When the isobars are circular or elliptical in shape,
and the pressure is lowest at the centre, such a pressure
system is called ‘Low’ or ‘Depression’ or ‘Cyclone’. The
movement       will   be   anti-clockwise   in   the   Northern
hemisphere while it is clockwise in the southern
hemisphere. Wind speed hardly exceeds 40 km per hour.
High pressure or Anticyclone
         When isobars are circular, elliptical in shape and
the pressure is highest at the centre such a pressure
system is called ‘High’ or ‘Anticyclone’. When the isobars
are elliptical rather than circular the system is called as
‘Ridge’ or ‘Wedge’. The movement will be clockwise in the
Northern hemisphere while it is anti-clockwise in the
southern hemisphere.
Atmospheric Humidity

                                82
The amount of water vapour that is present in
atmosphere is known as atmospheric moisture or
humidity.
Absolute humidity
        The actual mass of water vapour present in a
given volume of moist air. It is expressed as grams of
water vapour per cubic meter or cubic feet.
Specific humidity
      Weight of water vapour per unit weight of moist air.
It is expressed as grams of water vapour per kilogram of
air (g/kg).
Mixing ratio
      The ratio of the mass of water vapour contained in
a sample of moist air to the mass of dry air. It is
expressed as gram of water vapour per kilogram dry air.
Relative Humidity
      The ratio between the amount of water vapour
present in a given volume of air and the amount of water
vapour required for saturation under fixed temperature
and pressure. There are no units and this is expressed as
percentage. In other terms it is the ratio of the air’s water
vapour content to its maximum water vapour capacity at
a given temperature expressed in percentage. The relative

                             83
humidity gives only the degree of saturation of air. The
relative humidity of saturated air is 100 per cent.
Dew Point temperature
       The temperature to which a given parcel of air
must be cooled in order to become saturation at constant
pressure and water vapour content. In this case, the
invisible water vapour begins to condense into visible
form like water droplets.
Vapour Pressure deficit
      The   difference   between   the saturated      vapour
pressure (SVP) and actual vapour pressure (AVP) at a
given temperature. This is an another measure of
moisture in the atmosphere which is useful in crop
growth studies. When air contains all the moisture that it
can hold to its maximum limit, it is called as saturated
air, otherwise it is unsaturated air, at that temperature.
The vapour pressure created at this temperature under
saturated conditions is vapour pressure or saturated
vapour pressure (SVP).
Importance of Humidity on crop plants
      The humidity is not an independent factor. It is
closely related to rainfall, wind and temperature. It plays
a significant role in crop production

                             84
1. The humidity determines the crops grown in a given
   region
2. It affects the internal water potential of plants
3. It influences certain physiological phenomena in crop
   plants including transpiration
4. The humidity is a major determinant of potential
   evapotranspiration.    So,     it   determines   the   water
   requirement of crops
5. High humidity reduces irrigation water requirement
   of crops as the evapotranspiration losses from crops
   depends on atmospheric humidity
6. High humidity can prolong the survival of crops
   under moisture stress. However, very high or very low
   relative humidity is not conducive to higher yields of
   crops
7. There are harmful effects of high humidity. It
   enhances the growth of some saprophytic and
   parasitic fungi, bacteria and pests, the growth of
   which causes extensive damage to crop plants.
Eg: a. Blight disease on potato.
      b. The damage caused by thrips and jassids on
     several crops
8. High humidity at grain filling reduces the crop yields

                             85
9. A very high relative humidity is beneficial to maize,
   sorghum, sugarcane etc, while it is harmful to crops
   like sunflower and tobacco
10.For almost all the crops, it is always safe to have a
   moderate relative humidity of above 40%.
Variation in Humidity
1. Absolute humidity is highest at the equator and
  minimum at the poles.
2. Absolute   humidity   is   minimum   at   sunrise    and
  maximum in afternoon from 2 to 3 p.m. The diurnal
  variations are small in desert regions.
3. The relative humidity is maximum at about the
  sunrise and minimum between 2 to 3 p.m.
4. The behaviour of relative humidity differs a lot from
  absolute humidity. At the equator it is at a maximum
  of 80 per cent and around 85 per cent at the poles.
  But, near horse latitudes it is around 70 per cent.
   Measurement of Humidity


                              86
Wind
       Air in horizontal motion is known as wind. Vertical
movement is noticed but negligibly small compared to
horizontal movement as the height of the atmosphere is
only for few kilometers. However vertical movement or
uplift of air only causes significant weather changes in
cloud formation and rain.
Wind systems of the world
The wind belts found on earth’s surface in each
hemisphere are:
  a) Doldrums
  b) Trade wind belt
  c) Prevailing westerlies
  d) Polar easterlies
1. Doldrums
Owing to continuous heating of the earth by insolation,
pressures are low and winds converge and rise near the
equator. This intertropical convergent zone is known as
‘Doldrums’.
   a) These are the equatorial belts of calms and
       variable winds.
   b) The location is 5°S and 5°N latitudes.
   c) Wind is light due to negligible pressure gradient.

                             87
d) Mostly, there are vertical movements in the
      atmosphere.
   e) The atmosphere is hot and sticky.
2. Trade winds (Tropical Easterlies)
   a) The regular high temperature at the equator
      results in a high pressure forming in the upper
      levels of the equator.
   b) Then, the air is transferred to the northward and
      southward directions until 35° North and South in
      both the hemisphere.


                               88
c) Due to this reduction in surface pressure on the
      equator   (doldrums)    there   is     an   increase   in
      pressure at 35°N and 35°S which are known as
      horse latitude (sub-tropical high).
   d) As a result, the winds flow from the horse latitude
      to the equatorial region.
   e) While moving, these winds are deflected by
      Coriolis force to the right in northern hemisphere
      and to the left in southern hemisphere.
   f) These winds flow from 35°N to the equator in NE
      direction in the northern hemisphere and from
      35°S to the equator in SE direction in the
      southern hemisphere. These are known as ‘Trade
      winds’. These are known as ‘Tropical easterlies’.
   g) These are most constant winds in force and
      direction and flow over nearly half the globe.
3. Anti-trade winds
   a) This is a supplementary wind system of the earth
      which is effective at higher levels.
   b) This system works in opposite direction to the
      surface winds.
   c) The anti-trade winds mostly flow from land to
      ocean and brings no rain.

                             89
4. Prevailing Westerlies
   a) The winds that flow from sub-tropical high to the
      low-pressure area about 60-70° latitudes in both
      the   hemispheres     are   known    as     ‘Prevailing
      westerlies’.
   b) In the northern hemisphere the direction of
      Prevailing westerlies is SW and in southern
      hemisphere NW.
   c) These winds are forceful and are irregular as
      compare to the trade winds in the tropical regions.
      This is high precipitation zone
5. Polar Easterlies / Polar winds
   a) A permanent high pressure exists on the poles.
   b) From these high pressure polar regions, cold
      winds flow to areas at about 60-65° latitudes in
      both the hemispheres.
   c) The winds flow in NE direction in the northern
      hemisphere and in SE direction in the southern
      hemisphere.
Mountain winds
   a) Blows from mountain up slope to base
   b) Occurs during night time
   c) Cooling of air close to slope takes place

                            90
d) Adiabatic heating decreases this phenomenon
   e) Also known as ‘Katabalic winds’
Valley winds
   a) Blow from valley base to up slope.
   b) Occurs during day time
   c) Over heating of air adjacent to slope takes place
   d) Adiabatic cooling decreases this phenomenon
   e) Also known as ‘Anabatic winds’
Sea breeze
      During the daytime, more in summer, land is
heated more than the adjacent body of water. As a result
warmed air over the land expands producing an area of
low pressure. The isobaric surfaces bend upward as a
result of which the cooler air starts moving across the
coast line from sea to land. This is the ‘Sea breeze; or ‘On
shore breeze’.
Land breeze
      At night because of nocturnal radiation land is
colder than adjacent sea and the pressure gradient is
directed from land to sea. There is a gentle flow of wind
from land to sea. This ‘off-share’ wind is called ‘Land
breeze’.
Effect of wind on crop plants

                             91
1. Transports heat in either sensible or latent heat form
     from lower to higher altitudes
  2. Wind    affects    the   plant    directly   by    increasing
     transpiration and the intake of CO2 and also causes
     several types of mechanical damage
  3. Wind helps in pollination and dispersal of seeds
  4. Light and gentle winds are helpful for cleaning the
     agricultural produce
  5. Hot    dry   winds   frequently    do   much      damage   to
     vegetation in the growing crops by promoting excessive
     water loss
  6. Wind has powerful effect on humidity
  7. Long, continued warm, dry winds injured blossoms by
     evaporating the secretion of the stigma
  8. Provides moisture which is necessary for precipitation
  9. Wind    prevents     frost   by   disrupting      atmospheric
     inversion
  10.Causes soil erosion


Speed and Direction of wind


   Measurement of wind

                                  92
Smsk new.book.1
Smsk new.book.1
Smsk new.book.1
Smsk new.book.1
Smsk new.book.1
Smsk new.book.1
Smsk new.book.1
Smsk new.book.1
Smsk new.book.1
Smsk new.book.1
Smsk new.book.1
Smsk new.book.1
Smsk new.book.1
Smsk new.book.1
Smsk new.book.1
Smsk new.book.1
Smsk new.book.1
Smsk new.book.1
Smsk new.book.1
Smsk new.book.1
Smsk new.book.1
Smsk new.book.1
Smsk new.book.1
Smsk new.book.1
Smsk new.book.1
Smsk new.book.1
Smsk new.book.1
Smsk new.book.1
Smsk new.book.1
Smsk new.book.1
Smsk new.book.1
Smsk new.book.1
Smsk new.book.1
Smsk new.book.1
Smsk new.book.1
Smsk new.book.1
Smsk new.book.1
Smsk new.book.1
Smsk new.book.1
Smsk new.book.1
Smsk new.book.1
Smsk new.book.1
Smsk new.book.1
Smsk new.book.1
Smsk new.book.1
Smsk new.book.1
Smsk new.book.1
Smsk new.book.1
Smsk new.book.1
Smsk new.book.1
Smsk new.book.1
Smsk new.book.1
Smsk new.book.1
Smsk new.book.1
Smsk new.book.1
Smsk new.book.1
Smsk new.book.1
Smsk new.book.1
Smsk new.book.1
Smsk new.book.1
Smsk new.book.1
Smsk new.book.1
Smsk new.book.1
Smsk new.book.1
Smsk new.book.1

Mais conteúdo relacionado

Mais procurados

Climate change and vulnerability assessment in agriculture
Climate change and vulnerability assessment in agricultureClimate change and vulnerability assessment in agriculture
Climate change and vulnerability assessment in agricultureDr. Rupan Raghuvanshi
 
Degree day concept and phenology forecasting and crop calender
Degree day concept and phenology forecasting and crop calenderDegree day concept and phenology forecasting and crop calender
Degree day concept and phenology forecasting and crop calenderKartik Patel
 
Climate Resilient Agriculture an Approach to Reduce the Ill-Effect of Climate...
Climate Resilient Agriculture an Approach to Reduce the Ill-Effect of Climate...Climate Resilient Agriculture an Approach to Reduce the Ill-Effect of Climate...
Climate Resilient Agriculture an Approach to Reduce the Ill-Effect of Climate...UditDebangshi
 
Effect of climate change crop production in the world
Effect of climate change crop production in the worldEffect of climate change crop production in the world
Effect of climate change crop production in the worldkwanigasuriya
 
Crop response production function
Crop response production functionCrop response production function
Crop response production functionAnkush Singh
 
Strategies for Mitigation and Adaptation in Agriculture in context to Changin...
Strategies for Mitigation and Adaptation in Agriculture in context to Changin...Strategies for Mitigation and Adaptation in Agriculture in context to Changin...
Strategies for Mitigation and Adaptation in Agriculture in context to Changin...Abhilash Singh Chauhan
 
Adaptive response strategy of farmers to changing rainfall averages in parts ...
Adaptive response strategy of farmers to changing rainfall averages in parts ...Adaptive response strategy of farmers to changing rainfall averages in parts ...
Adaptive response strategy of farmers to changing rainfall averages in parts ...Alexander Decker
 
O que influencia a percepção dos produtores rurais no contexto das mudanças c...
O que influencia a percepção dos produtores rurais no contexto das mudanças c...O que influencia a percepção dos produtores rurais no contexto das mudanças c...
O que influencia a percepção dos produtores rurais no contexto das mudanças c...Cristian Foguesatto
 
Siemenpuu Sinfpad Core Committee May 09
Siemenpuu  Sinfpad Core Committee  May 09Siemenpuu  Sinfpad Core Committee  May 09
Siemenpuu Sinfpad Core Committee May 09Srinivasan Rengasamy
 
Is it weather or is it climate? What is the difference?
Is it weather or is it climate? What is the difference?Is it weather or is it climate? What is the difference?
Is it weather or is it climate? What is the difference?LPE Learning Center
 
Environmental factors that affecting plant growth]
Environmental factors that affecting plant growth]Environmental factors that affecting plant growth]
Environmental factors that affecting plant growth]NurMohammad65
 
Factors of climate extremes hyperactivity: a study on MENA
Factors of climate extremes hyperactivity: a study on MENAFactors of climate extremes hyperactivity: a study on MENA
Factors of climate extremes hyperactivity: a study on MENAPremier Publishers
 
SIEUSOIL Newsletter
SIEUSOIL Newsletter SIEUSOIL Newsletter
SIEUSOIL Newsletter SIEUSOIL
 
Agromet Observatory
Agromet ObservatoryAgromet Observatory
Agromet ObservatoryAnakha Mohan
 
Impacts of climate change on livestock sector and Kenya’s preparedness on the...
Impacts of climate change on livestock sector and Kenya’s preparedness on the...Impacts of climate change on livestock sector and Kenya’s preparedness on the...
Impacts of climate change on livestock sector and Kenya’s preparedness on the...ILRI
 
ISU Agron 342
ISU Agron 342ISU Agron 342
ISU Agron 342flyingd
 

Mais procurados (20)

Climate change and vulnerability assessment in agriculture
Climate change and vulnerability assessment in agricultureClimate change and vulnerability assessment in agriculture
Climate change and vulnerability assessment in agriculture
 
Degree day concept and phenology forecasting and crop calender
Degree day concept and phenology forecasting and crop calenderDegree day concept and phenology forecasting and crop calender
Degree day concept and phenology forecasting and crop calender
 
Climate Resilient Agriculture an Approach to Reduce the Ill-Effect of Climate...
Climate Resilient Agriculture an Approach to Reduce the Ill-Effect of Climate...Climate Resilient Agriculture an Approach to Reduce the Ill-Effect of Climate...
Climate Resilient Agriculture an Approach to Reduce the Ill-Effect of Climate...
 
Simelton_CV_Aug2016
Simelton_CV_Aug2016Simelton_CV_Aug2016
Simelton_CV_Aug2016
 
Effect of climate change crop production in the world
Effect of climate change crop production in the worldEffect of climate change crop production in the world
Effect of climate change crop production in the world
 
Crop response production function
Crop response production functionCrop response production function
Crop response production function
 
Strategies for Mitigation and Adaptation in Agriculture in context to Changin...
Strategies for Mitigation and Adaptation in Agriculture in context to Changin...Strategies for Mitigation and Adaptation in Agriculture in context to Changin...
Strategies for Mitigation and Adaptation in Agriculture in context to Changin...
 
Adaptive response strategy of farmers to changing rainfall averages in parts ...
Adaptive response strategy of farmers to changing rainfall averages in parts ...Adaptive response strategy of farmers to changing rainfall averages in parts ...
Adaptive response strategy of farmers to changing rainfall averages in parts ...
 
Climate change and Australian farming systems - Peter Hayman, SARDI
Climate change and Australian farming systems - Peter Hayman, SARDIClimate change and Australian farming systems - Peter Hayman, SARDI
Climate change and Australian farming systems - Peter Hayman, SARDI
 
O que influencia a percepção dos produtores rurais no contexto das mudanças c...
O que influencia a percepção dos produtores rurais no contexto das mudanças c...O que influencia a percepção dos produtores rurais no contexto das mudanças c...
O que influencia a percepção dos produtores rurais no contexto das mudanças c...
 
Climate change on plant process
Climate change on plant processClimate change on plant process
Climate change on plant process
 
Siemenpuu Sinfpad Core Committee May 09
Siemenpuu  Sinfpad Core Committee  May 09Siemenpuu  Sinfpad Core Committee  May 09
Siemenpuu Sinfpad Core Committee May 09
 
Why does climate change?
Why does climate change?Why does climate change?
Why does climate change?
 
Is it weather or is it climate? What is the difference?
Is it weather or is it climate? What is the difference?Is it weather or is it climate? What is the difference?
Is it weather or is it climate? What is the difference?
 
Environmental factors that affecting plant growth]
Environmental factors that affecting plant growth]Environmental factors that affecting plant growth]
Environmental factors that affecting plant growth]
 
Factors of climate extremes hyperactivity: a study on MENA
Factors of climate extremes hyperactivity: a study on MENAFactors of climate extremes hyperactivity: a study on MENA
Factors of climate extremes hyperactivity: a study on MENA
 
SIEUSOIL Newsletter
SIEUSOIL Newsletter SIEUSOIL Newsletter
SIEUSOIL Newsletter
 
Agromet Observatory
Agromet ObservatoryAgromet Observatory
Agromet Observatory
 
Impacts of climate change on livestock sector and Kenya’s preparedness on the...
Impacts of climate change on livestock sector and Kenya’s preparedness on the...Impacts of climate change on livestock sector and Kenya’s preparedness on the...
Impacts of climate change on livestock sector and Kenya’s preparedness on the...
 
ISU Agron 342
ISU Agron 342ISU Agron 342
ISU Agron 342
 

Semelhante a Smsk new.book.1

AGRO 112 Lacture 1 ppt.pptx
AGRO 112 Lacture 1 ppt.pptxAGRO 112 Lacture 1 ppt.pptx
AGRO 112 Lacture 1 ppt.pptxKaivalPatel16
 
AGROMETEOROLOGICAL LECTURE NOTES FOR OBSERVERS 2
AGROMETEOROLOGICAL LECTURE NOTES FOR   OBSERVERS 2AGROMETEOROLOGICAL LECTURE NOTES FOR   OBSERVERS 2
AGROMETEOROLOGICAL LECTURE NOTES FOR OBSERVERS 2Almaz Demessie
 
AGM Training for Debre Zeit regnal
AGM Training for Debre Zeit regnal AGM Training for Debre Zeit regnal
AGM Training for Debre Zeit regnal Almaz Demessie
 
Gardening and landscaping @Rajeev Ranjan.ppt
Gardening and landscaping @Rajeev Ranjan.pptGardening and landscaping @Rajeev Ranjan.ppt
Gardening and landscaping @Rajeev Ranjan.pptRajeev Verma
 
Unit 2 Weather & Climate_response with crops.pptx
Unit 2 Weather & Climate_response with crops.pptxUnit 2 Weather & Climate_response with crops.pptx
Unit 2 Weather & Climate_response with crops.pptxGovinda Raj Sedai
 
ROLE OF INDIAN INSTITUTE OF TROPICAL INSTITUTE
ROLE OF INDIAN INSTITUTE OF TROPICAL INSTITUTEROLE OF INDIAN INSTITUTE OF TROPICAL INSTITUTE
ROLE OF INDIAN INSTITUTE OF TROPICAL INSTITUTEAbhimanyu Tomar
 
Drought tolerance in crops
Drought tolerance in cropsDrought tolerance in crops
Drought tolerance in cropsVikas Verma
 
Climate risks
Climate risksClimate risks
Climate riskscenafrica
 
Agrometeorology And It's Importance In Crop Production
Agrometeorology And It's Importance In Crop ProductionAgrometeorology And It's Importance In Crop Production
Agrometeorology And It's Importance In Crop ProductionV S Anu Krishna
 
Effects of Climate Change on Agriculture Particularly in Semi 2008
Effects of Climate Change on Agriculture Particularly in Semi 2008Effects of Climate Change on Agriculture Particularly in Semi 2008
Effects of Climate Change on Agriculture Particularly in Semi 2008Almaz Demessie
 
Crop production losses in west africa due to global warming
Crop production losses in west africa due to global warmingCrop production losses in west africa due to global warming
Crop production losses in west africa due to global warmingPatrickTanz
 
Food Security Production Challenges in Indonesia as Impact of Global Climate ...
Food Security Production Challenges in Indonesia as Impact of Global Climate ...Food Security Production Challenges in Indonesia as Impact of Global Climate ...
Food Security Production Challenges in Indonesia as Impact of Global Climate ...Agriculture Journal IJOEAR
 

Semelhante a Smsk new.book.1 (20)

AGRO 112 Lacture 1 ppt.pptx
AGRO 112 Lacture 1 ppt.pptxAGRO 112 Lacture 1 ppt.pptx
AGRO 112 Lacture 1 ppt.pptx
 
AGROMETEOROLOGICAL LECTURE NOTES FOR OBSERVERS 2
AGROMETEOROLOGICAL LECTURE NOTES FOR   OBSERVERS 2AGROMETEOROLOGICAL LECTURE NOTES FOR   OBSERVERS 2
AGROMETEOROLOGICAL LECTURE NOTES FOR OBSERVERS 2
 
AGM Training for Debre Zeit regnal
AGM Training for Debre Zeit regnal AGM Training for Debre Zeit regnal
AGM Training for Debre Zeit regnal
 
Aag 102
Aag 102Aag 102
Aag 102
 
Agroclimatology
AgroclimatologyAgroclimatology
Agroclimatology
 
Gardening and landscaping @Rajeev Ranjan.ppt
Gardening and landscaping @Rajeev Ranjan.pptGardening and landscaping @Rajeev Ranjan.ppt
Gardening and landscaping @Rajeev Ranjan.ppt
 
Weather forecasting
Weather forecastingWeather forecasting
Weather forecasting
 
Meteorology assignment
Meteorology assignmentMeteorology assignment
Meteorology assignment
 
Unit 2 Weather & Climate_response with crops.pptx
Unit 2 Weather & Climate_response with crops.pptxUnit 2 Weather & Climate_response with crops.pptx
Unit 2 Weather & Climate_response with crops.pptx
 
Bbp 201
Bbp 201Bbp 201
Bbp 201
 
ROLE OF INDIAN INSTITUTE OF TROPICAL INSTITUTE
ROLE OF INDIAN INSTITUTE OF TROPICAL INSTITUTEROLE OF INDIAN INSTITUTE OF TROPICAL INSTITUTE
ROLE OF INDIAN INSTITUTE OF TROPICAL INSTITUTE
 
Rion salman ayufitriya
Rion salman ayufitriyaRion salman ayufitriya
Rion salman ayufitriya
 
Drought tolerance in crops
Drought tolerance in cropsDrought tolerance in crops
Drought tolerance in crops
 
Climate risks
Climate risksClimate risks
Climate risks
 
Samoa
SamoaSamoa
Samoa
 
Samoa
SamoaSamoa
Samoa
 
Agrometeorology And It's Importance In Crop Production
Agrometeorology And It's Importance In Crop ProductionAgrometeorology And It's Importance In Crop Production
Agrometeorology And It's Importance In Crop Production
 
Effects of Climate Change on Agriculture Particularly in Semi 2008
Effects of Climate Change on Agriculture Particularly in Semi 2008Effects of Climate Change on Agriculture Particularly in Semi 2008
Effects of Climate Change on Agriculture Particularly in Semi 2008
 
Crop production losses in west africa due to global warming
Crop production losses in west africa due to global warmingCrop production losses in west africa due to global warming
Crop production losses in west africa due to global warming
 
Food Security Production Challenges in Indonesia as Impact of Global Climate ...
Food Security Production Challenges in Indonesia as Impact of Global Climate ...Food Security Production Challenges in Indonesia as Impact of Global Climate ...
Food Security Production Challenges in Indonesia as Impact of Global Climate ...
 

Último

ICS2208 Lecture6 Notes for SL spaces.pdf
ICS2208 Lecture6 Notes for SL spaces.pdfICS2208 Lecture6 Notes for SL spaces.pdf
ICS2208 Lecture6 Notes for SL spaces.pdfVanessa Camilleri
 
31 ĐỀ THI THỬ VÀO LỚP 10 - TIẾNG ANH - FORM MỚI 2025 - 40 CÂU HỎI - BÙI VĂN V...
31 ĐỀ THI THỬ VÀO LỚP 10 - TIẾNG ANH - FORM MỚI 2025 - 40 CÂU HỎI - BÙI VĂN V...31 ĐỀ THI THỬ VÀO LỚP 10 - TIẾNG ANH - FORM MỚI 2025 - 40 CÂU HỎI - BÙI VĂN V...
31 ĐỀ THI THỬ VÀO LỚP 10 - TIẾNG ANH - FORM MỚI 2025 - 40 CÂU HỎI - BÙI VĂN V...Nguyen Thanh Tu Collection
 
4.16.24 21st Century Movements for Black Lives.pptx
4.16.24 21st Century Movements for Black Lives.pptx4.16.24 21st Century Movements for Black Lives.pptx
4.16.24 21st Century Movements for Black Lives.pptxmary850239
 
Beauty Amidst the Bytes_ Unearthing Unexpected Advantages of the Digital Wast...
Beauty Amidst the Bytes_ Unearthing Unexpected Advantages of the Digital Wast...Beauty Amidst the Bytes_ Unearthing Unexpected Advantages of the Digital Wast...
Beauty Amidst the Bytes_ Unearthing Unexpected Advantages of the Digital Wast...DhatriParmar
 
Using Grammatical Signals Suitable to Patterns of Idea Development
Using Grammatical Signals Suitable to Patterns of Idea DevelopmentUsing Grammatical Signals Suitable to Patterns of Idea Development
Using Grammatical Signals Suitable to Patterns of Idea Developmentchesterberbo7
 
Team Lead Succeed – Helping you and your team achieve high-performance teamwo...
Team Lead Succeed – Helping you and your team achieve high-performance teamwo...Team Lead Succeed – Helping you and your team achieve high-performance teamwo...
Team Lead Succeed – Helping you and your team achieve high-performance teamwo...Association for Project Management
 
4.16.24 Poverty and Precarity--Desmond.pptx
4.16.24 Poverty and Precarity--Desmond.pptx4.16.24 Poverty and Precarity--Desmond.pptx
4.16.24 Poverty and Precarity--Desmond.pptxmary850239
 
How to Manage Buy 3 Get 1 Free in Odoo 17
How to Manage Buy 3 Get 1 Free in Odoo 17How to Manage Buy 3 Get 1 Free in Odoo 17
How to Manage Buy 3 Get 1 Free in Odoo 17Celine George
 
Concurrency Control in Database Management system
Concurrency Control in Database Management systemConcurrency Control in Database Management system
Concurrency Control in Database Management systemChristalin Nelson
 
Tree View Decoration Attribute in the Odoo 17
Tree View Decoration Attribute in the Odoo 17Tree View Decoration Attribute in the Odoo 17
Tree View Decoration Attribute in the Odoo 17Celine George
 
Grade Three -ELLNA-REVIEWER-ENGLISH.pptx
Grade Three -ELLNA-REVIEWER-ENGLISH.pptxGrade Three -ELLNA-REVIEWER-ENGLISH.pptx
Grade Three -ELLNA-REVIEWER-ENGLISH.pptxkarenfajardo43
 
Reading and Writing Skills 11 quarter 4 melc 1
Reading and Writing Skills 11 quarter 4 melc 1Reading and Writing Skills 11 quarter 4 melc 1
Reading and Writing Skills 11 quarter 4 melc 1GloryAnnCastre1
 
Scientific Writing :Research Discourse
Scientific  Writing :Research  DiscourseScientific  Writing :Research  Discourse
Scientific Writing :Research DiscourseAnita GoswamiGiri
 
Indexing Structures in Database Management system.pdf
Indexing Structures in Database Management system.pdfIndexing Structures in Database Management system.pdf
Indexing Structures in Database Management system.pdfChristalin Nelson
 
CLASSIFICATION OF ANTI - CANCER DRUGS.pptx
CLASSIFICATION OF ANTI - CANCER DRUGS.pptxCLASSIFICATION OF ANTI - CANCER DRUGS.pptx
CLASSIFICATION OF ANTI - CANCER DRUGS.pptxAnupam32727
 
Transaction Management in Database Management System
Transaction Management in Database Management SystemTransaction Management in Database Management System
Transaction Management in Database Management SystemChristalin Nelson
 
Congestive Cardiac Failure..presentation
Congestive Cardiac Failure..presentationCongestive Cardiac Failure..presentation
Congestive Cardiac Failure..presentationdeepaannamalai16
 
ICS 2208 Lecture Slide Notes for Topic 6
ICS 2208 Lecture Slide Notes for Topic 6ICS 2208 Lecture Slide Notes for Topic 6
ICS 2208 Lecture Slide Notes for Topic 6Vanessa Camilleri
 
Unraveling Hypertext_ Analyzing Postmodern Elements in Literature.pptx
Unraveling Hypertext_ Analyzing  Postmodern Elements in  Literature.pptxUnraveling Hypertext_ Analyzing  Postmodern Elements in  Literature.pptx
Unraveling Hypertext_ Analyzing Postmodern Elements in Literature.pptxDhatriParmar
 

Último (20)

ICS2208 Lecture6 Notes for SL spaces.pdf
ICS2208 Lecture6 Notes for SL spaces.pdfICS2208 Lecture6 Notes for SL spaces.pdf
ICS2208 Lecture6 Notes for SL spaces.pdf
 
31 ĐỀ THI THỬ VÀO LỚP 10 - TIẾNG ANH - FORM MỚI 2025 - 40 CÂU HỎI - BÙI VĂN V...
31 ĐỀ THI THỬ VÀO LỚP 10 - TIẾNG ANH - FORM MỚI 2025 - 40 CÂU HỎI - BÙI VĂN V...31 ĐỀ THI THỬ VÀO LỚP 10 - TIẾNG ANH - FORM MỚI 2025 - 40 CÂU HỎI - BÙI VĂN V...
31 ĐỀ THI THỬ VÀO LỚP 10 - TIẾNG ANH - FORM MỚI 2025 - 40 CÂU HỎI - BÙI VĂN V...
 
4.16.24 21st Century Movements for Black Lives.pptx
4.16.24 21st Century Movements for Black Lives.pptx4.16.24 21st Century Movements for Black Lives.pptx
4.16.24 21st Century Movements for Black Lives.pptx
 
Beauty Amidst the Bytes_ Unearthing Unexpected Advantages of the Digital Wast...
Beauty Amidst the Bytes_ Unearthing Unexpected Advantages of the Digital Wast...Beauty Amidst the Bytes_ Unearthing Unexpected Advantages of the Digital Wast...
Beauty Amidst the Bytes_ Unearthing Unexpected Advantages of the Digital Wast...
 
Using Grammatical Signals Suitable to Patterns of Idea Development
Using Grammatical Signals Suitable to Patterns of Idea DevelopmentUsing Grammatical Signals Suitable to Patterns of Idea Development
Using Grammatical Signals Suitable to Patterns of Idea Development
 
Team Lead Succeed – Helping you and your team achieve high-performance teamwo...
Team Lead Succeed – Helping you and your team achieve high-performance teamwo...Team Lead Succeed – Helping you and your team achieve high-performance teamwo...
Team Lead Succeed – Helping you and your team achieve high-performance teamwo...
 
4.16.24 Poverty and Precarity--Desmond.pptx
4.16.24 Poverty and Precarity--Desmond.pptx4.16.24 Poverty and Precarity--Desmond.pptx
4.16.24 Poverty and Precarity--Desmond.pptx
 
How to Manage Buy 3 Get 1 Free in Odoo 17
How to Manage Buy 3 Get 1 Free in Odoo 17How to Manage Buy 3 Get 1 Free in Odoo 17
How to Manage Buy 3 Get 1 Free in Odoo 17
 
Concurrency Control in Database Management system
Concurrency Control in Database Management systemConcurrency Control in Database Management system
Concurrency Control in Database Management system
 
Tree View Decoration Attribute in the Odoo 17
Tree View Decoration Attribute in the Odoo 17Tree View Decoration Attribute in the Odoo 17
Tree View Decoration Attribute in the Odoo 17
 
INCLUSIVE EDUCATION PRACTICES FOR TEACHERS AND TRAINERS.pptx
INCLUSIVE EDUCATION PRACTICES FOR TEACHERS AND TRAINERS.pptxINCLUSIVE EDUCATION PRACTICES FOR TEACHERS AND TRAINERS.pptx
INCLUSIVE EDUCATION PRACTICES FOR TEACHERS AND TRAINERS.pptx
 
Grade Three -ELLNA-REVIEWER-ENGLISH.pptx
Grade Three -ELLNA-REVIEWER-ENGLISH.pptxGrade Three -ELLNA-REVIEWER-ENGLISH.pptx
Grade Three -ELLNA-REVIEWER-ENGLISH.pptx
 
Reading and Writing Skills 11 quarter 4 melc 1
Reading and Writing Skills 11 quarter 4 melc 1Reading and Writing Skills 11 quarter 4 melc 1
Reading and Writing Skills 11 quarter 4 melc 1
 
Scientific Writing :Research Discourse
Scientific  Writing :Research  DiscourseScientific  Writing :Research  Discourse
Scientific Writing :Research Discourse
 
Indexing Structures in Database Management system.pdf
Indexing Structures in Database Management system.pdfIndexing Structures in Database Management system.pdf
Indexing Structures in Database Management system.pdf
 
CLASSIFICATION OF ANTI - CANCER DRUGS.pptx
CLASSIFICATION OF ANTI - CANCER DRUGS.pptxCLASSIFICATION OF ANTI - CANCER DRUGS.pptx
CLASSIFICATION OF ANTI - CANCER DRUGS.pptx
 
Transaction Management in Database Management System
Transaction Management in Database Management SystemTransaction Management in Database Management System
Transaction Management in Database Management System
 
Congestive Cardiac Failure..presentation
Congestive Cardiac Failure..presentationCongestive Cardiac Failure..presentation
Congestive Cardiac Failure..presentation
 
ICS 2208 Lecture Slide Notes for Topic 6
ICS 2208 Lecture Slide Notes for Topic 6ICS 2208 Lecture Slide Notes for Topic 6
ICS 2208 Lecture Slide Notes for Topic 6
 
Unraveling Hypertext_ Analyzing Postmodern Elements in Literature.pptx
Unraveling Hypertext_ Analyzing  Postmodern Elements in  Literature.pptxUnraveling Hypertext_ Analyzing  Postmodern Elements in  Literature.pptx
Unraveling Hypertext_ Analyzing Postmodern Elements in Literature.pptx
 

Smsk new.book.1

  • 1. AGRICULTURAL METEOROLOGY Dr. S.M. Sureshkumar Dr. G. Baradhan Dr. S. Manimaran Dr. N. Ramesh Department of Agronomy Faculty of Agriculture Annamalai University 1
  • 7. Chapter -1 Introduction to Agricultural Meteorology Agricultural Meteorology – definition of meteorology, agro – climatology- weather and climate, factors affecting weather and climate – climate types – scope of Agricultural meteorology, co-ordinates of India and Tamil Nadu – Atmosphere – stratification and composition. Chapter – 2 Solar Radiation and Temperature Solar radiation – light and heat energy – Intensity, Quality, day length and direction of light, effect on crop production, measurement – Temperature effect on crop growth, cardinal temperature, diurnal and season variations, isotherm – soil temperature and effect on crop growth – measurement of temperature Chapter - 3 Atmospheric pressure and wind systems of the world Atmosphere pressure – pressure system – causes for variation, importance, isobar, measurement – Atmospheric humidity – Absolute and specific humidity, vapour pressure, effect on crop growth , measurement. 7
  • 8. Wind systems of world, tropical convergence zones, speed and direction of wind measurement – effect on crops. Chapter – 4 Rainfall and Evaporation Clods, classification and characteristics – precipitation – forms – Hydrological cycle – rainfall – monsoons of India, onset and withdrawal, effect on crop production – measurement of rainfall. Isohyet – artificial rain making – evaporation and transpiration, factors affecting evaporation. Chapter – 5 Weather Aberrations and forecasting Weather aberrations – deficient rainfall (drought), cyclone, anticyclones, hurricane, tornado, storms – effect on agriculture – phenology and bioclimatic law, Agricultural seasons of India – Agroclimatic zones of world, India and Tamil Nadu – weather forecasting – importance. Types – Agrimet observatory – synoptic chart, crop weather calendar – remote sensing and crop weather modelling – agroclimatic normals for field crops – effect of climate and weather on crop production and pest and diseases. 8
  • 10. 10
  • 11. Chapter 1 INTRODUCTION TO AGRICULTURAL METEOROLOGY AND ATMOSPHERE Meteorology The word meteorology was derived from a Greek word “meteoros” means ‘above the earth’s surface’ which is nothing but atmosphere. The meaning of “logy” is a study of science. Therefore, meteorology is defined as a branch of science dealing with that of the atmosphere. Meteorology is concerned with the physical, chemical and dynamical state of the earth’s atmosphere and it’s interaction with the underlying surface. Meteorology is essentially known as observational science dealing with different atmosphere variables such as pressure, temperature, wind, humidity, clouds, and radiation at a given moment. Meteorology predicts the behavior of the atmosphere over a period of a few hours to a few days ahead. The main task of meteorology is to provide weather forecasting and communicate the same in time to the users. Another important duty of the meteorology is to increase our knowledge of the 1
  • 12. atmosphere through research and aiming at the accuracy of weather forecast. Meteorology is a combination of both physics and geography. Meteorology is the science of weather. It is essentially an inter-disciplinary science because the atmosphere, land and ocean constitute an integrated system. The three basic aspects of meteorology are observation, understanding and prediction of weather. There are many kinds of routine meteorological observations. Some of them are made with simple instruments like the thermometer for measuring temperature or the anemometer for recording wind speed. Countries around the world exchange the weather observations through fast telecommunications channels. These are plotted on weather charts and analyzed by professional meteorologists at forecasting centers. Weather forecasts are then made with the help of modern computers and supercomputers. Weather information and forecasts are of vital importance to many activities like agriculture, aviation, shipping, fisheries, tourism, defence, industrial projects, water management and disaster mitigation. Recent advances in satellite and 2
  • 13. computer technology have led to significant progress in meteorology. Agricultural meteorology In simple terms, agricultural meteorology is the application of meteorological information and data for the enhancement of crop yields and reduction of crop losses because of adverse weather. This has linkages with forestry, horticulture and animal husbandry. The agro meteorologist requires not only a sound knowledge of meteorology, but also of agronomy, plant physiology and plant and animal pathology, in addition to common agricultural practices. This branch of meteorology is of particular relevance to India because of the high dependence of our agriculture on monsoon rainfall which has its own vagaries. So, Agricultural meteorology can also be defined as follows:  A branch of applied meteorology which investigates the physical conditions of the environment of growing plants or animal organisms  An applied science which deals with the relationship between weather/climatic conditions and agricultural production 3
  • 14.  A science concerned with the application of meteorology to the measurement and analysis of the physical environment in agricultural systems. The word ‘Agro meteorology’ is the abbreviated form of agricultural meteorology  To study the interaction between meteorological and hydrological factors on the one hand and agriculture in the widest sense, including horticulture, animal husbandry and forestry on the other (WMO, Geneva) Importance to crop production 1. Helps in planning the cropping patterns/systems 2. Selection of sowing dates for optimum crop yields 3. Cost effective ploughing, harrowing, weeding etc 4. Reducing losses of applied chemicals and fertilizers 5. Judicious irrigation to crops 6. Efficient harvesting of all crops 7. Reducing or eliminating outbreak of pests and diseases 8. Efficient management of soils which are formed out of weather action 9. Managing weather abnormalities like cyclones, heavy rainfall, floods, drought etc. This can be achieved by 4
  • 15. (a) Protection: When rain is forecast avoid irrigation. But, when frost is forecast apply irrigation (b) Avoidance: Avoid fertilizer and chemical sprays when rain is forecast (c) Mitigation: Use shelter belts against cold and heat waves 10.Effective environmental protection 11.Avoiding or minimizing losses due to forest fires. Future scope of agricultural meteorology 1. To study climatic resources of a given area for effective crop planning. 2. To evolve weather based effective farm operations 3. To study crop weather relationships for all important crops and forecast crop yields based on agro climatic and spectral indices using remote sensing 4. To study the relationship between weather factors and incidence of pests and diseases of various crops 5. To delineate climatic/agro ecological/agro climatic zones for defining agro climatic analogues so as to make effective and fast transfer of technology for improving crop yields 6. To prepare crop weather diagrams and crop weather calendars 5
  • 16. 7. To develop crop growth simulation models for assessing/obtaining potential yields in different agro climatic zones 8. To monitor agricultural droughts on crop-wise for effective drought management 9. To develop weather based agro advisories to sustain crop production utilizing various types of weather forecast and seasonal climate forecast 10.To investigate microclimatic aspects of crop canopy in order to modify them for increased crop growth 11.To study the influence of weather on soil environment on which the crop is grown 12.To investigate the influence of weather in protected environment (eg. Glass houses) for improving their design aiming at increasing crop production. Divisions of Meteorology Sl. Division Application No. name 1. Dynamic Deals with the forces that meteorology create and maintain motion and the latest transformations associated therewith 2. Physical Deals with physical nature meteorology such as radiation, heat, evaporation, condensation and precipitation 6
  • 17. 3. Climatology Study of weather patterns over time and space 4. Synoptic Deals with analysis and meteorology forecasting of the weather phenomena 5. Aeronautical Application of meteorology to meteorology the problem of aviation 6. Maritime Deals with marine navigation meteorology 7. Agricultural Application of meteorology in meteorology relation to crop production 8. Hydrometeor Deals with meteorological ology problems related to water supply, flood control, irrigation etc. 9. Medical Influence of weather and meteorology climate on the human body 10. Aerology Deals with the conditions of the free atmosphere on the basis of direct observations Coordinates of India and Tamil nadu Coordinates of India Lies between 8º N and 37º N latitude 68ºE and 97º E longitude Coordinates of Tamil Nadu Lies between 08º 05’ N and 13º 35’ N latitude 76º 15’ E and 80º 20’ E longitude The Earth is elliptical in shape and has three spheres Hydrosphere - the water portion 7
  • 18. Lithosphere - the solid portion Atmosphere - the gaseous portion Atmosphere The word atmosphere derives from the Greek word “Atmos” which means vapour and “Sphaira” which means sphere (layers).The atmosphere is defined as the colourless, odourless and tasteless physical mixture of gases which surrounds the earth on all sides. It is mobile, compressible and expandable. It contains huge number of solid and liquid particles called aerosol. Atmosphere is a huge envelope of mixture of gases extending several hundreds of kilometers from earth surface. Some gases are permanent atmospheric constituents in fixed proportions to the total gas volume and others vary from place to place and time to time. Uses of atmosphere 1. Provides oxygen which is useful for respiration in crops 2. Provides carbon-dioxide to build biomass in photosynthesis 3. Provides nitrogen which is essential for plant growth 4. Acts as a medium for transportation of pollen 5. Protects crops plants on earth from harmful UV rays 8
  • 19. 6. Maintains warmth to plant life and 7. Provides rain to field crops as it is a source of water vapour, cloud, etc. Composition of atmosphere (Fig.1) The following all the different gases that are present in percentage by volume approximately. Nitrogen (N2) = 78.08 Oxygen (O2) = 20.95 Argon (Ar) = 0.93 Carbon di oxideCO2 = 0.03 Neon (Ne) = 0.0018 Helium(He) = 0.0005 Ozone(O3) = 0.00004 Hydrogen(H2) = 0.00006 Methane (CH4) = 0.00017 Fig.1 9
  • 20. Fig.2 Vertical Layers of atmosphere based on temperature/Stratification (Fig.2) On the basis of vertical temperature variation the atmosphere is divided into different spheres or layers. A) Troposphere 1. The troposphere is the atmospheric layer closest to the planet and contains the largest percentage (around 80%) of the mass of the total atmosphere. 2. The word “Tropo” means mixing or turbulence and “sphere” means region. 3. The troposphere is approximately 12 kilometers thick, but there are slight variations. The average height of this lower most layer of the atmosphere is about 14 km above the mean sea level; at the equator it is 16 km and 7-8 km at the poles. 4. All weather phenomenon that we are primarily interested like various types of clouds, 10
  • 21. thunderstorms, cyclone and anticyclones occurs in the troposphere because of the concentration of almost all the water vapour and aerosols in it. So, this layer is called as “seat of weather phenomena”. 5. The wind velocities increase with height and attain the maximum at the top of this layer. 7. Another important feature of the troposphere is that as height increases, temperature decreases. The temperature drops about 6.5 ºC for every kilometer above the earth's surface (Lapse rate). 8. Most of the radiation received from the sun is absorbed by the earth’s surface. So, the troposphere is heated from below. 9. In this layer, about 75 per cent of total gases and most of the moisture and dust particles present. 10. The top of the troposphere there is a shallow layer separating it from stratosphere which is known as the “Tropopause “. 11. The upper boundary of the layer Tropopause, ranges in height from 5 miles (8 km) near the poles up to 11 miles (18 km) above the equator. Its height also 11
  • 22. varies with the seasons; highest in the summer and lowest in the winter. B). Stratosphere 1. The stratosphere is the second major strata of air in the atmosphere. It extends above the tropopause (around 20 km onwards) and extends to an altitude of about 30 miles (50 km) above the planet's surface. 2. The air temperature in the stratosphere remains relatively constant up to an altitude of 15 miles (25 km). Then it increases gradually with height until it reaches about 10°C at an altitude of 50 km. 3. Solar energy is converted to kinetic energy when ozone molecules absorb ultraviolet radiation, resulting in heating of the stratosphere. 4. This layer is called as “Seat of photochemical reactions”. 5. Since the stratosphere is not turbulent this is where most planes like to fly. 6. Less convection takes place in the stratosphere because it is warm at the top and cold at the bottom. 7. There is also persistence of circulation patterns and high wind speeds. 12
  • 23. 8. The boundary between the stratosphere and the next layer mesosphere is called the stratopause. C). Mesosphere/Ozonosphere 1. The layer between 50 and 80 km is called as “Mesosphere”. In this layer the temperature decreases with height. 2. There is a maximum concentration of ozone between 30 and 60 km above the surface of the earth and this layer is known as the ozonosphere. 3. A property of the ozone is that it absorbs UV rays. Had there been no layer of the ozone in the atmosphere, the ultraviolet rays might have reached the surface of the earth and no life can exist. 4. The temperature drops in this layer to about -100 ºC. This is the coldest region of the atmosphere. 5. The stratosphere and mesosphere together are sometimes referred to as the middle atmosphere. Because of the preponderance of chemical process this sphere is called as the “chemosphere” 6. The upper boundary of this layer is called the “Mesopause”. 13
  • 24. D). Thermosphere (Ionosphere) 1. The thermosphere layer lies beyond the ozonosphere (mesosphere) at a height of about 80 km above the earth’s surface and extends up to 400 km. The air is very thin. 2. Thermosphere means "heat sphere". The temperature is very high in this layer because ultraviolet radiation is turned into heat. Temperatures often reach 2000°C or more. This increase in temperature is due to the absorption of intense solar radiation by the limited amount of remaining molecular oxygen. 3. The atmosphere in the ionosphere is partly ionised enriched ion zones exist in the form of distinct ionised layers. So, this layer is also called as the ionosphere. Long distance radio communication is possible due to this layer. E). Exosphere 1. The outer most layer of the earth’s atmosphere is named as the exosphere and this layer lies between 400 and 1000 km. The exosphere is the most distant atmospheric region from Earth's surface. 2. The upper boundary can be defined theoretically by the altitude (about 120,000 miles, half the distance to 14
  • 25. the Moon) at which the influence of solar radiation pressure on atomic hydrogen velocities exceeds that of the Earth's gravitational pull. 3. At such a greater height the density of atoms in the atmosphere is extremely low. 4. Hydrogen and Helium gases predominate in this outer most region. 5. At an altitude of about 500 to 600 km the density of the atmosphere becomes so low that collisions between the natural particles become extremely rare. Weather It is defined as a physical state of the atmosphere at a given place and given time or a state or condition of the atmosphere at a given place and at a The daily or short term variations of different conditions of lower air in terms of temperature, pressure, wind, rainfall etc. Weather is highly variable and it changes constantly sometimes from hour to hour and at other times from day to day. The different weather elements are solar radiation, temperature, pressure, wind, humidity, rainfall, evaporation etc. 15
  • 26. Eg: The air temperature of Annamalai nagar on 20.01.2011 at 10.30 a.m. is 31º C. Climate It is defined as the generalized weather or summation of weather conditions over a given region during comparatively longer period. The sum of all statistical information of weather in a particular area during specified interval of time, usually a season or a year or even a decade or long term regime of atmospheric variables of a given place or area. The aspects involved are larger areas like a zone/ a state/ a country and is described as normals. The climatic normals are generally worked out for a period of 30 years. The climatic elements are latitude, longitude and altitude. Eg: In Tamil Nadu the summer temperature ranges from 29ºC to 40º C. Factors affecting climate There are number of factors that affect the climate of a particular place in the World. They are, i) Latitude Latitude controls the amount of solar radiation that reaches the surface of the earth. The distance from the equator, either south or north, largely creates 16
  • 27. variations in the climate. Based on the latitude, the climate has been classified as i) Tropical ii) Sub-tropical iii) Temperate iv) Polar The tropical climate is characterized by high temperature throughout the year. Subtropical is characterized by high temperature alternating with low temperature in winter. The temperate climate has low temperature throughout the year. The polar climate is noted for its very low temperature throughout the year. In general the latitude incease the temperature decrease. ii) Altitude (elevation) The height from the MSL (Mean Sea Level) creates variation in climate. Even in the tropical regions, the high mountains have temperate climate. The temperature decreases by 6.5 ºC/km from the sea level. Generally, there is also a decrease in pressure and increase in precipitation and wind velocity. The above factors alter the kind of vegetation, soil types and the crop production. With increasing altitude the decreasing temperature. iii) Precipitation 17
  • 28. The quantity and distribution of rainfall decides the nature of vegetation and the nature of the cultivated crops. iv) Mountain barriers or Relief: Mountains form a natural barrier that causes air masses to rise. As air is forced to rise it expands as gravity decreases, it becomes less dense and cools. v) Soil type Soil is a product of climatic action on rocks as modified by landscape and vegetation over a long period of time. The colour of the soil surface affects the absorption, storage and re-radiation of heat. White colour reflects while black absorbs more radiation. Hence, where ever black soil type is predominant there will be more absorption of heat and hot climate will exist. vi) Nearness to large water bodies The presence of large water bodies like lakes and sea including its current affect the climate of the surrounding areas, Eg. Islands and coastal areas. The movement of air from earth’s surface and from water bodies to earth modifies the climate. The extreme variation in temperature during summer and winter is minimized in coastal areas and island. 18
  • 29. vii) Topography The surface of landscape (leveled or uneven surface areas) produces marked change in the climate. This involves the altitude of the place, steepness of the slope and exposure of the slope to light and wind. viii) Vegetation Kinds of vegetation characterize the nature of climate. Thick vegetation is found in tropical regions where temperature and precipitation are high. Others factors are Wind and air masses, atmospheric disturbances or storms and oceans currents. Scales of climate and their importance i) Microclimate Microclimate deals with the climatic features peculiar to small areas and with the physical processes that take place in the layer of air very near to the ground which differ sharply from general climatic conditions. ii) Mesoclimate The scale of meso climate falls between micro and macro climates. It is concerned with the study of climate over relatively smaller areas between 10 & 100 km across. 19
  • 30. iii) Macroclimate Macro climate deals with the study of atmosphere over large areas of the earth and with the large scale atmospheric motions that cause weather. The scales of air motion in different climates are given in the Table below. Type of Horizontal Vertical Time climate scale (km) scale(km) Scale (hrs) A. Macro climate 1. 2000-5000& 10 200 to Planetary more 400 scale 2. Synoptic 500-2000 10 100 scale B. Meso 1 to 100 1-10 1-10 climate C. Micro <100m 200 m 6-12 climate minutes If any weather system develops under different types of climate, it persists longer periods under the macroclimate while smaller periods under micro climates. 20
  • 31. Climates of India and Tamilnadu and their characterization Climate classification was tried by many scientists from beginning of 19th century using many parameters. Thornthwaite during 1931 and 1948 classified the climate using precipitation and evaporation /Potential evaporation and was subsequently modified by Mathur (1955) for the Moisture Index (Im) and is given below Im = 100 [(P-PE)/PE] Where P = Precipitation, PE = Potential evapo-transpiration Using the moisture Index (Im) the following classification was made Im Quantity Climate classification 100 and above Per humid 20 to 100 Humid 0 to 20 Moist sub humid -33.3 to 0 Dry sub humid -66.7 to -33.3 Semi arid -100 to -66.7 Arid 21
  • 32. Another classification by Troll (1965) based on number of humid months, said to be of more agricultural use was modified by ICRISAT for India. Humid month is one having mean rainfall exceeding the mean Potential evapo transpiration. Climate Number of % geographical humid months area of India Arid <2.0 17.00 Semiarid- 2.0-4.5 57.17 dry Semiarid- 4.5-7.0 12.31 wet Humid >7.0 1.10 The ICAR under All India Coordinated Research Project on Dryland Agriculture adopted classification based Moisture Deficit Index (MDI) P - PET MDI = --------- x 100 PET Where P is annual precipitation (cm) and PET is Potential Evapotranspiration. Based on MDI the climate is divided into three regions as below. Type of climate MDI Subhumid 0.0 to 33.3 Semiarid -33.3 to -66.6 Arid > -66.6 Koppen classification of climate 22
  • 33. Koppen classified climate into eleven types. They are as follows: Sl.N Name Sl.N Name o. o. 1. Tropical rainforest 7. Humid temperate climate climate 2. Tropical –Savanna 8. Cold climate with Climate moist winter 3. Steppes 9. Cold Climate with Dry Winter 4. Deserts 10. Tundra Climate 5. Warm climate 11. Ice climate with dry winter 6. Warm Climate with dry summer Rainfall based classification The crop regions are classified on the basis of average rainfall which is as follow. Rainfall(mm) Name of the climatic region Less than 500 Arid 500-750 Semi-arid 750-1000 Sub-arid More than 1000 Humid Temperature based classification 23
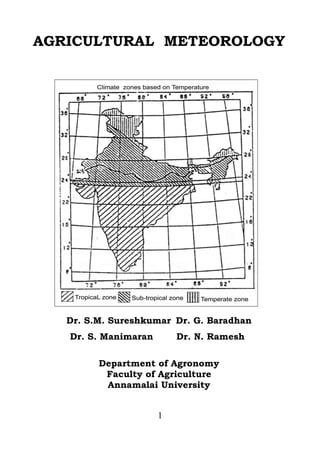
  • 34. The tropic of cancer, which passes through the middle of the country, divides it into two distinct climates. The tropical climate in the South where all the 12 months of the year have mean daily temperature exceeding 20°C; and in the North where a sub-tropical climate prevails. In sub-tropics during the winter months, it is cool to cold. Frosts occur sometime during the months of December and January. Some areas in the Northern India have a temperate climate. Here it snows during the winter months and freezing temperatures may extend to two months or more during the year. Three main climatic zones of India based on temperature are shown in the map below. Chapter 2 Solar Radiation and Temperature 24
  • 35. THE SUN Sun is an ordinary star, nearest to our Earth. The planets and satellites are called the members of the solar system. Sun is the star at the center of the Solar System. All the planets revolve around the Sun in elliptical orbits. Sun is the prime source of energy on Earth and life depends on. The main features of the Sun 1. Diameter of the Sun is 13,92,000 km and its mass about 2 X 1030 kg (3,30,000 times that of Earth) 2. It rotates on its axis about once in every four weeks (27 days near equator & 30 days –polar) 3. The mean distance of the Sun from the Earth is approximately 149.6 million km 4. Sun is the brightest object in the sky 5. Light travels from the Sun to Earth in about 8 minutes and 19 seconds 6. The surface temperature of the Sun is around 5778°K (5505 °C) 7. The interior mass of the Sun has a density of 80 to 100 times that of water 25
  • 36. 8. Every minute, the Sun radiates approximately 56 X 1026 calories of energy 9. Energy is due to the fusion, Hydrogen is transformed to Helium 10. 99% of the energy to biosphere is only from the Sun and the rest one per cent is from stars, lightning discharge. Sun’s radiation reflected from the Moon, re-radiation from the Earth etc., SEASONAL VARIATIONS The primary cause of seasonal extremes on Earth is the 23.5 degree tilt of our planet's spin axis. When the north pole is tilted toward the Sun, northern days are long and the weather is warm. Six months later, as the south pole tilts toward the Sun, the southern hemisphere takes its turn at summer. 26
  • 37. Seasons in the two hemispheres are always reversed. When it is summer in New York, it is winter in Sydney. On a spring day in Paris, autumn leaves are falling in Argentina. The name "equinox" is derived from the Latin aequus (equal) and nox (night). The name “solstice” is derived from the Latin sol (sun) and sistere (to stand still) EQUINOX - when the Sun shines down directly over a planet's equator. Two times of the year when night and day are about the same length. SOLSTICE - when one of the poles is tilted toward the Sun to its maximum extent. The Sun stands still in declination; that is, the apparent movement of the Sun's path north or south comes to a stop before reversing direction. Summer Solstice: The Sun is farthest north and the length of time between Sunrise and Sunset is the longest of the year. Winter Solstice: The Sun is farthest south and the length of time between Sunrise and Sunset is the shortest of the year. An equinox happens each year at two specific moments in time, where the center of the Sun can be 27
  • 38. observed to be vertically overhead, occurring around March 21 and September 23 each year. A solstice is an astronomical event that happens twice each year when the Sun's apparent position in the sky reaches its northernmost or southernmost extremes. From the vernal equinox (March 21), the Earth is moving northward around the Sun towards the summer solstice (June 21), when the Sun is farthest North. The autumnal equinox (September 23), the Earth moving southward towards winter solstice (December 21), the Sun reaches its lowest position in the sky (South). If you live in the Southern Hemisphere, the summer solstice and winter solstice will be reversed. INSOLATION Insolation means Incoming solar radiation. Electromagnetic energy radiated into the space by the Sun. It consists of bands of radiant energy of different wave lengths. Factors affecting insolation 1. The solar constant which depends on a. Energy output of the Sun b. Distance from earth to Sun 2. Transparency of the atmosphere 28
  • 39. 3. Duration of daily sunlight period 4. Angle at which Sun’s noon rays strike the Earth. SOLAR CONSTANT Solar constant is the energy received on a unit area at the outer most boundary of the Earth (atmosphere) surface held perpendicular to the Sun’s direction, at the mean distance between the Sun and the Earth. The rate at which solar wave radiation is received at the top of the atmosphere on a unit surface unit time. • Solar constant is not a true constant. It fluctuates by as much as ± 3% about its mean value depending upon the distance of the Earth from the Sun. • Value is about 2 cal / cm2 / min. (1.92 and 2.02) of the upper atmosphere (cal/cm2= Langley). It is equal to 1370 watts per square meter • 35% of the energy is contributed by U.V. and visible parts and 65% by Infra Red TRANSFER OF HEAT All matter, at a temperature above the absolute zero, imparts energy to the surrounding space. Three processes viz. conduction, convection and radiation are involved in heat flow or heat transfer. 29
  • 40. 1. Conduction Heat transfer through the matter without the actual movement of molecules of the substances or matter. Heat flows from the warmer to cooler part of the body so that the temperatures between them are equalized. Eg. The energy transmission through an iron rod which is made warmer at one end. 2. Convection Processes of transmission of heat through actual movement of molecules of the medium. This is predominant form of energy transmission on the earth as all the weather related processes involve this process. Eg. Boiling of water in a vessel. 3. Radiation Transfer of energy from one body to another without the aid of the material medium (solid, liquid or gas). Radiation is not a heat, only when radiation is absorbed by surface of a body heat is produced. Eg. The energy transmission through space from the Sun to the Earth. 30
  • 41. SOLAR RADIATION The flux of radiant energy from the Sun is solar radiation. Heavenly bodies emit – short wave radiation Near surfaces including earth emit - long wave radiation Importance of Solar Radiation on Crops 1. From germination of seeds to harvesting and even post harvest processes are affected by solar radiation 2. Solar radiation provides energy for • All the phenomena related to biomass production • All photosynthetic processes • All physical processes taking place in the soil, the plant and their environment 3. Solar radiation controls the distribution of temperature thereby distribution of crops into different regions. Radiation flux The amount of radiant energy emitted, received, transmitted across a particular area is known as radiant flux. Radiant flux density 31
  • 42. The radiant flux divided by the area across which the radiation is transmitted is called radiant flux density. Emissive power The radiant flux density emitted by a source is called its emissive power. Energy measurement Units Cal cm-2 J cm-2 mi-1 W cm-2 min-1 Cal cm-2 1 4.1868 0.069 min-1 J cm-2 mi-1 0.238 1 0.00165 W cm-2 14.3 60.6 1 Where, J – Joule; W – Watt. SOLAR SPECTRUM Radiation energy is transmitted in the form of electromagnetic waves by the Sun. The energy from the Sun is spread over a very broad band of wavelengths known as solar spectrum. It is also known as electromagnetic spectrum. The spectrum is the combination of different wavelengths. Eg. U.V. rays, visible light, I.R.rays etc. 32
  • 43. Different Bands in Solar Spectrum Wavele % of Spectr Band ngth Importance Ener um (µ) gy 1.Ultra Cosmic Shorter wave < 0.005 violet rays lengths of Gamma spectrum & rays 0.005 – Chemically and X- 0.20 active, unless 9% rays filtered there is Ultra danger of life on 0.20 – Violet earth 0.39 rays 0.39 – Visible spectrum Violet 0.42 known as Light 0.42 – essential for all Blue 0.49 plant processes 0.49 – Green 2.Visib 0.54 41% le 0.54 – Yellow 0.59 0.59 – Orange 0.65 0.65 – Red 0.76 Essential for 3.Infra Infrared thermal energy > 0.76 50% red rays of the plant (Source of heat) Units of measurements of wavelength 33
  • 44. Micron (µ) = 10-6 m = 10-4 cm Milli micron (mµ) = 10-9 m = 10-7 cm Angstrom (Å) = 10-10 m = 10-8 cm Solar radiation and crop plants Crop production is exploitation of solar radiation; the three broad spectrums are, 1. Shorter than visible range: Chemically very active • When plants are exposed to this radiation the effects are detrimental • Atmosphere acts as regulator for this radiation and none of cosmic, Gamma and X-rays reaches to the earth • The UV rays of this segment reaching to the earth are very low and it is normally tolerated by the plants 2. Visible spectrum: Light • Between UV & IR radiation and also referred as light • All plant parts are directly or indirectly influenced by the light 34
  • 45. Intensity, quality and duration are important for normal plant growth • Poor light leads to plant abnormalities • Light is indispensable to photosynthesis • Light affect the production of tillers, the stability, strength and length of culms • It affects the yield, total weight of plant structures, size of the leaves and root development • It affects the flowering and fruiting and dormancy of the seed 3. Higher than visible wavelength: Source of heat • Referred to IR radiation • It has thermal effect on plants • In the presence of water vapour, this radiation does not harm plants, rather it supplies the necessary thermal energy to the plant environment Effect of solar radiation on crop plants S.N Band Specific effect on plant o. Wavelengt h (µ) No specific effect on plant Radiation activity such as bio-chemical 1. within 1.0 and photochemical processes. and more Radiations are transformed into heat 2. 1.0 - 0.72 Radiation in this band helps in 35
  • 46. plant elongation activity This light is strongly absorbed by 0.72 – chlorophylls. It generates strong 3. 0.61 photosynthetic and photo- periodic activity Absorption in this region has low 0.61 – 4. photosynthetic effectiveness and 0.51 weak formative activity It is the strongest chlorophyll and yellow pigment absorption 0.51 – 5. region. Very strong on 0.40 photosynthetic activity and effect on formation of tissues Produces formative effects. It has 0.40 – 6. dwarfing effect on plants and 0.32 thickening effect on plant leaf 0.32 – Detrimental effect on most 7. 0.28 plants Lethal effects most of the plants Less than 8. get killed UV ranges have 0.28 germicidal action Absorption, Reflection and Transmission A part of the incident radiation on the surface is absorbed, while a part is reflected and the remaining is transmitted. Absorptivity Absorptivity of a substance is defined as the ratio of the amount of radiant energy absorbed to the total amount incident upon that substance. The 36
  • 47. absorptivity of a blackbody is unity. Natural bodies like Sun and Earth are near perfect black bodies. Reflectivity Reflectivity is defined as the ratio of the radiant energy reflected to the total incident radiation upon that surface. If it is expressed in percentage it becomes albedo. Transmittivity Transmittivity is defined as ratio of the transmitted radiation to the total incident radiation upon the surface. Emissivity Emissivity is defined as the ratio of the radiant energy emitted by a given surface to the total heat energy emitted by a black body. The emissivity of a black body is unity. Blackbody radiation A Blackbody is defined as a body, which completely absorbs all the heat radiations falling on it without reflecting and transmitting any of it. It means reflectivity and transmittivity become zero. When such a black body is heated it emits radiation of all wavelengths depending upon its temperature. 37
  • 48. ALBEDO It is the percentage of reflected radiation to the incident radiation (varies with colour and composition of the Earth’s surface, season, angle of the Sun rays). Value is Highest in winter and at Sunrise and Sunset. Pure water 5-20%, Vegetation 10-40%, dark soils 5-10%, desert soil 25-30%, snow 45-90% and clouds 5-85%. High albedo indicates that much of the incident solar radiation is reflected rather than absorbed. Depends up on 1. Angle of incidence of radiation. Albedo increase with decreasing elevation of sun with minimum during noon 2. Physical characteristics of surface 3. Season 4. Time of the day For plant community albedo depends upon 1. Age of the crop 2. Percentage of ground cover 3. Colour and reflectivity of the foliage Radiation balance The difference between all incoming and outgoing radiation at the earth’s surface and top of the 38
  • 49. atmosphere is known as radiation balance at the earth’s surface. Temperature It is defined as the measure of the average speed of atoms and molecules Kinetic energy Energy of motion. Heat It is the aggregate internal energy of motion and molecules of a body. It is often defined as energy in the process of being transferred from one object to another because of the temperature between them. Sensible heat It is the heat that can be measured by a thermometer and thus sensed by humans. Normally measured in Celsius, Fahrenheit and Kelvin. Latent heat It is the energy required to change a substance to a higher state of matter. This same energy is released on the reverse process. Change of state through Evaporation and condensation is known as latent heat of evaporation and latent heat of condensation. From water to water 39
  • 50. vapour takes 600 calories and water to ice takes 80 calories. Disposition of Solar radiation • 25% of solar radiation is reflected back to the space by clouds (more by middle and high latitudes and less in the sub tropics) • 6% reflected back by air, dust and water vapour. • 30% scatted downwards (more in the form of shorter wavelengths than that in longer wave length (red)). • 17% of solar radiation is absorbed by the atmosphere. (Mostly by Oxygen, O3, CO2 & H2O vapour). O2 – absorb the extreme UV wavelengths (0.12 to 0.6 µ) O3 – UV (0.2 to 0.32 µ) and Visible part of radiation (0.44 to 0.7 µ) H2O vapour – Near infra red (0.93, 1.13, 1.42 µ) CO2 - IR band 2.7 µ. • About 50% of solar radiation reaches earth’s surface, after reflection, scattering and absorption. LIGHT 40
  • 51. Light is the visible portion of the solar spectrum with wavelength range is from 0.39 to 0.76μ. Light is one of the important climatic factors for many vital functions of the plant. Functions of Light • It is essential for the synthesis of the most important pigment ie. Chlorophyll, Chlorophyll absorbs the radiant energy and converts it into potential energy of carbohydrate (photosynthesis). • The carbohydrate thus formed is the connecting link between solar energy and living world. • In addition, it regulates the important physiological functions. - Effects tiller production, stability, strength and length of culms - Effects dry matter production - Effects the size of the leaves and root development - Effects the flowering, fruiting and dormancy of the seed Characteristics of Light The characteristics of light viz. intensity, quality, duration and direction are important for crops. 1. Light intensity 41
  • 52. The intensity of light is measured by comparing with a standard candle. The amount of light received at a distance of one meter from a standard candle is known as “Meter candle or Lux”. The light intensity at one foot from a standard candle is called “foot candle” or 10.764 luxes. - Very low light intensity reduces the rate of photosynthesis resulting in reduced growth. - Similarly, very high intensity is detrimental to plant in many ways as below. - It increases the rate of respiration. - It also causes rapid loss of water (i.e.) increases the transpiration rate of water from the plants. - The most harmful effect of high intensity light is that it oxidises the cell contents which is termed as ‘Solarisation’. This oxidation is different from respiration and is called as photo-oxidation. • Under field conditions the light is not spread evenly over the crop canopy but commonly passed by reflection and transmission through several layers of leaves. • The intensity of light falls at exponential rate with path length through absorbing layers according to Beer’s 42
  • 53. law. i.e. the relative radiation intensity decreases exponentially with increasing leaf area. • At ground level the light intensity is below the light compensation point (The light intensity at which the gas exchange resulting from photosynthesis is equal to that resulting from respiration) Based on the response to light intensities the plants are classified as follows. (i) Sciophytes (shade loving plants) The plants grow better under partially shaded conditions. Eg. Betel vine, buck wheat etc. (ii) Hetrophytes (Sun loving) Many species of plants produce maximum dry matter under high light intensities when the moisture is available at the optimum level. Eg. Maize, sorghum, rice etc. 2. Quality of Light When a beam of white light is passed through a prism, it is dispersed into wavelengths of different colours. This is called the visible part of the solar spectrum (VIBGYOR 0.39 – 0.76 µ). 43
  • 54. The principal wavelength absorbed and used in photosynthesis are in the violet – blue and the orange - red regions. • Among this, short rays beyond violet such as X rays, gamma rays and larger rays beyond red such as infrared, are detrimental to plant growth. • Red light is the most favourable light for growth followed by violet – blue. • Red light helps mature apples to turn red, induces germination and suppresses elongation of stem. • Blue and green lights inhibit germination of seeds. • Ultra – violet and shorter wave lengths kill bacteria and many fungi (Germicidal effect). 3. Duration of light: • The duration of light has greater influence than the intensity for canopy development and final yield. • It has a considerable importance in the selection of crop varieties. • The response of plants to the relative length of the day and night is known as “photoperiodism”. The plants are classified based on the extent of response to day length which is as follows. (i) Long day plants 44
  • 55. The plants which develop and produce normally when the photoperiod is greater than the critical minimum (more than 10 hours). Eg. Potato, Sugar beet, Wheat, Barley, Oats etc. (ii) Short day plants The plants which develop normally when the photoperiod is less than the critical maximum (less than 10 hours). Eg. Rice, Sorghum, Cotton, Sunflower, Cucumber etc. (iii) Day neutral plants / Indeterminate Those plants which are not affected by photoperiod. Eg. Tomato, Maize etc. • The photoperiodism influences the plant character such as floral initiation or development, bulb and rhizome production etc. • In long day plant, during periods of short days, the growth of internodes are shortened and flowering is delayed till the long days come in the season. Similarly when short day plants are subjected to long day periods • The varying photoperiodicity of plants is a very important factor in crop rotation which helps not only 45
  • 56. in operational nutrient management but also in disease eradication. • The choice of varieties and cultivars in newly cultivated areas depend on duration of light. 4. Direction of light • The direction of sunlight has a greater effect on the orientation of roots and leaves. • In temperate regions, the southern slopes plants produce better growth than the northern slopes due to higher contribution of sunlight in the southern side. • The change of position or orientation of organs of plants caused by light is usually called as “phototropism” i.e. the leaves are oriented at right angles to incidence of light to receive maximum light radiation. Photomorphogenesis Change in the morphology of plants due to light. This is mainly due to U.V and violet ray of the Sun. Factors Affecting the Distribution of Solar Radiation within the Plant Canopy 1. Type of Plants a. The leaves of cereal crops like paddy, wheat etc. have a transmissivity from 5 to 10 per cent. 46
  • 57. b. The broad leaves of ever green plants have lower value of 2 to 8 per cent. 2. Age of the Leaves The transmissivity of younger leaves is more as compared to older leaves. 3. Chlorophyll Content As the chlorophyll content increases the value of transmissivity decreases. 4. Arrangement of Leaves a. The relative light interception by horizontal and erect foliage is 1:0.44 b. When the leaf area index is one (1) the light transmissivity of more upright leaves is 74 % as against 50 % for horizontal leaves. 5. Angle of Leaves a. In full sunlight, the optimum inclination for efficient light use is 81°. The leaf placed at the optimum inclination is 4 – 5 times as efficient in using light as a horizontal leaf. c. The ideal arrangement of leaves is that the lowest leaves lay at angles between 0° to 30° to be horizontal (13 % ), the adjoining leaves lay at 30° to 60° (37 % ) and the upper leaves lay at 60° to 90°(50 % ). 47
  • 58. 6. Plant Density In sparse crop stands not only the per cent of light transmissivity is more but it is also variable with the time of the day. In dense crop canopies the light transmissivity is less. 7. Plant Height When the plant height increases the transmissivity of light by the canopy decreases. 8. Angle of the sun a. The highest radiation penetration also occurs at noon. b. Relatively high radiation penetration also occurs both in the morning as well as before the sunset due to high proportion of diffuse light. Instruments to measure Solar Radiation 1. Pyranometer: Total short wave radiation or components on a horizontal plain surface from hemispherical sky. 2. Net pyranometer or solarimeter: Net short wave radiation in W m-2. 3. Pyrradiometer: Global or total radiation from sky on a horizontal surface in W m-2. 4. Net pyrradiometer or net radiometer: Net short wave and long wave radiation in W m-2. 48
  • 59. 5. Pyrheliometer: Direct solar beam on a plane surface at normal incidence in W m-2. 6. Pyrgeometer: Net infrared radiation of the atmosphere in W m-2. 7. Luxmeter or Photometric sensors: The brightness (intensity) is measured in foot candles or lux. 8. Photometer or light meter: Measured the light. 9. Sunshine shine recorder: The number of hours of bright sunshine is recorded. AIR TEMPERATURE Temperature is defined as, “The measure of speed per molecule of all the molecules of a body”. Whereas heat is, “the energy arising from random motion of all the molecules of a body” (Degree of molecular activity). It is the intensity aspect of heat energy. Temperature is a measure of “the average energy of the molecules of a body”, whereas heat is a measure of “the total amount of thermal energy in a body”. For example, the temperature of a cup of boiling water is the same as that of a large pot of boiling water (212°F, or 100°C), the large pot has more heat, or thermal energy, and it takes more energy to boil a pot of water than a cup of water. 49
  • 60. In meteorology, the temperature of the atmosphere which represents the average kinetic energy of the molecular motion in a small region and is defined in terms of a standard or calibrated thermometer in thermal equilibrium with the air. • The degree of hotness or coldness of a body or environment. HEAT TRANSFER Conduction Heat transfer when two bodies of unequal temperatures come into contact. Heat passes from point to point by means of adjacent molecules. Convection Transfer through movement of particles (part of mass) in fluids and gasses. These are able to circulate internally and distribute heated part of the mass. Radiation It is the process of transmission of energy by electromagnetic waves between two bodies without the necessary aid of an intervening material medium. Role of temperature in crop production: 1. Temperature influences distribution of crop plants and vegetation. 50
  • 61. 2. The surface air temperature is one of the important variables, which influences all stages of crop during its growth development and reproductive phase. 3. Air temperature affects leaf production, expansion and flowering. 4. The diffusion rates of gases and liquid changes with temperature. 5. Solubility of different substances is dependent on temperature. 6. Biochemical reactions in crops (double or more with each 10°C rise) are influenced by air temperature. 7. Equilibrium of various systems and compounds is a function of temperature. 8. Temperature affects the stability of enzymatic systems in the plants. 9. Most of the higher plants grow between 0°C – 60°C and crop plants are further restricted from 10 – 40°C, however, maximum dry matter is produced between 20 and 30°C 10.At high temperature and high humidity, most of the crop plants are affected by pests and diseases. 11.High night temperature increases respiration and metabolism. 51
  • 62. 12. Most of the crops have upper and lower limits of temperature below or above which, they may not come up and an optimum temperature when the crop growth is maximum. These are known as “cardinal temperatures” and different crops have different temperatures. Sl Crop Minimum Optimum Maximum No 1 Wheat and 0–5 25 – 31 31 – 37 Barley 2 Sorghum 15 – 18 31 – 36 40 – 42 Factors affecting air temperature  Latitude  Altitude  Distribution of land and water  Ocean currents  Prevailing winds  Cloudiness  Mountain barriers  Nature of surface  Relief  Convection and turbulence etc. 1. Latitude 52
  • 63. The time of occurrence of maximum monthly mean temperature and minimum monthly mean temperature also depends on latitude of a place. (Eg.) The coldest month is January in northern regions of India while December in the south. Similarly, the warmest month is May in the south while June in the north across the country. 2. Altitude The surface air temperature decreases with increasing altitude from the mean sea level as the density of air decreases. Since the density of air is less at higher altitudes, the absorbing capacity of air is relatively less with reference to earth’s long wave radiation. 3. Distribution of land and water Land and water surfaces react differently to the insolation. Because of the great contrasts between land and water surfaces their capacity for heating the atmosphere varies. The differential heating process between land and sea surfaces are due to their properties. It is one of the reasons for Indian monsoon. 4. Ocean currents The energy received over the ocean surface carried away by the ocean currents from the warm areas 53
  • 64. to cool areas. This results in temperature contrast between the equator and poles. The occurrence of El- Nino is due to change in sea surface temperature between two oceanic regions over the globe. 5. Prevailing winds Winds can moderate the surface temperature of the continents and oceans. In the absence of winds, we feel warm in hot climates. At the same time, the weather is pleasant if wind blows. 6. Cloudiness The amount of cloudiness affects the temperature of the earth’s surface and the atmosphere. A thick cloud reduces the amount of insolation received at a particular place and thus the day time temperature is low. At the same time, the lower layers in the atmosphere absorb earth’s radiation. This results in increasing atmospheric temperature during night. That is why, cloudy nights are warmer. This is common in the humid tropical climates. 7. Mountain barriers Air at the top of the mountain makes little contact with the ground and is therefore cold while in the valley at the foothills makes a great deal of contact and is 54
  • 65. therefore warm. That is, the lower region of the earth’s atmosphere is relatively warmer when compared to hillocks. 8. Nature of surface 9. Relief In the northern hemisphere north facing slopes generally receive less insolation than south facing slopes and temperature are normally lower. 10. Convection and turbulence etc. Diurnal and Seasonal Variation of Air Temperature • The minimum air temperature occurs at about sunrise, after which there is a constant rise till it reaches to maximum. • The maximum air temperature is recorded between 13.00 hrs and 15.00 hrs although the maximum solar radiation is reaches at the noon. • A steady fall in temperature till sunrise is noticed after is attains maximum. Thus the daily displays one maximum and one minimum. The difference between the two is called the diurnal range of air temperature. • The diurnal range of air temperature is more on clear days while cloudy weather sharply reduces daily amplitudes. 55
  • 66. The diurnal range of temperature is also influenced by soils and their coverage in addition to seasons. • Addition of daily maximum and minimum temperature divided by two is nothing but daily mean / average temperature. Temperature Distribution Each day the earth receives energy in the form of incoming solar radiation from the sun. There are three temperature distributions viz., horizontal, vertical and periodic distributions that are observed on earth. 1. Horizontal air temperature distribution Sun rays make different angles at the same place at different times. Due to the variation in angle of sun’s rays, distribution of solar heat on earth decreases both ways from equator to poles. This is known as horizontal distribution of air temperature. On maps, the horizontal distribution of air temperature is shown by isotherms. The isotherms are imaginary lines drawn connecting points of equal temperature. Horizontal distribution of air temperature influenced by,  Latitude 56
  • 67. A general decrease in temperature from equator towards poles is one of the most fundamental factors of climatology.  Land and water Irregular distribution of land and water on earth’s surface breaks the latitudinal variation in temperature. Land areas warm and cool rapidly than water bodies.  Mountain barriers Influence horizontal distribution of temperature by restricting movement of air masses. Eg. Himalayas protect India from polar air.  Topography On local scale topographic relief exerts an influence on temperature distribution. In northern hemisphere north facing slopes receive less insolation than south facing slopes and temperatures are normally lower. 2. Vertical air temperature distribution The decrease in temperature with increase in height (altitude) is known as vertical temperature distribution. Eg. Permanent snow caps in high mountains. 3. Periodical temperature distribution 57
  • 68. The air temperature changes continuously during a day or a year.  Maximum insolation is received around noon (12.00 hr) at maximum temperature is recorded from 1 p.m. to 3 p.m. and delay is known as thermal lag.  In northern hemisphere winter minimum occurs in January and summer maximum in July. Temperature and Climatic Zones The climatic zones of the earth are:  Tropical  Sub – tropical  Temperate  Alpine These zones are differentiated on the basis of temperature. The tropical zone is a hot winterless zone; sub-tropical zone is a hot zone with a cool winter; temperate zone is with a warm summer and pronounced winter; and the alpine zone has a short summer and a long severe winter (Himalayas, Tibetan Plateau). Temperature inversion Occasionally at some altitude the temperature abruptly increases instead of decreasing. This condition 58
  • 69. in which this “abrupt rise instead of fall in temperature occurs in the air” is known as the temperature inversion. This may occurs under the following conditions.  When the air near the ground cools off faster than the overlying layer, because of heat loss during cooling nights.  When an actual warm layer passing over a lower cold layer  Cold air from hill tops and slopes tend to flow downward and replaced by warm air Significance of Temperature inversion  Cloud formation, precipitation and atmospheric visibility are greatly influenced by inversion phenomenon  Impurities like smoke, dust, etc., are confined to lower layers  Fog formation may take place near the ground which may affect the visibility to both human beings and animals. Affects air navigation.  Diurnal temperature (day and night) is affected by temperature inversions.  The incoming solar radiation and its conversion into heat is affected. 59
  • 70. Heat Units It is a measure of relative warmth of growing season of a given length. Normally it is indicated as “Growing Degree Days” (GDD) or “thermal units” or “effective heat units” or “growth units”. A heat unit is the departure from the mean daily temperature above the minimum threshold temperature. The growth of plants is dependent on the total amount of heat to which it is subjected during its life time. The minimum threshold temperature is the temperature below which no growth takes place. Usually ranges from 4.5 to 12.5 ºC for different crops (tropical crop 10ºC). Degree Day Concept A degree day is obtained by subtracting the threshold temperature from daily mean temperature. Summation of the daily values over the growth period gives degree days of the crops. Tmax + Tmin GDD = Σ ------------------- - Tb 2 Where 60
  • 71. Tmax – Maximum air temperature of the day Tmin – Minimum air temperature of the day Tb - Base temperature of the crop The base temperature is the threshold temperature. Advantages / Importance of growing degree Day Concept • In guiding the agricultural operations and planting land use. • To forecast crop harvest dates, yield and quality • In forecasting labour required for agricultural operations • Introduction of new crops and new varieties in new areas • In predicting the likelihood of successful growth of a crop in an area. Air Temperature and Plant Injury The injury to crop plants by air temperature is by both low and high air temperatures. Thermal death point The temperature at which the plant cell gets killed when the temperature ranges from 50-60°C. This varies 61
  • 72. with plant species. The aquatic and shade loving plants are killed at comparatively lower temperature (40°C). I. High Temperature Injury - results in desiccation of plants - disturbs the physiological activities like photosynthesis and respiration - increases respiration leading to rapid depletion of reserve food. 1. Sun clad Injury caused on the barks of stem by high temperature during day time and low temperature during the night time. 2. Stem griddle The stem at ground level scorches around due to high soil temperature. It causes death of plant by destroying conductive tissues. Eg. This type of injury is very common in young seedlings of cotton in sandy soil when soil temperature exceeds 60°C. II. Low Temperature (COLD) Injury 62
  • 73. The primary effect of low air temperature below that optimum temperature is the reduction of rates of growth and metabolic processes. (i) Suffocation In temperature regions, usually during the winter season, the ice or snow forms a thick cover on the soil surface. As a result, the entry of oxygen is prevented (deficient oxygen) and crop suffers for want of oxygen. Ice coming in contact with the root prevents the diffusion of CO2 outside the root zone. This prevents the respiratory activities of roots leading to accumulation of harmful substances. (ii) Heaving This is a kind of injury caused by lifting up of the plants along with soil from its normal position. This type of injury is commonly seen in temperate regions. The presence of ice crystals increases the volume of soil. This causes mechanical lifting of the soil. (iii) Chilling injury Plants which are adapted to hot climate, if exposed to low temperature (0 to 10°C) for sometime, are found to be killed or severely injured or development of chloratic condition (yellowing) (Eg.) chloratic bands on the leaves 63
  • 74. of sugarcane, sorghum and maize in winter months when the night temperature is below 20°C. (iv) Freezing injury This type of injury is commonly observed in plants of temperate regions. When the plants are exposed to very low temperature, water freezes into ice crystals in the intercellular spaces of plants. The protoplasm of cell is dehydrated resulting in the death of cells. (Eg.) Frost damage in potato, tea etc. Thermo periodic response Response of living organism to regular changes in temperature either day or night or seasonal is called thermoperiodism. Instruments to measure the air temperature 1. Maximum Thermometer: To record the maximum temperature in a day. 2. Minimum Thermometer: To record the minimum temperature in a day 3. Dry bulb Thermometer: To record the temperature at a time. 4. Wet bulb Thermometer: To record the temperature at a time under wet condition. 64
  • 75. 5. Thermograph: To record the temperature in a day (continuous recording on a chart). SOIL TEMPERATURE Soil thermal properties are strongly influenced by the soil volumetric water content, volume fraction of solids and volume fraction of air. Air is a poor thermal conductor and reduces the effectiveness of the solid and liquid phases to conduct heat. While the solid phase has the highest conductivity it is the variability of soil moisture that largely determines thermal conductivity. Temperature variations are most extreme at the surface of the soil and these variations are transferred to sub surface layers but at reduced rates as depth increases. Additionally there is a time delay as to when maximum and minimum temperatures are achieved at increasing soil depth (sometimes referred to as thermal lag). The temperature of the soil is an indicator of the energy needed to sustain the normal activity of plants and soil organisms. The soil temperature is one of the most important factors that influence the crop growth. Temperature can have a profound impact on the success of seed germination, root and shoot growth, nutrient 65
  • 76. uptake, crop growth and micro organisms live in the soil. The physio-chemical as well as life processes are directly affected by the temperature of the soil. Under the low soil temperature conditions nitrification is inhibited and the intake of water by root is reduced. In a similar way extreme soil temperatures injures plant and its growth is affected. Eg. On the sunny side, plants are likely to develop faster near a wall that stores and radiates heat. If shaded by the wall, however, the same variety may mature later. In such cases soil temperature is an important factor. Importance of Soil Temperature on Crop Plants The soil temperature influences many process. 1. Governs uptake of water, nutrients etc needed for photosynthesis. 2. Controls soil microbial activities and the optimum range is 18-30°C. 3. Influences the germination of seeds and development of roots. 4. Plays a vital role in mineralization of organic forms of nitrogen.(increases with increases in temperature) 5. Influences the presence of organic matter in the soil (more under low soil temperature) 66
  • 77. 6. Affects the speed of reactions and consequently weathering of minerals. 7. Influences the soil structure (types of clay formed, the exchangeable ions present, etc.) Factors Affecting Soil Temperature Heat at ground surface is propagated downward in the form of waves. The amplitude deceases with depth. Both meteorological and soil factors contribute in bringing about changes of soil temperature. I) Meteorological Factors 1. Solar Radiation a) The amount of solar radiation available at any given location and point of time is directly proportional to soil temperature. b) Even though a part of total net radiation available is utilised in evapotranspiration and heating the air by radiation (latent and sensible heat fluxes) a relatively substantial amount of solar radiation is utilized in heating up of soil (ground heat flux) depending up on the nature of surface. c) Radiation from the sky contributes a large amount of heat to the soil in areas where the sun’s rays have to penetrate the earth’s atmosphere very obliquely. 67
  • 78. 2. Wind Air convection or wind is necessary to heat up the soil by conduction from the atmosphere. (Eg.) The mountain and valley winds influence the soil temperature. 3. Evaporation and Condensation a) The greater the rate of evaporation the more the soil is cooled. This is the reason for coolness of moist soil in windy conditions. b) On the other hand whenever water vapour from the atmosphere or from other soil depths condenses in the soil it heats up noticeably. Freezing of water generates heat. 4. Rainfall (Precipitation) Depending on its temperature, precipitation can either cool or warm the soil. II. Soil Factors 1. Aspect and Slope a) In the middle and high latitudes of the northern hemisphere, the southern slopes receive more insolation per unit area than the northern exposure. b) The south west slopes, are usually warmer than the south east slopes. The reason is that the direct beam 68
  • 79. of sunshine on the south east slope occur shortly after prolonged cooling at night, but the evaporation of dew in the morning also requires energy. 2. Soil Texture a) Because of lower heat capacity and poor thermal conductivity, sandy soils warm up more rapidly than clay soils. The energy received by it is concentrated mainly in a thin layer resulting in extraordinary rise in temperature. b) Radiational cooling at night is greater in light soils than in heavy soils. In the top layer, sand has the greatest temperature range, followed by loam and clay. c) The decrease of range with depth is more rapid in light soils than heavy soils when they are dry but slower when they are wet. d) A soil with rough surface absorbs more solar radiation than one with a smooth surface. 3. Tillage and Tilth a) By loosening the top soil and creating a mulch, tillage reduces the heat flow between the surface and the sub soil. 69
  • 80. b) Since, the soil mulch has a greater exposure surface than the undisturbed soil and no capillary connection with moist layers below, the cultivated soil dries up quickly by evaporation, but the moisture in the sub- soil underneath the dry mulch is conserved. c) In general soil warms up faster than air. The diurnal temperature wave of the cultivated soil has a much larger amplitude than that of the uncultivated soil. d) The air 2-3 cm above the tilled soil is often hotter (10°C or above) than that over an untilled soil. e) At night loosened ground is colder and more liable to frost than the uncultivated soil. 4. Organic matter a) The addition of organic matter to a soil reduces the heat capacity and thermal conductivity. But, the water holding capacity increases. b) The absorbtivity of the soil increases because of the dark colour of the organic matter. c) At night, the rapid flow of heat from sub-soil by radiation is reduced with the addition of organic matter because of its low thermal conductivity. d) The darker the colour, the smaller the fraction of reflected radiation. 70
  • 81. e) The dark soils and moist soils reflect less than the light coloured and dry soils. 5. Soil moisture a) Moisture has an effect on heat capacity and heat conductivity. b) Moisture at the soil surface cools the soil through evaporation. c) Therefore, a moist soil will not heat up as much as a dry one. d) Moist soil is more uniform in temperature throughout its depth as it is a better conductor of heat than the dry soil. Variations in soil temperature There are two types of soil temperature variations; daily and seasonal variation of soil temperature 1. Daily variations of soil temperature a) These variations occur at the surface of the soil. b) At 5 cm depth the change exceeds 10°C. At 20 cm the change is less and at 80 cm diurnal changes are practically nil. c) On cooler days the changes are smaller due to increased heat capacity as the soils become wetter on these days. 71
  • 82. d) On a clear sunny day a bare soil surface is hotter than the air temperature. e) The time of the peak temperature of the soil reaches earlier than the air temperature due to the lag of the air temperature. f) At around 20 cm in the soil the temperature in the ground reaches peak after the surface reaches its maximum due to more time the heat takes to penetrate the soil. The rate of penetration of heat wave within the soil takes around 3 hours to reach 10 cm depth. g) The cooling period of the daily cycle of the soil surface temperature is almost double than the warming period. h) Undesirable daily temperature variations can be minimised by scheduling irrigation. 2. Seasonal variations of soil temperature: a) Seasonal variations occur much deeper into the soil. b) When the plant canopy is fully developed the seasonal variations are smaller. c) In winter, the depth to which the soil freezes depends on the duration and severeness of the winter. 72
  • 83. d) In summer the soil temperature variations are much more than winter in tropics and sub tropics. Daily and monthly variation of soil temperature 73
  • 84. Measurement of soil temperature Soil thermometer: To measure the earth temperature at shallow depth. Units of Measurements In Agro meteorology the two basic scales of temperature used are: a. Centigrade °C b. Fahrenheit °F Relationship between °C and °F is 1. °F = °C x 9/5 + 32 2. °C = (F- 32) x 5/9 In meteorology for upper air temperature measurements the absolute scale °A. °A = 273 + °C. 74
  • 85. Chapter - 3 ATMOSPERIC PRESSURE AND WIND SYSTEMS OF THE WORLD Pressure is defined as the force per unit area. The atmospheric pressure is the weight of the air column per unit area, above the earth surface extending to the limits of the atmosphere. The earth’s atmosphere weighs about 60,000 billion tones. At sea level, it exerts a pressure of about 1 kg/cm2. It is expressed in millibar (mb) (1000 millibar = 1 bar = 1 million dynes per square centimeter). The average pressure over the earth’s surface at sea level is 1013.25 millibar, equivalent to the weight of a column of 76.0 cm (30 inches) (1cm of Hg =13.33mb) of mercury at 0º Celsius or to a weight of air of 1033.3 gram per square cm. Unequal heating of the earth and its atmosphere by the sun and rotation of the earth bring about differences in atmospheric pressure. Air pressure can tell us about what kind of weather to expect as well. If a high pressure system is on its way, often you can expect cooler temperatures and clear skies. If a low pressure system is coming, then look for warmer weather, storms and rain. 75
  • 86. Isobars (Greek word “isos” – equal and “baros” – weight) The distribution of pressure is represented on maps by ‘isobars’. Isobars are defined as the imaginary lines drawn on a map to join places having the same atmospheric pressure. Measuring Atmospheric Pressure Any instrument that measures air pressure is called a barometer. The first measurement of atmospheric pressure began with a simple experiment performed by Evangelista Torricelli in 1643. The most common type barometer used are aneroid barometer and mercury barometer. Pressure systems of the world The shape of the earth is not uniform and subjected to uneven distribution of solar radiation, when it revolves around the sun. The uneven distribution of solar radiation over different regions of the globe leads to contrast in surface air temperature. This results in variations of surface atmospheric pressure systems, which are known as standard atmospheric pressure systems / belts. There are altogether seven alternating 76
  • 87. low and high pressure belts on the earth’s surface. They are as follows:  Equatorial trough of low pressure (between 5°N and 5°S)  Subtropical high pressure belt (Northern hemisphere) (25° and 35°N)  Subtropical high pressure belt (Southern hemisphere) (25° and 35°S)  Subpolar low pressure belt (Northern hemisphere) (60° and 70°N)  Subpolar low pressure belt (Southern hemisphere) (60° and 70°S)  Polar high (Northern hemisphere)  Polar high (Southern hemisphere) The equatorial region receives more solar radiation and thus the surface air temperature is high, which creates lighter air near the ground compared to higher latitudes. The above condition leads to low atmospheric pressure over the equatorial region while sub-tropical high pressure belts develop in both the hemispheres between 25 and 35 degree latitudes due to relatively low surface air temperature. It is due to low solar radiation received due to inclined sun’s rays over the subtropical 77
  • 88. region when compared to the equatorial belt. Likewise alternate low and high atmospheric pressure belt systems are developed across the globe from the equator to the poles. Polar high 70° Subpolar low 60° 35° Subtropical high 25° 0° Equatorial low trough 25° 35° Subtropical high 60° Subpolar low 70° Polar high Variation in Atmospheric Pressure (a)Variation with height (Vertical pressure variation) a. Pressure decreases with height. 78
  • 89. b. This is natural since the height of the atmosphere column above decreases with height. (b) Horizontal pressure variation a. Temperature and pressure are inverse to each other. Along equator low pressure exists and in cold polar latitudes polar high exists. b. Horizontal variation of air pressure on the surface of the earth are indicated by Isobars. c. The horizontal variation of pressure depends on Temperature, extent of water vapour, land water realationship etc., (c )Diurnal pressure variation a) There is a definite rhythm in the rise and fall of the pressure in a day. b) Radiational heating (air expansion) and radiational cooling (air contraction) are the main reasons for diurnal variation in the air pressure. c) Diurnal variation is more prominent near the equator than at the mid latitudes. d) The areas closer to sea level record relatively larger amount of variation than in land areas. 79
  • 90. e) Equatorial regions absorbs more heat than it loses while the polar region gives up more heat than they receive. (d) Seasonal pressure variation a) Due to the effect caused by annual variation in the amount of insolation, distinct seasonal pressure variations occur. b) These variations are larger in the tropical region than the mid latitude and polar regions. c) Usually, high pressures are recorded over the continents during the cold season and over the oceans during the warm season. Causes of variation The atmospheric pressure changes continuously due to several factors. The most important factors are changes with temperature, altitude, water vapour content and rotation of earth. a) Temperature Hot air expands and exerts low pressure. Cold air contracts and exerts high pressure. So the equator has a 80
  • 91. low pressure due to prevalence of high temperature but poles have a high pressure. b) Altitude At sea level, the air column exerts its full pressure, but when we stand on a hill or when we go in the upper layers of atmosphere, we leave a portion of air which cannot exert its full pressure. At sea level, a coastal town enjoys high pressure but on high altitude one will register a low pressure. For every 10 m of ascend, the pressure get reduced by 1 hPa. c) Water vapour The water vapour content is lighter in cold area than in air which is dry with the result that moist air of a high temperature exerts a less pressure when compared to cold air. d) Rotation of the earth On account of rotation of the earth, the pressure at 60-70°N and S becomes low. The rotation of the earth near sub-polar belts, makes the air to escape from these belts which move towards the horse latitude (30° - 35°N and 30 – 35°S). These latitudes absorb the air from sub polar belts making the pressure high. G.D.Coriolis (1844) a French Mathematician indicated that air is deflected 81
  • 92. towards right in the Northern Hemisphere and Left in the Southern hemisphere due to rotation of earth and this was termed after him as Coriolis force. Coriolis force is not actually a force but it is effect created by rotation of earth. Importance of pressure on crop plants Pressure patterns Low / Depression or cyclone When the isobars are circular or elliptical in shape, and the pressure is lowest at the centre, such a pressure system is called ‘Low’ or ‘Depression’ or ‘Cyclone’. The movement will be anti-clockwise in the Northern hemisphere while it is clockwise in the southern hemisphere. Wind speed hardly exceeds 40 km per hour. High pressure or Anticyclone When isobars are circular, elliptical in shape and the pressure is highest at the centre such a pressure system is called ‘High’ or ‘Anticyclone’. When the isobars are elliptical rather than circular the system is called as ‘Ridge’ or ‘Wedge’. The movement will be clockwise in the Northern hemisphere while it is anti-clockwise in the southern hemisphere. Atmospheric Humidity 82
  • 93. The amount of water vapour that is present in atmosphere is known as atmospheric moisture or humidity. Absolute humidity The actual mass of water vapour present in a given volume of moist air. It is expressed as grams of water vapour per cubic meter or cubic feet. Specific humidity Weight of water vapour per unit weight of moist air. It is expressed as grams of water vapour per kilogram of air (g/kg). Mixing ratio The ratio of the mass of water vapour contained in a sample of moist air to the mass of dry air. It is expressed as gram of water vapour per kilogram dry air. Relative Humidity The ratio between the amount of water vapour present in a given volume of air and the amount of water vapour required for saturation under fixed temperature and pressure. There are no units and this is expressed as percentage. In other terms it is the ratio of the air’s water vapour content to its maximum water vapour capacity at a given temperature expressed in percentage. The relative 83
  • 94. humidity gives only the degree of saturation of air. The relative humidity of saturated air is 100 per cent. Dew Point temperature The temperature to which a given parcel of air must be cooled in order to become saturation at constant pressure and water vapour content. In this case, the invisible water vapour begins to condense into visible form like water droplets. Vapour Pressure deficit The difference between the saturated vapour pressure (SVP) and actual vapour pressure (AVP) at a given temperature. This is an another measure of moisture in the atmosphere which is useful in crop growth studies. When air contains all the moisture that it can hold to its maximum limit, it is called as saturated air, otherwise it is unsaturated air, at that temperature. The vapour pressure created at this temperature under saturated conditions is vapour pressure or saturated vapour pressure (SVP). Importance of Humidity on crop plants The humidity is not an independent factor. It is closely related to rainfall, wind and temperature. It plays a significant role in crop production 84
  • 95. 1. The humidity determines the crops grown in a given region 2. It affects the internal water potential of plants 3. It influences certain physiological phenomena in crop plants including transpiration 4. The humidity is a major determinant of potential evapotranspiration. So, it determines the water requirement of crops 5. High humidity reduces irrigation water requirement of crops as the evapotranspiration losses from crops depends on atmospheric humidity 6. High humidity can prolong the survival of crops under moisture stress. However, very high or very low relative humidity is not conducive to higher yields of crops 7. There are harmful effects of high humidity. It enhances the growth of some saprophytic and parasitic fungi, bacteria and pests, the growth of which causes extensive damage to crop plants. Eg: a. Blight disease on potato. b. The damage caused by thrips and jassids on several crops 8. High humidity at grain filling reduces the crop yields 85
  • 96. 9. A very high relative humidity is beneficial to maize, sorghum, sugarcane etc, while it is harmful to crops like sunflower and tobacco 10.For almost all the crops, it is always safe to have a moderate relative humidity of above 40%. Variation in Humidity 1. Absolute humidity is highest at the equator and minimum at the poles. 2. Absolute humidity is minimum at sunrise and maximum in afternoon from 2 to 3 p.m. The diurnal variations are small in desert regions. 3. The relative humidity is maximum at about the sunrise and minimum between 2 to 3 p.m. 4. The behaviour of relative humidity differs a lot from absolute humidity. At the equator it is at a maximum of 80 per cent and around 85 per cent at the poles. But, near horse latitudes it is around 70 per cent. Measurement of Humidity 86
  • 97. Wind Air in horizontal motion is known as wind. Vertical movement is noticed but negligibly small compared to horizontal movement as the height of the atmosphere is only for few kilometers. However vertical movement or uplift of air only causes significant weather changes in cloud formation and rain. Wind systems of the world The wind belts found on earth’s surface in each hemisphere are: a) Doldrums b) Trade wind belt c) Prevailing westerlies d) Polar easterlies 1. Doldrums Owing to continuous heating of the earth by insolation, pressures are low and winds converge and rise near the equator. This intertropical convergent zone is known as ‘Doldrums’. a) These are the equatorial belts of calms and variable winds. b) The location is 5°S and 5°N latitudes. c) Wind is light due to negligible pressure gradient. 87
  • 98. d) Mostly, there are vertical movements in the atmosphere. e) The atmosphere is hot and sticky. 2. Trade winds (Tropical Easterlies) a) The regular high temperature at the equator results in a high pressure forming in the upper levels of the equator. b) Then, the air is transferred to the northward and southward directions until 35° North and South in both the hemisphere. 88
  • 99. c) Due to this reduction in surface pressure on the equator (doldrums) there is an increase in pressure at 35°N and 35°S which are known as horse latitude (sub-tropical high). d) As a result, the winds flow from the horse latitude to the equatorial region. e) While moving, these winds are deflected by Coriolis force to the right in northern hemisphere and to the left in southern hemisphere. f) These winds flow from 35°N to the equator in NE direction in the northern hemisphere and from 35°S to the equator in SE direction in the southern hemisphere. These are known as ‘Trade winds’. These are known as ‘Tropical easterlies’. g) These are most constant winds in force and direction and flow over nearly half the globe. 3. Anti-trade winds a) This is a supplementary wind system of the earth which is effective at higher levels. b) This system works in opposite direction to the surface winds. c) The anti-trade winds mostly flow from land to ocean and brings no rain. 89
  • 100. 4. Prevailing Westerlies a) The winds that flow from sub-tropical high to the low-pressure area about 60-70° latitudes in both the hemispheres are known as ‘Prevailing westerlies’. b) In the northern hemisphere the direction of Prevailing westerlies is SW and in southern hemisphere NW. c) These winds are forceful and are irregular as compare to the trade winds in the tropical regions. This is high precipitation zone 5. Polar Easterlies / Polar winds a) A permanent high pressure exists on the poles. b) From these high pressure polar regions, cold winds flow to areas at about 60-65° latitudes in both the hemispheres. c) The winds flow in NE direction in the northern hemisphere and in SE direction in the southern hemisphere. Mountain winds a) Blows from mountain up slope to base b) Occurs during night time c) Cooling of air close to slope takes place 90
  • 101. d) Adiabatic heating decreases this phenomenon e) Also known as ‘Katabalic winds’ Valley winds a) Blow from valley base to up slope. b) Occurs during day time c) Over heating of air adjacent to slope takes place d) Adiabatic cooling decreases this phenomenon e) Also known as ‘Anabatic winds’ Sea breeze During the daytime, more in summer, land is heated more than the adjacent body of water. As a result warmed air over the land expands producing an area of low pressure. The isobaric surfaces bend upward as a result of which the cooler air starts moving across the coast line from sea to land. This is the ‘Sea breeze; or ‘On shore breeze’. Land breeze At night because of nocturnal radiation land is colder than adjacent sea and the pressure gradient is directed from land to sea. There is a gentle flow of wind from land to sea. This ‘off-share’ wind is called ‘Land breeze’. Effect of wind on crop plants 91
  • 102. 1. Transports heat in either sensible or latent heat form from lower to higher altitudes 2. Wind affects the plant directly by increasing transpiration and the intake of CO2 and also causes several types of mechanical damage 3. Wind helps in pollination and dispersal of seeds 4. Light and gentle winds are helpful for cleaning the agricultural produce 5. Hot dry winds frequently do much damage to vegetation in the growing crops by promoting excessive water loss 6. Wind has powerful effect on humidity 7. Long, continued warm, dry winds injured blossoms by evaporating the secretion of the stigma 8. Provides moisture which is necessary for precipitation 9. Wind prevents frost by disrupting atmospheric inversion 10.Causes soil erosion Speed and Direction of wind Measurement of wind 92