
Recomendados
Recomendados
Mais conteúdo relacionado
Semelhante a 2nd cycle experiments.docx
Semelhante a 2nd cycle experiments.docx (20)
Mais de atiulla001
Último
Último (20)
2nd cycle experiments.docx
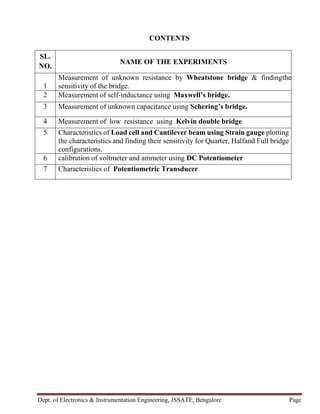
- 1. Dept. of Electronics & Instrumentation Engineering, JSSATE, Bengalore Page CONTENTS SL. NO. NAME OF THE EXPERIMENTS 1 Measurement of unknown resistance by Wheatstone bridge & findingthe sensitivity of the bridge. 2 Measurement of self-inductance using Maxwell’s bridge. 3 Measurement of unknown capacitance using Schering’s bridge. 4 Measurement of low resistance using Kelvin double bridge 5 Characteristics of Load cell and Cantilever beam using Strain gauge plotting the characteristics and finding their sensitivity for Quarter, Halfand Full bridge configurations. 6 calibration of voltmeter and ammeter using DC Potentiometer 7 Characteristics of Potentiometric Transducer
- 2. Dept. of Electronics & Instrumentation Engineering, JSSATE, Bengalore Page Experiment No. 1 WHEAT STONE’S BRIDGE (WSB) Aim: To determine the value of a. Unknown resistance using WSB b. The sensitivity of the given WSB Components Required: 1. Wheat stone’s bridge 2. DRB 3. Voltmeter (0 – 10V) 4. Galvanometer (0 - 30µA) 5. Battery (2V) Circuit Diagram: a. For unknown resistance of the bridge Fig (a) At balance condition, P / X = Q / R But, X/P = R/Q X = (P / Q). R Ω
- 3. Dept. of Electronics & Instrumentation Engineering, JSSATE, Bengalore Page Procedure: a. Measurement of unknown resistance of the bridge 1. Connect the circuit as shown in fig (a) 2. Set P/Q ratio to some value 3. Connect the resistor to unknown bridge arm of which the resistance has to be found 4. Vary the variable resistance until the galvanometer shows null deflection 5. Calculate the unknown resistance value using the relation Tabular Column: Sl. No. P/Q Ratio R in Ω X = (P/Q).R Ω 1 0.1 2 01 3 10 4 100 b. For sensitivity of the bridge Fig (b) Sensitivity of the bridge X = (P/Q). R OR RATIO X R Ω
- 4. Dept. of Electronics & Instrumentation Engineering, JSSATE, Bengalore Page Procedure: b. For sensitivity of the bridge 1. Connect the circuit as shown in fig (b) 2. The galvanometer is replaced by voltmeter 3. Set the P/Q ratio to some value 4. Vary the unknown resistance ( R ) in steps of 10Ω and note down the corresponding o/p reading using voltmeter 5. Find out the sensitivity of the bridge using the relation 6. Change the ‘P/Q’ ratio value and repeat the above procedure. Tabular column: P/Q = 0.001 P/Q = 0.01 P/Q = 0.1 P/Q = 1 R in Ω Vo in mV R in Ω Vo in mV R in Ω Vo in mV R in Ω Vo in mV Result: S = ΔV / ΔR mV / Ω
- 5. Dept. of Electronics & Instrumentation Engineering, JSSATE, Bengalore Page Experiment No. 2 MAXWELL’S INDUCTANCE BRIDGE Aim: To determine the inductance of the given coil using Maxwell’s inductance bridge. Components required: 1. Maxwell’s bridge 2. Headphone 3. Galvanometer (0 - 100µA) 4. Power supply (0 – 3V) 5. DRB 6. DCB 7. Resistors 8. Unknown inductance coil Circuit diagram of Maxwell’s Inductance Bridge: I. For DC balance At balance condition, P/R = Q/T But, T/Q = R/P Fig (a) T = (Q/P) R Ω
- 6. Dept. of Electronics & Instrumentation Engineering, JSSATE, Bengalore Page Procedure: I. For DC balance 1. Connect the circuit as shown in the fig (a). 2. Connect the galvanometer to the use of 3 volts DC power supply. (i.e., the galvanometer shows connected to the point marked as detector). 3. The galvanometer key is pressed and the value of ‘R’ is adjusted until the galvanometer shows null deflection. 4. The value of ‘R’ is noted. 5. The above steps are repeated for different unknown inductance coil. II. For AC balance Fig (b)
- 7. Dept. of Electronics & Instrumentation Engineering, JSSATE, Bengalore Page Procedure: III. For AC balance 1. Connect the circuit as shown in the fig (b). 2. The 3 volts DC supply is replaced by an AC supply of 1 KHz and the galvanometer is replaced by headphone. 3. Keeping the value of ‘R’ as constant (for DC balance ‘R’ value), the value of ‘C’ is adjusted until the sound in the headphone is minimum. 4. The corresponding value of capacitor ‘C’ is noted. 5. The above steps are repeated for different unknown inductance coil. 6. The value of unknown inductance ‘L’ is calculated by using the relation. 7. Find out the value of unknown inductance ‘L’ using LCR – Q meter and compare with experimental value. Tabular Column: Sl. No. P in Ω Q in Ω R in Ω C in μF L = ‘QRC’ in HENRY 1 2 3 4 5 Results: L = “QRC” Henry
- 8. Dept. of Electronics & Instrumentation Engineering, JSSATE, Bengalore Page Experiment No. 3 SCHERING BRIDGE Aim: To find out the value of unknown capacitance using Schering bridge Components required: 1. Schering bridge 2. DCB 3. Resistance 4. Power supply 5. Headphone Circuit diagram: At balance condition, C/C2 = R1/R2 C = C2 (R2/R1) μF
- 9. Dept. of Electronics & Instrumentation Engineering, JSSATE, Bengalore Page Procedure: 1. Connect the circuit as shown in the circuit diagram with one standard capacitor (C2) (i.e. known value). 2. The unknown capacitor (C) is connected to the corresponding arm. 3. The variable capacitor (C1) is set to some value. 4. The variable resistor (R1) is set to some value. 5. Then the variable resistor (R2) is varied until the sound in the headphone is minimum 6. The sound in the headphone is not minimized, and then readjusts the resistance ‘R1’ with alternate adjustments. 7. Find out the unknown capacitance (C) value using the relation. 8. Find out the unknown capacitance (C) value using LCR – Q meter and compare with experimental value Tabular column: Sl. No. C2 in μF R1 in Ω R2 in Ω C = C2 (R2/R1) μF 1 2 3 4 5 Results: C = C2 (R2/R1) μF
- 10. Dept. of Electronics & Instrumentation Engineering, JSSATE, Bengalore Page Experiment No. 4 KELVIN’S DOUBLE BRIDGE Aim: Measurement of unknown low resistance using Kelvin’s double bridge Components required: 1. Kelvin’s double bridge set up 2. Galvanometer (0 - 300µA) 3. Ammeter (0 – 10A) 4. Power supply Circuit diagram: Fig (a) Experimental setup for finding unknown resistance:
- 11. Measurement and Transducer Lab (21EIL35) Dept. of Electronics & Instrumentation Engineering, JSSATE, Bengalore Page Procedure: 1. Connect the current supply to the terminals and mark it as current. 2. Connect the galvanometer to the bridge. 3. Connect the resistance under test to the bridge terminals CP and C1P1. 4. Set the current switch to normal position in case of variable supply. 5. Adjust the current to required value (say 2A). 6. Set the P/Q ration to some value. 7. Set the galvanometer to the minimum sensitivity. 8. Operate galvanometer keys by pressing initial key and final key alternatively. 9. Observe the galvanometer deflection and adjust the variable resistance until galvanometer obtains null deflection. Tabular column: Sl. No. P/Q Ratio Sp = X = (P/Q) R in mΩ Wr = Wire Resistance in mΩ Actual Resistance S = (Sp – Wr) in mΩ 1 2 3 4 5 Results:
- 12. Measurement and Transducer Lab (21EIL35) Dept. of Electronics & Instrumentation Engineering, JSSATE, Bengalore Page Experiment No. 5 RESISTANCE TRANSDUCER AND LOAD CELL Aim: To find out the characteristics of given resistance transducer using a. Load cell b. Strain gauge i. Quarter ii. Half iii. Full bridge Components required: 1. Strain gauge 2. Potentiometer 3. Power supply 4. Weight a. Circuit diagram of Load cell: Procedure: 1. Strain gauge load cell and digital load indicator is setup as per operator instruction. 2. With no load on the weighting pan the digital indicator is set as zero. 3. The weighing pan is loaded with 1 kg corresponding reading of digital load indicator is noted. 4. The digital load indicator is now increased in steps of 1 kg up to 10 kg and both the reading of the actual load applied and digital load indicator is noted in the tabularcolumn. 5. After load reaches 1 kg the weight are reduced to bring the load back to zero. 6. A Plot of actual load as applied and the load by the strain gauge load cell indicated by the digital meter is drawn.
- 13. Measurement and Transducer Lab (21EIL35) Dept. of Electronics & Instrumentation Engineering, JSSATE, Bengalore Page Tabular column: Sl. No. Actual load applied in Kg Digital load indicator reading in Kg 1 2 3 4 5 Expected graph: b. Circuit diagram of Strain Gauge:
- 14. Measurement and Transducer Lab (21EIL35) Dept. of Electronics & Instrumentation Engineering, JSSATE, Bengalore Page Procedure: 1. Connect the mains card to 230V, 50Hz mains. 2. Switch ‘ON’ the instruments provided power ‘ON’ switch in the back panel of instrument. 3. To operate 4 arm bridge select the range selection switch to 4th range and connect the 4-arm connection from cantilever beam provides red, black and yellow. Blue recorder and short black and green recorder to back panel of the instrument. 4. Make zero by using ‘Zero’ potentiometer provided in front panel. 5. Apply weights to cantilever beam in steps of 100 gram X 10. 6. Note down indicator reading verses applied load. 7. To operate ‘2’ arm keep open circuit in cantilever beam black and green recorder and connect red, black and yellow to back panel of instrument. 8. Range selector switch select ‘2’. 9. Make zero by using zero potentiometer. 10. Apply load in steps of 100 grams X 10. 11. Note down reading. 12. To operate single arm bridge connect red and yellow from cantilever beam to back panel of the instrument provided red and yellow. 13. Select selector switch to ‘1’. 14. Apply load to cantilever beam 100 grams X 10. 15. Note down the readings. Tabular column: Sl. No. Actual load applied in gms Full bridge Half bridge Quarter bridge 1 2 3 4 5 Results:
- 15. Measurement and Transducer Lab (21EIL35) Dept. of Electronics & Instrumentation Engineering, JSSATE, Bengalore Page Experiment No. 6 D. C. POTENTIOMETER Aim: Calibration of ammeter and voltmeter using DC potentiometer Components required: 1. DC potentiometer 2. Voltmeter (0 – 10V) 3. Ammeter (0 – 10A) 4. Voltage ratio box (0 – 32V) 5. 1Ω standard resistance 6. Rheostat 7. Power supply Circuit diagram for calibration of voltmeter: Procedure: I. Standardization 1. Press the standardization key. 2. Change the rheostat setting to get null deflection of the galvanometer. 3. Do not change the rheostat setting once the standardization is over. II. Calibration of Voltmeter 1. Connect the circuit diagram as shown in figure. 2. Vary the supply to get a particular reading on the voltmeter. 3. Vary the main dial and slide wire resistance to get the null deflection. 4. Compare the indicated value of the voltmeter with potentiometer reading and calculate the percentage of error and plot the graph of voltage Vs voltage
- 16. Measurement and Transducer Lab (21EIL35) Dept. of Electronics & Instrumentation Engineering, JSSATE, Bengalore Page indicated. Tabular column: Sl. No. Voltage Indicated Vi in Volts Potentiometer Reading VP in Volts Actual Voltage Vact = VP. K (K=20) % Error = (Vi – Vact) / Vact.100 1 2 3 4 5 Expected graph: Circuit diagram for calibration of ammeter: Procedure:
- 17. Measurement and Transducer Lab (21EIL35) Dept. of Electronics & Instrumentation Engineering, JSSATE, Bengalore Page 1. Connect the circuit as shown in figure. 2. Connect the o/p terminal of the standard resistance (PP’ ) to the voltage ratio box and then to DC potentiometer. 3. Using DC supply adjust the current in Ammeter (Say 1A). 4. Vary the potentiometer slide wire until galvanometer shows null deflection. 5. Repeat the above procedure for different current values. 6. Plot the graph for current indicated Vs actual current. Tabular column: Sl. No. Current Indicated Ii in Amp Potentiometer Reading VP in mV Vact = VP. K (K=20) Iact = Vact / R in A % Error = (Ii – Iact) / Iact.100 1 2 3 4 5 Expected graph: Results:
- 18. Measurement and Transducer Lab (21EIL35) Dept. of Electronics & Instrumentation Engineering, JSSATE, Bengalore Page Experiment No. 7 POTENTIOMETRIC TRANSDUCER Aim: To study the characteristics of Potentiometric transducer Components required: 1. Potentiometer 2. Power supply 3. Voltmeter 4. Rheostat Circuit diagram: Procedure: 1. Connect the circuit as shown in figure. 2. Give some constant in put supply across rheostat. 3. Note down the total length of rheostat (Xt). 4. Move the rheostat wiper in steps of 2cm & measure the distance wiper has moved from ground point (Xi). 5. Calculate the theoretical output voltage using the relation. 6. Plot the graph of Xi verses Eo. Eo = (Xi/Xt) Ei
- 19. Measurement and Transducer Lab (21EIL35) Dept. of Electronics & Instrumentation Engineering, JSSATE, Bengalore Page Tabular column: Input voltage Ei = 5V constant Sl. No. Xi in cm Xt in cm Eo = (Xi/Xt) Ei in Volts (Theoretical) Eo in Volts (Practical) 1 2 3 4 5 Expected graph: Result: