Submit Search
Upload
State Bridge Profile Washington 2014
•
0 likes
•
490 views
artba
Follow
State Bridge Profile Washington 2014
Read less
Read more
Government & Nonprofit
Report
Share
Report
Share
1 of 2
Download now
Download to read offline
Recommended
State Bridge Profile Iowa 2014
artba
State Bridge Profile Wisconsin 2014
artba
State Bridge Profile Kansas 2014
artba
State Bridge Profile Nebraska 2014
artba
State Bridge Profile Rhode Island 2014
artba
State Bridge Profile Wyoming 2014
artba
State Bridge Profile West Virginia 2014
artba
State Bridge Profile Ohio 2014
artba
State Bridge Profiles Alaska 2014
artba
State Bridge Profile New Mexico 2014
artba
State Bridge Profile Arkansas 2014
artba
State Bridge Profile Illinois 2014
artba
State Bridge Profile Pennsylvania 2014
artba
State Bridge Profile Nevada 2014
artba
State Bridge Profile Kentucky 2014
artba
State Bridge Profile Mississippi 2014
artba
State Bridge Profile Idaho 2014
artba
State Bridge Profile Texas 2014
artba
State Bridge Profile Maine 2014
artba
Pennsylvania State Bridge Profile
artba
State Bridge Profile Massachusetts 2014
artba
State Bridge Profile Florida 2014
artba
State Bridge Profile South Dakota 2014
artba
State Bridge Profile Minnesota 2014
artba
State Bridge Profiles Alabama 2014
artba
State Bridge Profile New Hampshire 2014
artba
State Bridge Profile Oregon 2014
artba
State Bridge Profile Michigan 2014
artba
Evidencia de conocimiento administrativo en salud identificar necesidades
Nathanoj Jovans
Trabajo 2hgk
Trabajo 2hgk
kelwinallen
More Related Content
What's hot
State Bridge Profiles Alaska 2014
artba
State Bridge Profile New Mexico 2014
artba
State Bridge Profile Arkansas 2014
artba
State Bridge Profile Illinois 2014
artba
State Bridge Profile Pennsylvania 2014
artba
State Bridge Profile Nevada 2014
artba
State Bridge Profile Kentucky 2014
artba
State Bridge Profile Mississippi 2014
artba
State Bridge Profile Idaho 2014
artba
State Bridge Profile Texas 2014
artba
State Bridge Profile Maine 2014
artba
Pennsylvania State Bridge Profile
artba
State Bridge Profile Massachusetts 2014
artba
State Bridge Profile Florida 2014
artba
State Bridge Profile South Dakota 2014
artba
State Bridge Profile Minnesota 2014
artba
State Bridge Profiles Alabama 2014
artba
State Bridge Profile New Hampshire 2014
artba
State Bridge Profile Oregon 2014
artba
State Bridge Profile Michigan 2014
artba
What's hot
(20)
State Bridge Profiles Alaska 2014
State Bridge Profile New Mexico 2014
State Bridge Profile Arkansas 2014
State Bridge Profile Illinois 2014
State Bridge Profile Pennsylvania 2014
State Bridge Profile Nevada 2014
State Bridge Profile Kentucky 2014
State Bridge Profile Mississippi 2014
State Bridge Profile Idaho 2014
State Bridge Profile Texas 2014
State Bridge Profile Maine 2014
Pennsylvania State Bridge Profile
State Bridge Profile Massachusetts 2014
State Bridge Profile Florida 2014
State Bridge Profile South Dakota 2014
State Bridge Profile Minnesota 2014
State Bridge Profiles Alabama 2014
State Bridge Profile New Hampshire 2014
State Bridge Profile Oregon 2014
State Bridge Profile Michigan 2014
Viewers also liked
Evidencia de conocimiento administrativo en salud identificar necesidades
Nathanoj Jovans
Trabajo 2hgk
Trabajo 2hgk
kelwinallen
InformesKJ
InformesKJ
kelwinallen
Trabajo 1
Trabajo 1
kelwinallen
2014 TransOvation Awards
artba
2014 FIP & TCC Program of Events and Agenda
artba
Viewers also liked
(6)
Evidencia de conocimiento administrativo en salud identificar necesidades
Trabajo 2hgk
Trabajo 2hgk
InformesKJ
InformesKJ
Trabajo 1
Trabajo 1
2014 TransOvation Awards
2014 FIP & TCC Program of Events and Agenda
Similar to State Bridge Profile Washington 2014
State Bridge Profile Maryland 2014
artba
State Bridge Profile Louisiana 2014
artba
New Jersey State Bridge Profile 2014
artba
State Bridge Profile Georgia 2014
artba
State Bridge Profile Vermont 2014
artba
State Bridge Profile Montana 2014
artba
State Bridge Profile Indiana 2014
artba
State Bridge Profile Oklahoma 2014
artba
State Bridge Profiles Arizona 2014
artba
Washington State Bridge Profile
artba
State Bridge Profile North Dakota 2014
artba
State Bridge Profile Hawaii 2014
artba
State Bridge Profile Missouri 2014
artba
Similar to State Bridge Profile Washington 2014
(13)
State Bridge Profile Maryland 2014
State Bridge Profile Louisiana 2014
New Jersey State Bridge Profile 2014
State Bridge Profile Georgia 2014
State Bridge Profile Vermont 2014
State Bridge Profile Montana 2014
State Bridge Profile Indiana 2014
State Bridge Profile Oklahoma 2014
State Bridge Profiles Arizona 2014
Washington State Bridge Profile
State Bridge Profile North Dakota 2014
State Bridge Profile Hawaii 2014
State Bridge Profile Missouri 2014
More from artba
2017 media kit
2017 media kit
artba
September October tb_2016
artba
Transportation Builder July/August 2016
artba
The National Work Zone Management Conference Agenda 2016
artba
ARTBA 2016 National Convention Program
artba
May/June Transportation Builder
artba
Northeastern regional meeting
artba
Southern regional meeting
artba
Central regional meeting
artba
Western regional meeting
artba
Western regional meeting
artba
July/August 2015 TB magazine
artba
September/October 2015 TB magazine
artba
November/December 2015 TB
artba
January/February 2016 TB
artba
March/April 2016 TB
March/April 2016 TB
artba
2016 ARTBA FIP Schedule
artba
2016 ARTBA FIP Program
artba
2016 ILDP Agenda
2016 ILDP Agenda
artba
P3 Agenda 2016
P3 Agenda 2016
artba
More from artba
(20)
2017 media kit
2017 media kit
September October tb_2016
Transportation Builder July/August 2016
The National Work Zone Management Conference Agenda 2016
ARTBA 2016 National Convention Program
May/June Transportation Builder
Northeastern regional meeting
Southern regional meeting
Central regional meeting
Western regional meeting
July/August 2015 TB magazine
September/October 2015 TB magazine
November/December 2015 TB
January/February 2016 TB
March/April 2016 TB
March/April 2016 TB
2016 ARTBA FIP Schedule
2016 ARTBA FIP Program
2016 ILDP Agenda
2016 ILDP Agenda
P3 Agenda 2016
P3 Agenda 2016
Recently uploaded
IEA Global Critical Minerals Outlook2024
Energy for One World
一比一原版(MQU毕业证)麦考瑞大学毕业证成绩单
enbam
一比一原版(QUT毕业证)昆士兰科技大学毕业证成绩单
aveka1
EDI Executive Education Master Class- 15thMay 2024 (updated) (2)
Energy for One World
researching client.pptxffffffffffffffffffffffffff
lolsDocherty
2024: The FAR - Federal Acquisition Regulations, Part 35
JSchaus & Associates
Program Kickoff- Cohort 4______ (2).pptx
ScottMeyers35
Who are the Sherden Yale Historical Review
yalehistoricalreview
Minority economic forum Executive Summary
RDE GROUP CORP
2024_End_of_Session_Report_Final_With_Vetoes.pdf
Kairos Capital Legal Advisors,LLC
一比一原版(IC毕业证)帝国理工大学毕业证成绩单
exuyk
Ghana High Commission on list of diplomats including US & China who owe £143m...
Kweku Zurek
Near and Not Lost Yale Historical Review
yalehistoricalreview
bee engaged with youth - World Bee Day 2024
Christina Parmionova
The MEL Toolkit Launch Webinar Presentation
NAP Global Network
Medieval Iraq Demographic Factors Yale Historical Review
yalehistoricalreview
Effective Financial Reporting - May 2024
FelixPerez547899
sarkarijobswork.online-bsf-si-vehicle-mechanic-and-constable-technical-may24.pdf
Sarkari Jobs Work
一比一原版(SUT毕业证)斯威本科技大学毕业证成绩单
aveka1
WhenWomenTakeControl.pdf Yale Historical Review
yalehistoricalreview
Recently uploaded
(20)
IEA Global Critical Minerals Outlook2024
一比一原版(MQU毕业证)麦考瑞大学毕业证成绩单
一比一原版(QUT毕业证)昆士兰科技大学毕业证成绩单
EDI Executive Education Master Class- 15thMay 2024 (updated) (2)
researching client.pptxffffffffffffffffffffffffff
2024: The FAR - Federal Acquisition Regulations, Part 35
Program Kickoff- Cohort 4______ (2).pptx
Who are the Sherden Yale Historical Review
Minority economic forum Executive Summary
2024_End_of_Session_Report_Final_With_Vetoes.pdf
一比一原版(IC毕业证)帝国理工大学毕业证成绩单
Ghana High Commission on list of diplomats including US & China who owe £143m...
Near and Not Lost Yale Historical Review
bee engaged with youth - World Bee Day 2024
The MEL Toolkit Launch Webinar Presentation
Medieval Iraq Demographic Factors Yale Historical Review
Effective Financial Reporting - May 2024
sarkarijobswork.online-bsf-si-vehicle-mechanic-and-constable-technical-may24.pdf
一比一原版(SUT毕业证)斯威本科技大学毕业证成绩单
WhenWomenTakeControl.pdf Yale Historical Review
State Bridge Profile Washington 2014
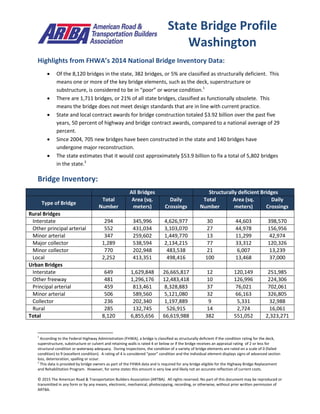
1.
© 2015 The
American Road & Transportation Builders Association (ARTBA). All rights reserved. No part of this document may be reproduced or transmitted in any form or by any means, electronic, mechanical, photocopying, recording, or otherwise, without prior written permission of ARTBA. Highlights from FHWA’s 2014 National Bridge Inventory Data: Of the 8,120 bridges in the state, 382 bridges, or 5% are classified as structurally deficient. This means one or more of the key bridge elements, such as the deck, superstructure or substructure, is considered to be in “poor” or worse condition.1 There are 1,711 bridges, or 21% of all state bridges, classified as functionally obsolete. This means the bridge does not meet design standards that are in line with current practice. State and local contract awards for bridge construction totaled $3.92 billion over the past five years, 50 percent of highway and bridge contract awards, compared to a national average of 29 percent. Since 2004, 705 new bridges have been constructed in the state and 140 bridges have undergone major reconstruction. The state estimates that it would cost approximately $53.9 billion to fix a total of 5,802 bridges in the state.2 Bridge Inventory: All Bridges Structurally deficient Bridges Type of Bridge Total Number Area (sq. meters) Daily Crossings Total Number Area (sq. meters) Daily Crossings Rural Bridges Interstate 294 345,996 4,626,977 30 44,603 398,570 Other principal arterial 552 431,034 3,103,070 27 44,978 156,956 Minor arterial 347 259,602 1,449,770 13 11,299 42,974 Major collector 1,289 538,594 2,134,215 77 33,312 120,326 Minor collector 770 202,948 483,538 21 6,007 13,239 Local 2,252 413,351 498,416 100 13,468 37,000 Urban Bridges Interstate 649 1,629,848 26,665,817 12 120,149 251,985 Other freeway 481 1,296,176 12,483,418 10 126,996 224,306 Principal arterial 459 813,461 8,328,883 37 76,021 702,061 Minor arterial 506 589,560 5,121,080 32 66,163 326,805 Collector 236 202,340 1,197,889 9 5,331 32,988 Rural 285 132,745 526,915 14 2,724 16,061 Total 8,120 6,855,656 66,619,988 382 551,052 2,323,271 1 According to the Federal Highway Administration (FHWA), a bridge is classified as structurally deficient if the condition rating for the deck, superstructure, substructure or culvert and retaining walls is rated 4 or below or if the bridge receives an appraisal rating of 2 or less for structural condition or waterway adequacy. During inspections, the condition of a variety of bridge elements are rated on a scale of 0 (failed condition) to 9 (excellent condition). A rating of 4 is considered “poor” condition and the individual element displays signs of advanced section loss, deterioration, spalling or scour. 2 This data is provided by bridge owners as part of the FHWA data and is required for any bridge eligible for the Highway Bridge Replacement and Rehabilitation Program. However, for some states this amount is very low and likely not an accurate reflection of current costs. State Bridge Profile Washington
2.
© 2015 The
American Road & Transportation Builders Association (ARTBA). All rights reserved. No part of this document may be reproduced or transmitted in any form or by any means, electronic, mechanical, photocopying, recording, or otherwise, without prior written permission of ARTBA. Proposed bridge work: Type of Work Number Cost (millions) Daily Crossings Area (sq. meters) Bridge replacement 787 $472.5 2,817,527 332,050 Widening & rehabilitation 46 $132.0 391,024 59,483 Rehabilitation 3,405 $53,007.0 57,285,622 5,190,425 Deck rehabilitation/replacement 27 $3.6 112,539 20,094 Other work 1,537 $311.7 2,196,278 483,783 Top 10 Most Traveled Structurally Deficient Bridges in the State: County Year Built Daily Crossings Type of Bridge Location King 1963 60,221 Urban freeway/expressway SR 520 over Lake Washington (Evergreen Point Floating Bridge) King 1959 57,671 Urban other principal arterial W Emerson Street over 15th Avenue W King 1989 57,428 Urban Interstate I-90 over Lake Washington (Lacey V. Murrow Memorial Bridge) King 1940 57,428 Urban Interstate I-90 WB and pedestrian walkway over Lake Washington (Homer M. Hadley Memorial Bridge) King 1970 37,549 Urban other principal arterial SR 900 over I-90 King 1966 35,000 Urban other principal arterial S 212th Street over the Green River Spokane 1963 34,707 Urban Interstate I-90 over Hangman Creek Spokane 1963 34,707 Urban Interstate I-90 over Hangman Creek King 1952 34,500 Urban other principal arterial S Boeing Access Road over the Burlington Northern Railroad King 1945 34,500 Urban other principal arterial S Boeing Access Road over the Airport Way Bar Ramp Sources: All data is from the 2014 National Bridge Inventory, released by the Federal Highway Administration in January 2015. Note that specific conditions on bridge may have changed as a result of recent work. Cost estimates of bridge work provided as part of the data and have been adjusted to 2014$ for inflation and estimated project costs. Contract awards data is for state and local government awards and comes from McGraw Hill. Note that additional bridge investment may be a part of other contract awards if a smaller bridge project is included with a highway project, and that would not be accounted for in the total in this profile.
Download now