SlideShare uma empresa Scribd logo
1 de 34
Baixar para ler offline
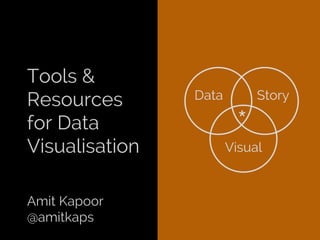
Amit Kapoor
@amitkaps
Data
Visual
Story
*
Tools &
Resources
for Data
Visualisation
Tools Landscape
Abstract
Flexible
Difficult
Slow
Code
Expressive
Blackbox
Limited
Simple
Quick
GUI
Efficient
Tools Landscape
Abstract, Flexible, Difficult
Slow, Code, Expressive
Blackbox, Limited, Simple
Quick, GUI, Efficient
Tools Landscape
Abstract, Flexible, Difficult
Slow, Code, Expressive
Blackbox, Limited, Simple
Quick, GUI, Efficient
Canvas
Paint directly on a
pixel grid. Design &
manage every
element of chart
Processing
Nodebox
sketchpad
Raphael.js
Paper.js
Processing.js
Processing - Pie Chart
size(400, 400);
background(255);
smooth();
noStroke();
int diameter = 200;
float[] data = {5, 25, 15, 20, 10};
int[] sat = {25, 75, 125, 175, 225};
float lastAngle = 0, sum = 0;
for (int i = 0; i < data.length; i++)
sum += data[i];
for (int i = 0; i < data.length; i++) {
fill(sat[i]);
float angle = data[i] / sum * 2 * PI;
arc(width / 2, height / 2, diameter,
diameter,
lastAngle, lastAngle + angle);
lastAngle += angle;
}
Source: Processing
Tools Landscape
Abstract, Flexible, Difficult
Slow, Code, Expressive
Blackbox, Limited, Simple
Quick, GUI, Efficient
Canvas Charting
Collection of fixed
charts that require
data to be shaped
in a particular way
Excel
Mondrian
Many Eyes
Google Charts
HighCharts
Fusion Charts
Paint directly on a
pixel grid. Design &
manage every
element of chart
Processing
Nodebox
sketchpad
Raphael.js
Paper.js
Processing.js
Excel - Chart Typology
Excel - Column, Bar
Excel - Pie, Line, Area
Excel - Scatter, Others
Excel - Types, Others
Excel - Trees, Streams
Source: Microsoft Research
Many Eyes
Source: IBM- Many Eyes
Google Charts - Pie
Source: Google Charts Playground
function drawVisualization() {
// Create and populate the data table.
var data = google.visualization.
arrayToDataTable([
['Areas', 'Sales'],
['North', 5],
['East', 25],
['West', 15],
['South', 20],
['Central', 10]
]);
// Create and draw the visualization.
new google.visualization.PieChart
(document.getElementById
('visualization')).
draw(data, {title:"Sales by
Area"});
}
Google Charts
Source: Google Charts
Google Charts
Source: Google Charts
HighCharts
Source: HighCharts
Tools Landscape
Abstract, Flexible, Difficult
Slow, Code, Expressive
Blackbox, Limited, Simple
Quick, GUI, Efficient
Canvas Charting
Collection of fixed
charts that require
data to be shaped
in a particular way
Excel
Mondrian
Many Eyes
Google Charts
HighCharts
Fusion Charts
Paint directly on a
pixel grid. Design &
manage every
element of chart
Processing
Nodebox
sketchpad
Raphael.js
Paper.js
Processing.js
Visual
Visual analysis
languages allowing
flexibility to design
many variants
Tableau
Gephi
raw
Vega
Tableau - VizQL
Source: Tableau Software Public
Gephi - Graph Viz
Source: Gephi
Raw
Source: Raw
Vega
Source: Vega Visualization
Tools Landscape
Abstract, Flexible, Difficult
Slow, Code, Expressive
Blackbox, Limited, Simple
Quick, GUI, Efficient
Canvas Grammar Charting
Collection of fixed
charts that require
data to be shaped
in a particular way
Excel
Mondrian
Many Eyes
Google Charts
HighCharts
Fusion Charts
Collection of
graphical primitives
for composing data
driven graphics
R-ggplot2
SPSS
plot.ly
d3.js
Bokeh
Paint directly on a
pixel grid. Design &
manage every
element of chart
Processing
Nodebox
sketchpad
Raphael.js
Paper.js
Processing.js
Visual
Visual analysis
languages allowing
flexibility to design
many variants
Tableau
Gephi
raw
Vega
R - ggplot2
Source: ggplot2
areas <- c("North", "East", "West",
"South", "Central")
sales <- c(5, 25, 15, 20, 10)
humble <- data.frame(areas, sales)
ggplot(humble, aes(x = "",
fill = areas,
weight = sales)) +
geom_bar(width = 1) +
coord_polar("y")
d3.js
Source: Data-Driven Documents
var data = [5, 25, 15, 20, 10];
var color = d3.scale.category20();
var svg = d3.select("body").append("svg")
.attr("width", 150)
.attr("height", 150);
var g = svg.append("g")
.attr("transform", "translate(75,
75)");
var arcs = g.selectAll("path")
.data(d3.layout.pie().sort(null)
(data)) .enter().append("path")
.style("fill", function(d,i) {
return color(i); })
.attr("d",d3.svg.arc()
.innerRadius(0)
.outerRadius(70));
Tools Landscape
Abstract, Flexible, Difficult
Slow, Code, Expressive
Blackbox, Limited, Simple
Quick, GUI, Efficient
Canvas Grammar Charting
Collection of fixed
charts that require
data to be shaped
in a particular way
Excel
Mondrian
Many Eyes
Google Charts
HighCharts
Fusion Charts
Collection of
graphical primitives
for composing data
driven graphics
R-ggplot2
SPSS
plot.ly
d3.js
Bokeh
Paint directly on a
pixel grid. Design &
manage every
element of chart
Processing
Nodebox
sketchpad
Raphael.js
Paper.js
Processing.js
Visual
Visual analysis
languages allowing
flexibility to design
many variants
Tableau
Gephi
raw
Vega
Foundational
Semiology of
Graphics
Jacques
Bertin
Theory
Exploratory
Data Analysis
John
Tukey
EDA
The Visual
Display of
Quantitative
Information
Edward
Tufte
Excellence
The Elements
of Graphing
Data
William
Cleveland
Methods
The Grammar
of Graphics
Leland
Wilkinson
Grammar
Fundamentals
Show Me the
Numbers
Stephen
Few
Basic Graphs
Now you
see it
Stephen
Few
Exploratory
Information
Dashboard
Design
Stephen
Few
Dashboard
Envisioning
Information
Edward
Tufte
Methods
Visualising
Data
William
Cleveland
Methods
Think, Perception, Design
Unfolding the
Napkin / The
Back of the
Napkin
Dan
Roam
Thinking
The Non-
Designer’s
Design Book
Robin
Williams
Graphic
Design
The Design of
Everyday
Things
Donald
Norman
Human Object
Interaction
Information
Visualization:
Perception for
Design
Colin
Ware
Perception
Visual
Thinking for
Design
Colin
Ware
Visual
Cognition
Process & Tools
Data
Visualization: A
Successful
Design Process
Andy
Kirk
Approach
Visualizing
Data
Ben
Fry
Processing /
Approach
Interactive Data
Visualization
Scott
Murray
D3.js
ggplot2:
Elegant
Graphics for
Data Analysis
Hadley
Wickam
R: ggplot2
Data
Journalism
Handbook
Open
Knowledge
Data
Journalism
Storytelling
Resonate
Nancy Duarte
Stories
Slidedocs
Nancy
Duarte
Slides +
Documents
Making
Comics
Scott
McCloud
Images +
Words
Improving
your
Storytelling
Doug Lipman
Oral
Storytelling
The Story
Factor
Annette
Simmons
Business
Storytelling
Blogs and Links
● Guardian Data Blog
● New York Times
● Excel Charts
● Visualising Data
● Fell in Love with Data
● Flowing Data
● datavisualization.ch
● Eager eyes
● Junk Charts
● Information Aesthetics
● HBR - Persuading with Data
A collection of blogs by Flowing Data
Courses
● Jeffrey Heer - CSE512 Data Visualization
● Tamara Munzer - CS533-09 Information Visualization
● Udacity - Intro to Data Science
● Udacity - Exploratory Data Analysis
Amit Kapoor
@amitkaps
amitkaps.com
narrativeviz.com
Data
Visual
Story
*

Mais conteúdo relacionado

Mais procurados

Computer graphics
Computer graphics Computer graphics
Computer graphics shafiq sangi
 
12. Map | WeakMap | ES6 | JavaScript | Typescript
12. Map | WeakMap | ES6 | JavaScript | Typescript12. Map | WeakMap | ES6 | JavaScript | Typescript
12. Map | WeakMap | ES6 | JavaScript | Typescriptpcnmtutorials
 
Data visualization using the grammar of graphics
Data visualization using the grammar of graphicsData visualization using the grammar of graphics
Data visualization using the grammar of graphicsRupak Roy
 
C Graphics Functions
C Graphics FunctionsC Graphics Functions
C Graphics FunctionsSHAKOOR AB
 
Texture mapping in_opengl
Texture mapping in_openglTexture mapping in_opengl
Texture mapping in_openglManas Nayak
 
R-ggplot2 package Examples
R-ggplot2 package ExamplesR-ggplot2 package Examples
R-ggplot2 package ExamplesDr. Volkan OBAN
 
Surface3d in R and rgl package.
Surface3d in R and rgl package.Surface3d in R and rgl package.
Surface3d in R and rgl package.Dr. Volkan OBAN
 
Intro to ggplot2 - Sheffield R Users Group, Feb 2015
Intro to ggplot2 - Sheffield R Users Group, Feb 2015Intro to ggplot2 - Sheffield R Users Group, Feb 2015
Intro to ggplot2 - Sheffield R Users Group, Feb 2015Paul Richards
 
Lecture on graphics
Lecture on graphicsLecture on graphics
Lecture on graphicsRafi_Dar
 
Master defence 2020 - Vadym Korshunov - Region-Selected Image Generation with...
Master defence 2020 - Vadym Korshunov - Region-Selected Image Generation with...Master defence 2020 - Vadym Korshunov - Region-Selected Image Generation with...
Master defence 2020 - Vadym Korshunov - Region-Selected Image Generation with...Lviv Data Science Summer School
 
peRm R group. Review of packages for r for market data downloading and analysis
peRm R group. Review of packages for r for market data downloading and analysispeRm R group. Review of packages for r for market data downloading and analysis
peRm R group. Review of packages for r for market data downloading and analysisVyacheslav Arbuzov
 
LSGAN - SIMPle(Simple Idea Meaningful Performance Level up)
LSGAN - SIMPle(Simple Idea Meaningful Performance Level up)LSGAN - SIMPle(Simple Idea Meaningful Performance Level up)
LSGAN - SIMPle(Simple Idea Meaningful Performance Level up)Hansol Kang
 
Graph convolutional networks in apache spark
Graph convolutional networks in apache sparkGraph convolutional networks in apache spark
Graph convolutional networks in apache sparkEmiliano Martinez Sanchez
 
Fun with D3.js: Data Visualization Eye Candy with Streaming JSON
Fun with D3.js: Data Visualization Eye Candy with Streaming JSONFun with D3.js: Data Visualization Eye Candy with Streaming JSON
Fun with D3.js: Data Visualization Eye Candy with Streaming JSONTomomi Imura
 
Computer graphics practical(jainam)
Computer graphics practical(jainam)Computer graphics practical(jainam)
Computer graphics practical(jainam)JAINAM KAPADIYA
 
Computer Graphics Programes
Computer Graphics ProgramesComputer Graphics Programes
Computer Graphics ProgramesAbhishek Sharma
 

Mais procurados (20)

Computer graphics
Computer graphics Computer graphics
Computer graphics
 
Introduction to graphics programming in c
Introduction to graphics programming in cIntroduction to graphics programming in c
Introduction to graphics programming in c
 
Real life XNA
Real life XNAReal life XNA
Real life XNA
 
12. Map | WeakMap | ES6 | JavaScript | Typescript
12. Map | WeakMap | ES6 | JavaScript | Typescript12. Map | WeakMap | ES6 | JavaScript | Typescript
12. Map | WeakMap | ES6 | JavaScript | Typescript
 
Data visualization using the grammar of graphics
Data visualization using the grammar of graphicsData visualization using the grammar of graphics
Data visualization using the grammar of graphics
 
C Graphics Functions
C Graphics FunctionsC Graphics Functions
C Graphics Functions
 
Texture mapping in_opengl
Texture mapping in_openglTexture mapping in_opengl
Texture mapping in_opengl
 
R-ggplot2 package Examples
R-ggplot2 package ExamplesR-ggplot2 package Examples
R-ggplot2 package Examples
 
Surface3d in R and rgl package.
Surface3d in R and rgl package.Surface3d in R and rgl package.
Surface3d in R and rgl package.
 
Cg lab cse-v (1) (1)
Cg lab cse-v (1) (1)Cg lab cse-v (1) (1)
Cg lab cse-v (1) (1)
 
Intro to ggplot2 - Sheffield R Users Group, Feb 2015
Intro to ggplot2 - Sheffield R Users Group, Feb 2015Intro to ggplot2 - Sheffield R Users Group, Feb 2015
Intro to ggplot2 - Sheffield R Users Group, Feb 2015
 
Lecture on graphics
Lecture on graphicsLecture on graphics
Lecture on graphics
 
Master defence 2020 - Vadym Korshunov - Region-Selected Image Generation with...
Master defence 2020 - Vadym Korshunov - Region-Selected Image Generation with...Master defence 2020 - Vadym Korshunov - Region-Selected Image Generation with...
Master defence 2020 - Vadym Korshunov - Region-Selected Image Generation with...
 
peRm R group. Review of packages for r for market data downloading and analysis
peRm R group. Review of packages for r for market data downloading and analysispeRm R group. Review of packages for r for market data downloading and analysis
peRm R group. Review of packages for r for market data downloading and analysis
 
LSGAN - SIMPle(Simple Idea Meaningful Performance Level up)
LSGAN - SIMPle(Simple Idea Meaningful Performance Level up)LSGAN - SIMPle(Simple Idea Meaningful Performance Level up)
LSGAN - SIMPle(Simple Idea Meaningful Performance Level up)
 
D3
D3D3
D3
 
Graph convolutional networks in apache spark
Graph convolutional networks in apache sparkGraph convolutional networks in apache spark
Graph convolutional networks in apache spark
 
Fun with D3.js: Data Visualization Eye Candy with Streaming JSON
Fun with D3.js: Data Visualization Eye Candy with Streaming JSONFun with D3.js: Data Visualization Eye Candy with Streaming JSON
Fun with D3.js: Data Visualization Eye Candy with Streaming JSON
 
Computer graphics practical(jainam)
Computer graphics practical(jainam)Computer graphics practical(jainam)
Computer graphics practical(jainam)
 
Computer Graphics Programes
Computer Graphics ProgramesComputer Graphics Programes
Computer Graphics Programes
 

Semelhante a Data Visualization Tools, Techniques and Resources

Structuring Spark: DataFrames, Datasets, and Streaming by Michael Armbrust
Structuring Spark: DataFrames, Datasets, and Streaming by Michael ArmbrustStructuring Spark: DataFrames, Datasets, and Streaming by Michael Armbrust
Structuring Spark: DataFrames, Datasets, and Streaming by Michael ArmbrustSpark Summit
 
Structuring Spark: DataFrames, Datasets, and Streaming
Structuring Spark: DataFrames, Datasets, and StreamingStructuring Spark: DataFrames, Datasets, and Streaming
Structuring Spark: DataFrames, Datasets, and StreamingDatabricks
 
Structuring Apache Spark 2.0: SQL, DataFrames, Datasets And Streaming - by Mi...
Structuring Apache Spark 2.0: SQL, DataFrames, Datasets And Streaming - by Mi...Structuring Apache Spark 2.0: SQL, DataFrames, Datasets And Streaming - by Mi...
Structuring Apache Spark 2.0: SQL, DataFrames, Datasets And Streaming - by Mi...Databricks
 
MADlib Architecture and Functional Demo on How to Use MADlib/PivotalR
MADlib Architecture and Functional Demo on How to Use MADlib/PivotalRMADlib Architecture and Functional Demo on How to Use MADlib/PivotalR
MADlib Architecture and Functional Demo on How to Use MADlib/PivotalRPivotalOpenSourceHub
 
Visualization of Big Data in Web Apps
Visualization of Big Data in Web AppsVisualization of Big Data in Web Apps
Visualization of Big Data in Web AppsEPAM
 
EnrichmentWeek Binus Computer Vision
EnrichmentWeek Binus Computer VisionEnrichmentWeek Binus Computer Vision
EnrichmentWeek Binus Computer Visiongiamuhammad
 
Scalding big ADta
Scalding big ADtaScalding big ADta
Scalding big ADtab0ris_1
 
Architecture for scalable Angular applications
Architecture for scalable Angular applicationsArchitecture for scalable Angular applications
Architecture for scalable Angular applicationsPaweł Żurowski
 
State of the Art Web Mapping with Open Source
State of the Art Web Mapping with Open SourceState of the Art Web Mapping with Open Source
State of the Art Web Mapping with Open SourceOSCON Byrum
 
[1D6]RE-view of Android L developer PRE-view
[1D6]RE-view of Android L developer PRE-view[1D6]RE-view of Android L developer PRE-view
[1D6]RE-view of Android L developer PRE-viewNAVER D2
 
a data driven game object system
a data driven game object systema data driven game object system
a data driven game object systemmaa77
 
Graph computation
Graph computationGraph computation
Graph computationSigmoid
 
Introduction to spark
Introduction to sparkIntroduction to spark
Introduction to sparkDuyhai Doan
 
RDataMining slides-r-programming
RDataMining slides-r-programmingRDataMining slides-r-programming
RDataMining slides-r-programmingYanchang Zhao
 
Rethinking metrics: metrics 2.0 @ Lisa 2014
Rethinking metrics: metrics 2.0 @ Lisa 2014Rethinking metrics: metrics 2.0 @ Lisa 2014
Rethinking metrics: metrics 2.0 @ Lisa 2014Dieter Plaetinck
 
Scaling Up: How Switching to Apache Spark Improved Performance, Realizability...
Scaling Up: How Switching to Apache Spark Improved Performance, Realizability...Scaling Up: How Switching to Apache Spark Improved Performance, Realizability...
Scaling Up: How Switching to Apache Spark Improved Performance, Realizability...Databricks
 
Scaling up data science applications
Scaling up data science applicationsScaling up data science applications
Scaling up data science applicationsKexin Xie
 

Semelhante a Data Visualization Tools, Techniques and Resources (20)

Structuring Spark: DataFrames, Datasets, and Streaming by Michael Armbrust
Structuring Spark: DataFrames, Datasets, and Streaming by Michael ArmbrustStructuring Spark: DataFrames, Datasets, and Streaming by Michael Armbrust
Structuring Spark: DataFrames, Datasets, and Streaming by Michael Armbrust
 
Structuring Spark: DataFrames, Datasets, and Streaming
Structuring Spark: DataFrames, Datasets, and StreamingStructuring Spark: DataFrames, Datasets, and Streaming
Structuring Spark: DataFrames, Datasets, and Streaming
 
Structuring Apache Spark 2.0: SQL, DataFrames, Datasets And Streaming - by Mi...
Structuring Apache Spark 2.0: SQL, DataFrames, Datasets And Streaming - by Mi...Structuring Apache Spark 2.0: SQL, DataFrames, Datasets And Streaming - by Mi...
Structuring Apache Spark 2.0: SQL, DataFrames, Datasets And Streaming - by Mi...
 
MADlib Architecture and Functional Demo on How to Use MADlib/PivotalR
MADlib Architecture and Functional Demo on How to Use MADlib/PivotalRMADlib Architecture and Functional Demo on How to Use MADlib/PivotalR
MADlib Architecture and Functional Demo on How to Use MADlib/PivotalR
 
Visualization of Big Data in Web Apps
Visualization of Big Data in Web AppsVisualization of Big Data in Web Apps
Visualization of Big Data in Web Apps
 
EnrichmentWeek Binus Computer Vision
EnrichmentWeek Binus Computer VisionEnrichmentWeek Binus Computer Vision
EnrichmentWeek Binus Computer Vision
 
Scalding big ADta
Scalding big ADtaScalding big ADta
Scalding big ADta
 
Architecture for scalable Angular applications
Architecture for scalable Angular applicationsArchitecture for scalable Angular applications
Architecture for scalable Angular applications
 
State of the Art Web Mapping with Open Source
State of the Art Web Mapping with Open SourceState of the Art Web Mapping with Open Source
State of the Art Web Mapping with Open Source
 
[1D6]RE-view of Android L developer PRE-view
[1D6]RE-view of Android L developer PRE-view[1D6]RE-view of Android L developer PRE-view
[1D6]RE-view of Android L developer PRE-view
 
a data driven game object system
a data driven game object systema data driven game object system
a data driven game object system
 
Seeing Like Software
Seeing Like SoftwareSeeing Like Software
Seeing Like Software
 
Graph computation
Graph computationGraph computation
Graph computation
 
R programmingmilano
R programmingmilanoR programmingmilano
R programmingmilano
 
Introduction to spark
Introduction to sparkIntroduction to spark
Introduction to spark
 
RDataMining slides-r-programming
RDataMining slides-r-programmingRDataMining slides-r-programming
RDataMining slides-r-programming
 
Rethinking metrics: metrics 2.0 @ Lisa 2014
Rethinking metrics: metrics 2.0 @ Lisa 2014Rethinking metrics: metrics 2.0 @ Lisa 2014
Rethinking metrics: metrics 2.0 @ Lisa 2014
 
Scaling Up: How Switching to Apache Spark Improved Performance, Realizability...
Scaling Up: How Switching to Apache Spark Improved Performance, Realizability...Scaling Up: How Switching to Apache Spark Improved Performance, Realizability...
Scaling Up: How Switching to Apache Spark Improved Performance, Realizability...
 
Scaling up data science applications
Scaling up data science applicationsScaling up data science applications
Scaling up data science applications
 
Big datacourse
Big datacourseBig datacourse
Big datacourse
 

Mais de Amit Kapoor

Python Visualisation for Data Science
Python Visualisation for Data SciencePython Visualisation for Data Science
Python Visualisation for Data ScienceAmit Kapoor
 
Deep Learning for NLP
Deep Learning for NLPDeep Learning for NLP
Deep Learning for NLPAmit Kapoor
 
The Power of Ensembles in Machine Learning
The Power of Ensembles in Machine LearningThe Power of Ensembles in Machine Learning
The Power of Ensembles in Machine LearningAmit Kapoor
 
Model Visualisation
Model VisualisationModel Visualisation
Model VisualisationAmit Kapoor
 
Storytelling with Data - Approach | Skills
Storytelling with Data - Approach | SkillsStorytelling with Data - Approach | Skills
Storytelling with Data - Approach | SkillsAmit Kapoor
 
Learning the Craft of Data Visualisation
Learning the Craft of Data VisualisationLearning the Craft of Data Visualisation
Learning the Craft of Data VisualisationAmit Kapoor
 
Fifth Elephant 2014 talk - Crafting Visual Stories with Data
Fifth Elephant 2014 talk - Crafting Visual Stories with DataFifth Elephant 2014 talk - Crafting Visual Stories with Data
Fifth Elephant 2014 talk - Crafting Visual Stories with DataAmit Kapoor
 
Storytelling with Data - See | Show | Tell | Engage
Storytelling with Data - See | Show | Tell | EngageStorytelling with Data - See | Show | Tell | Engage
Storytelling with Data - See | Show | Tell | EngageAmit Kapoor
 
Crafting Visual Stories with Data
Crafting Visual Stories with DataCrafting Visual Stories with Data
Crafting Visual Stories with DataAmit Kapoor
 
Business Process Improvement - A Strategic and Supply Chain Perspective
Business Process Improvement - A Strategic and Supply Chain Perspective Business Process Improvement - A Strategic and Supply Chain Perspective
Business Process Improvement - A Strategic and Supply Chain Perspective Amit Kapoor
 
What makes a data-story work?
What makes a data-story work?What makes a data-story work?
What makes a data-story work?Amit Kapoor
 
What is Strategy - Thinking like a Strategist
What is Strategy - Thinking like a StrategistWhat is Strategy - Thinking like a Strategist
What is Strategy - Thinking like a StrategistAmit Kapoor
 
Telling Stories with Data - Using Story Spine
Telling Stories with Data - Using Story SpineTelling Stories with Data - Using Story Spine
Telling Stories with Data - Using Story SpineAmit Kapoor
 
Story Structure and Modern Storytelling
Story Structure and Modern StorytellingStory Structure and Modern Storytelling
Story Structure and Modern StorytellingAmit Kapoor
 
Targeting the Moment of Truth - Using Big Data in Retail
Targeting the Moment of Truth - Using Big Data in RetailTargeting the Moment of Truth - Using Big Data in Retail
Targeting the Moment of Truth - Using Big Data in RetailAmit Kapoor
 
Storytelling - Gutenberg
Storytelling - GutenbergStorytelling - Gutenberg
Storytelling - GutenbergAmit Kapoor
 
Analytics in Consulting
Analytics in ConsultingAnalytics in Consulting
Analytics in ConsultingAmit Kapoor
 
Retail Pricing Perspective
Retail Pricing PerspectiveRetail Pricing Perspective
Retail Pricing PerspectiveAmit Kapoor
 

Mais de Amit Kapoor (18)

Python Visualisation for Data Science
Python Visualisation for Data SciencePython Visualisation for Data Science
Python Visualisation for Data Science
 
Deep Learning for NLP
Deep Learning for NLPDeep Learning for NLP
Deep Learning for NLP
 
The Power of Ensembles in Machine Learning
The Power of Ensembles in Machine LearningThe Power of Ensembles in Machine Learning
The Power of Ensembles in Machine Learning
 
Model Visualisation
Model VisualisationModel Visualisation
Model Visualisation
 
Storytelling with Data - Approach | Skills
Storytelling with Data - Approach | SkillsStorytelling with Data - Approach | Skills
Storytelling with Data - Approach | Skills
 
Learning the Craft of Data Visualisation
Learning the Craft of Data VisualisationLearning the Craft of Data Visualisation
Learning the Craft of Data Visualisation
 
Fifth Elephant 2014 talk - Crafting Visual Stories with Data
Fifth Elephant 2014 talk - Crafting Visual Stories with DataFifth Elephant 2014 talk - Crafting Visual Stories with Data
Fifth Elephant 2014 talk - Crafting Visual Stories with Data
 
Storytelling with Data - See | Show | Tell | Engage
Storytelling with Data - See | Show | Tell | EngageStorytelling with Data - See | Show | Tell | Engage
Storytelling with Data - See | Show | Tell | Engage
 
Crafting Visual Stories with Data
Crafting Visual Stories with DataCrafting Visual Stories with Data
Crafting Visual Stories with Data
 
Business Process Improvement - A Strategic and Supply Chain Perspective
Business Process Improvement - A Strategic and Supply Chain Perspective Business Process Improvement - A Strategic and Supply Chain Perspective
Business Process Improvement - A Strategic and Supply Chain Perspective
 
What makes a data-story work?
What makes a data-story work?What makes a data-story work?
What makes a data-story work?
 
What is Strategy - Thinking like a Strategist
What is Strategy - Thinking like a StrategistWhat is Strategy - Thinking like a Strategist
What is Strategy - Thinking like a Strategist
 
Telling Stories with Data - Using Story Spine
Telling Stories with Data - Using Story SpineTelling Stories with Data - Using Story Spine
Telling Stories with Data - Using Story Spine
 
Story Structure and Modern Storytelling
Story Structure and Modern StorytellingStory Structure and Modern Storytelling
Story Structure and Modern Storytelling
 
Targeting the Moment of Truth - Using Big Data in Retail
Targeting the Moment of Truth - Using Big Data in RetailTargeting the Moment of Truth - Using Big Data in Retail
Targeting the Moment of Truth - Using Big Data in Retail
 
Storytelling - Gutenberg
Storytelling - GutenbergStorytelling - Gutenberg
Storytelling - Gutenberg
 
Analytics in Consulting
Analytics in ConsultingAnalytics in Consulting
Analytics in Consulting
 
Retail Pricing Perspective
Retail Pricing PerspectiveRetail Pricing Perspective
Retail Pricing Perspective
 

Último

Identifying Appropriate Test Statistics Involving Population Mean
Identifying Appropriate Test Statistics Involving Population MeanIdentifying Appropriate Test Statistics Involving Population Mean
Identifying Appropriate Test Statistics Involving Population MeanMYRABACSAFRA2
 
Data Factory in Microsoft Fabric (MsBIP #82)
Data Factory in Microsoft Fabric (MsBIP #82)Data Factory in Microsoft Fabric (MsBIP #82)
Data Factory in Microsoft Fabric (MsBIP #82)Cathrine Wilhelmsen
 
Student profile product demonstration on grades, ability, well-being and mind...
Student profile product demonstration on grades, ability, well-being and mind...Student profile product demonstration on grades, ability, well-being and mind...
Student profile product demonstration on grades, ability, well-being and mind...Seán Kennedy
 
Advanced Machine Learning for Business Professionals
Advanced Machine Learning for Business ProfessionalsAdvanced Machine Learning for Business Professionals
Advanced Machine Learning for Business ProfessionalsVICTOR MAESTRE RAMIREZ
 
RS 9000 Call In girls Dwarka Mor (DELHI)⇛9711147426🔝Delhi
RS 9000 Call In girls Dwarka Mor (DELHI)⇛9711147426🔝DelhiRS 9000 Call In girls Dwarka Mor (DELHI)⇛9711147426🔝Delhi
RS 9000 Call In girls Dwarka Mor (DELHI)⇛9711147426🔝Delhijennyeacort
 
办理学位证中佛罗里达大学毕业证,UCF成绩单原版一比一
办理学位证中佛罗里达大学毕业证,UCF成绩单原版一比一办理学位证中佛罗里达大学毕业证,UCF成绩单原版一比一
办理学位证中佛罗里达大学毕业证,UCF成绩单原版一比一F sss
 
Biometric Authentication: The Evolution, Applications, Benefits and Challenge...
Biometric Authentication: The Evolution, Applications, Benefits and Challenge...Biometric Authentication: The Evolution, Applications, Benefits and Challenge...
Biometric Authentication: The Evolution, Applications, Benefits and Challenge...GQ Research
 
INTERNSHIP ON PURBASHA COMPOSITE TEX LTD
INTERNSHIP ON PURBASHA COMPOSITE TEX LTDINTERNSHIP ON PURBASHA COMPOSITE TEX LTD
INTERNSHIP ON PURBASHA COMPOSITE TEX LTDRafezzaman
 
专业一比一美国俄亥俄大学毕业证成绩单pdf电子版制作修改
专业一比一美国俄亥俄大学毕业证成绩单pdf电子版制作修改专业一比一美国俄亥俄大学毕业证成绩单pdf电子版制作修改
专业一比一美国俄亥俄大学毕业证成绩单pdf电子版制作修改yuu sss
 
Semantic Shed - Squashing and Squeezing.pptx
Semantic Shed - Squashing and Squeezing.pptxSemantic Shed - Squashing and Squeezing.pptx
Semantic Shed - Squashing and Squeezing.pptxMike Bennett
 
Predicting Salary Using Data Science: A Comprehensive Analysis.pdf
Predicting Salary Using Data Science: A Comprehensive Analysis.pdfPredicting Salary Using Data Science: A Comprehensive Analysis.pdf
Predicting Salary Using Data Science: A Comprehensive Analysis.pdfBoston Institute of Analytics
 
Student Profile Sample report on improving academic performance by uniting gr...
Student Profile Sample report on improving academic performance by uniting gr...Student Profile Sample report on improving academic performance by uniting gr...
Student Profile Sample report on improving academic performance by uniting gr...Seán Kennedy
 
LLMs, LMMs, their Improvement Suggestions and the Path towards AGI
LLMs, LMMs, their Improvement Suggestions and the Path towards AGILLMs, LMMs, their Improvement Suggestions and the Path towards AGI
LLMs, LMMs, their Improvement Suggestions and the Path towards AGIThomas Poetter
 
Decoding the Heart: Student Presentation on Heart Attack Prediction with Data...
Decoding the Heart: Student Presentation on Heart Attack Prediction with Data...Decoding the Heart: Student Presentation on Heart Attack Prediction with Data...
Decoding the Heart: Student Presentation on Heart Attack Prediction with Data...Boston Institute of Analytics
 
毕业文凭制作#回国入职#diploma#degree澳洲中央昆士兰大学毕业证成绩单pdf电子版制作修改#毕业文凭制作#回国入职#diploma#degree
毕业文凭制作#回国入职#diploma#degree澳洲中央昆士兰大学毕业证成绩单pdf电子版制作修改#毕业文凭制作#回国入职#diploma#degree毕业文凭制作#回国入职#diploma#degree澳洲中央昆士兰大学毕业证成绩单pdf电子版制作修改#毕业文凭制作#回国入职#diploma#degree
毕业文凭制作#回国入职#diploma#degree澳洲中央昆士兰大学毕业证成绩单pdf电子版制作修改#毕业文凭制作#回国入职#diploma#degreeyuu sss
 
DBA Basics: Getting Started with Performance Tuning.pdf
DBA Basics: Getting Started with Performance Tuning.pdfDBA Basics: Getting Started with Performance Tuning.pdf
DBA Basics: Getting Started with Performance Tuning.pdfJohn Sterrett
 
Top 5 Best Data Analytics Courses In Queens
Top 5 Best Data Analytics Courses In QueensTop 5 Best Data Analytics Courses In Queens
Top 5 Best Data Analytics Courses In Queensdataanalyticsqueen03
 
GA4 Without Cookies [Measure Camp AMS]
GA4 Without Cookies [Measure Camp AMS]GA4 Without Cookies [Measure Camp AMS]
GA4 Without Cookies [Measure Camp AMS]📊 Markus Baersch
 
NLP Data Science Project Presentation:Predicting Heart Disease with NLP Data ...
NLP Data Science Project Presentation:Predicting Heart Disease with NLP Data ...NLP Data Science Project Presentation:Predicting Heart Disease with NLP Data ...
NLP Data Science Project Presentation:Predicting Heart Disease with NLP Data ...Boston Institute of Analytics
 
modul pembelajaran robotic Workshop _ by Slidesgo.pptx
modul pembelajaran robotic Workshop _ by Slidesgo.pptxmodul pembelajaran robotic Workshop _ by Slidesgo.pptx
modul pembelajaran robotic Workshop _ by Slidesgo.pptxaleedritatuxx
 

Último (20)

Identifying Appropriate Test Statistics Involving Population Mean
Identifying Appropriate Test Statistics Involving Population MeanIdentifying Appropriate Test Statistics Involving Population Mean
Identifying Appropriate Test Statistics Involving Population Mean
 
Data Factory in Microsoft Fabric (MsBIP #82)
Data Factory in Microsoft Fabric (MsBIP #82)Data Factory in Microsoft Fabric (MsBIP #82)
Data Factory in Microsoft Fabric (MsBIP #82)
 
Student profile product demonstration on grades, ability, well-being and mind...
Student profile product demonstration on grades, ability, well-being and mind...Student profile product demonstration on grades, ability, well-being and mind...
Student profile product demonstration on grades, ability, well-being and mind...
 
Advanced Machine Learning for Business Professionals
Advanced Machine Learning for Business ProfessionalsAdvanced Machine Learning for Business Professionals
Advanced Machine Learning for Business Professionals
 
RS 9000 Call In girls Dwarka Mor (DELHI)⇛9711147426🔝Delhi
RS 9000 Call In girls Dwarka Mor (DELHI)⇛9711147426🔝DelhiRS 9000 Call In girls Dwarka Mor (DELHI)⇛9711147426🔝Delhi
RS 9000 Call In girls Dwarka Mor (DELHI)⇛9711147426🔝Delhi
 
办理学位证中佛罗里达大学毕业证,UCF成绩单原版一比一
办理学位证中佛罗里达大学毕业证,UCF成绩单原版一比一办理学位证中佛罗里达大学毕业证,UCF成绩单原版一比一
办理学位证中佛罗里达大学毕业证,UCF成绩单原版一比一
 
Biometric Authentication: The Evolution, Applications, Benefits and Challenge...
Biometric Authentication: The Evolution, Applications, Benefits and Challenge...Biometric Authentication: The Evolution, Applications, Benefits and Challenge...
Biometric Authentication: The Evolution, Applications, Benefits and Challenge...
 
INTERNSHIP ON PURBASHA COMPOSITE TEX LTD
INTERNSHIP ON PURBASHA COMPOSITE TEX LTDINTERNSHIP ON PURBASHA COMPOSITE TEX LTD
INTERNSHIP ON PURBASHA COMPOSITE TEX LTD
 
专业一比一美国俄亥俄大学毕业证成绩单pdf电子版制作修改
专业一比一美国俄亥俄大学毕业证成绩单pdf电子版制作修改专业一比一美国俄亥俄大学毕业证成绩单pdf电子版制作修改
专业一比一美国俄亥俄大学毕业证成绩单pdf电子版制作修改
 
Semantic Shed - Squashing and Squeezing.pptx
Semantic Shed - Squashing and Squeezing.pptxSemantic Shed - Squashing and Squeezing.pptx
Semantic Shed - Squashing and Squeezing.pptx
 
Predicting Salary Using Data Science: A Comprehensive Analysis.pdf
Predicting Salary Using Data Science: A Comprehensive Analysis.pdfPredicting Salary Using Data Science: A Comprehensive Analysis.pdf
Predicting Salary Using Data Science: A Comprehensive Analysis.pdf
 
Student Profile Sample report on improving academic performance by uniting gr...
Student Profile Sample report on improving academic performance by uniting gr...Student Profile Sample report on improving academic performance by uniting gr...
Student Profile Sample report on improving academic performance by uniting gr...
 
LLMs, LMMs, their Improvement Suggestions and the Path towards AGI
LLMs, LMMs, their Improvement Suggestions and the Path towards AGILLMs, LMMs, their Improvement Suggestions and the Path towards AGI
LLMs, LMMs, their Improvement Suggestions and the Path towards AGI
 
Decoding the Heart: Student Presentation on Heart Attack Prediction with Data...
Decoding the Heart: Student Presentation on Heart Attack Prediction with Data...Decoding the Heart: Student Presentation on Heart Attack Prediction with Data...
Decoding the Heart: Student Presentation on Heart Attack Prediction with Data...
 
毕业文凭制作#回国入职#diploma#degree澳洲中央昆士兰大学毕业证成绩单pdf电子版制作修改#毕业文凭制作#回国入职#diploma#degree
毕业文凭制作#回国入职#diploma#degree澳洲中央昆士兰大学毕业证成绩单pdf电子版制作修改#毕业文凭制作#回国入职#diploma#degree毕业文凭制作#回国入职#diploma#degree澳洲中央昆士兰大学毕业证成绩单pdf电子版制作修改#毕业文凭制作#回国入职#diploma#degree
毕业文凭制作#回国入职#diploma#degree澳洲中央昆士兰大学毕业证成绩单pdf电子版制作修改#毕业文凭制作#回国入职#diploma#degree
 
DBA Basics: Getting Started with Performance Tuning.pdf
DBA Basics: Getting Started with Performance Tuning.pdfDBA Basics: Getting Started with Performance Tuning.pdf
DBA Basics: Getting Started with Performance Tuning.pdf
 
Top 5 Best Data Analytics Courses In Queens
Top 5 Best Data Analytics Courses In QueensTop 5 Best Data Analytics Courses In Queens
Top 5 Best Data Analytics Courses In Queens
 
GA4 Without Cookies [Measure Camp AMS]
GA4 Without Cookies [Measure Camp AMS]GA4 Without Cookies [Measure Camp AMS]
GA4 Without Cookies [Measure Camp AMS]
 
NLP Data Science Project Presentation:Predicting Heart Disease with NLP Data ...
NLP Data Science Project Presentation:Predicting Heart Disease with NLP Data ...NLP Data Science Project Presentation:Predicting Heart Disease with NLP Data ...
NLP Data Science Project Presentation:Predicting Heart Disease with NLP Data ...
 
modul pembelajaran robotic Workshop _ by Slidesgo.pptx
modul pembelajaran robotic Workshop _ by Slidesgo.pptxmodul pembelajaran robotic Workshop _ by Slidesgo.pptx
modul pembelajaran robotic Workshop _ by Slidesgo.pptx
 

Data Visualization Tools, Techniques and Resources

  • 3. Tools Landscape Abstract, Flexible, Difficult Slow, Code, Expressive Blackbox, Limited, Simple Quick, GUI, Efficient
  • 4. Tools Landscape Abstract, Flexible, Difficult Slow, Code, Expressive Blackbox, Limited, Simple Quick, GUI, Efficient Canvas Paint directly on a pixel grid. Design & manage every element of chart Processing Nodebox sketchpad Raphael.js Paper.js Processing.js
  • 5. Processing - Pie Chart size(400, 400); background(255); smooth(); noStroke(); int diameter = 200; float[] data = {5, 25, 15, 20, 10}; int[] sat = {25, 75, 125, 175, 225}; float lastAngle = 0, sum = 0; for (int i = 0; i < data.length; i++) sum += data[i]; for (int i = 0; i < data.length; i++) { fill(sat[i]); float angle = data[i] / sum * 2 * PI; arc(width / 2, height / 2, diameter, diameter, lastAngle, lastAngle + angle); lastAngle += angle; } Source: Processing
  • 6. Tools Landscape Abstract, Flexible, Difficult Slow, Code, Expressive Blackbox, Limited, Simple Quick, GUI, Efficient Canvas Charting Collection of fixed charts that require data to be shaped in a particular way Excel Mondrian Many Eyes Google Charts HighCharts Fusion Charts Paint directly on a pixel grid. Design & manage every element of chart Processing Nodebox sketchpad Raphael.js Paper.js Processing.js
  • 7. Excel - Chart Typology
  • 9. Excel - Pie, Line, Area
  • 11. Excel - Types, Others
  • 12. Excel - Trees, Streams Source: Microsoft Research
  • 14. Google Charts - Pie Source: Google Charts Playground function drawVisualization() { // Create and populate the data table. var data = google.visualization. arrayToDataTable([ ['Areas', 'Sales'], ['North', 5], ['East', 25], ['West', 15], ['South', 20], ['Central', 10] ]); // Create and draw the visualization. new google.visualization.PieChart (document.getElementById ('visualization')). draw(data, {title:"Sales by Area"}); }
  • 18. Tools Landscape Abstract, Flexible, Difficult Slow, Code, Expressive Blackbox, Limited, Simple Quick, GUI, Efficient Canvas Charting Collection of fixed charts that require data to be shaped in a particular way Excel Mondrian Many Eyes Google Charts HighCharts Fusion Charts Paint directly on a pixel grid. Design & manage every element of chart Processing Nodebox sketchpad Raphael.js Paper.js Processing.js Visual Visual analysis languages allowing flexibility to design many variants Tableau Gephi raw Vega
  • 19. Tableau - VizQL Source: Tableau Software Public
  • 20. Gephi - Graph Viz Source: Gephi
  • 23. Tools Landscape Abstract, Flexible, Difficult Slow, Code, Expressive Blackbox, Limited, Simple Quick, GUI, Efficient Canvas Grammar Charting Collection of fixed charts that require data to be shaped in a particular way Excel Mondrian Many Eyes Google Charts HighCharts Fusion Charts Collection of graphical primitives for composing data driven graphics R-ggplot2 SPSS plot.ly d3.js Bokeh Paint directly on a pixel grid. Design & manage every element of chart Processing Nodebox sketchpad Raphael.js Paper.js Processing.js Visual Visual analysis languages allowing flexibility to design many variants Tableau Gephi raw Vega
  • 24. R - ggplot2 Source: ggplot2 areas <- c("North", "East", "West", "South", "Central") sales <- c(5, 25, 15, 20, 10) humble <- data.frame(areas, sales) ggplot(humble, aes(x = "", fill = areas, weight = sales)) + geom_bar(width = 1) + coord_polar("y")
  • 25. d3.js Source: Data-Driven Documents var data = [5, 25, 15, 20, 10]; var color = d3.scale.category20(); var svg = d3.select("body").append("svg") .attr("width", 150) .attr("height", 150); var g = svg.append("g") .attr("transform", "translate(75, 75)"); var arcs = g.selectAll("path") .data(d3.layout.pie().sort(null) (data)) .enter().append("path") .style("fill", function(d,i) { return color(i); }) .attr("d",d3.svg.arc() .innerRadius(0) .outerRadius(70));
  • 26. Tools Landscape Abstract, Flexible, Difficult Slow, Code, Expressive Blackbox, Limited, Simple Quick, GUI, Efficient Canvas Grammar Charting Collection of fixed charts that require data to be shaped in a particular way Excel Mondrian Many Eyes Google Charts HighCharts Fusion Charts Collection of graphical primitives for composing data driven graphics R-ggplot2 SPSS plot.ly d3.js Bokeh Paint directly on a pixel grid. Design & manage every element of chart Processing Nodebox sketchpad Raphael.js Paper.js Processing.js Visual Visual analysis languages allowing flexibility to design many variants Tableau Gephi raw Vega
  • 27. Foundational Semiology of Graphics Jacques Bertin Theory Exploratory Data Analysis John Tukey EDA The Visual Display of Quantitative Information Edward Tufte Excellence The Elements of Graphing Data William Cleveland Methods The Grammar of Graphics Leland Wilkinson Grammar
  • 28. Fundamentals Show Me the Numbers Stephen Few Basic Graphs Now you see it Stephen Few Exploratory Information Dashboard Design Stephen Few Dashboard Envisioning Information Edward Tufte Methods Visualising Data William Cleveland Methods
  • 29. Think, Perception, Design Unfolding the Napkin / The Back of the Napkin Dan Roam Thinking The Non- Designer’s Design Book Robin Williams Graphic Design The Design of Everyday Things Donald Norman Human Object Interaction Information Visualization: Perception for Design Colin Ware Perception Visual Thinking for Design Colin Ware Visual Cognition
  • 30. Process & Tools Data Visualization: A Successful Design Process Andy Kirk Approach Visualizing Data Ben Fry Processing / Approach Interactive Data Visualization Scott Murray D3.js ggplot2: Elegant Graphics for Data Analysis Hadley Wickam R: ggplot2 Data Journalism Handbook Open Knowledge Data Journalism
  • 31. Storytelling Resonate Nancy Duarte Stories Slidedocs Nancy Duarte Slides + Documents Making Comics Scott McCloud Images + Words Improving your Storytelling Doug Lipman Oral Storytelling The Story Factor Annette Simmons Business Storytelling
  • 32. Blogs and Links ● Guardian Data Blog ● New York Times ● Excel Charts ● Visualising Data ● Fell in Love with Data ● Flowing Data ● datavisualization.ch ● Eager eyes ● Junk Charts ● Information Aesthetics ● HBR - Persuading with Data A collection of blogs by Flowing Data
  • 33. Courses ● Jeffrey Heer - CSE512 Data Visualization ● Tamara Munzer - CS533-09 Information Visualization ● Udacity - Intro to Data Science ● Udacity - Exploratory Data Analysis